In the competitive restaurant industry, two giants stand out: Darden Restaurants, Inc. (DRI) and Domino’s Pizza, Inc. (DPZ). Both companies dominate different segments of the casual dining and quick-service markets, leveraging unique innovation strategies and operational scales. This comparison explores their market positions, growth potential, and investment merits. Join me as we uncover which company could be the smarter addition to your investment portfolio.

Table of contents
Companies Overview
I will begin the comparison between Darden Restaurants and Domino’s Pizza by providing an overview of these two companies and their main differences.
Darden Restaurants Overview
Darden Restaurants, Inc. operates full-service restaurants primarily in the United States and Canada. Its portfolio includes well-known brands such as Olive Garden and LongHorn Steakhouse, totaling 1,867 restaurants as of mid-2022. Founded in 1968 and headquartered in Orlando, Florida, Darden focuses on delivering diverse dining experiences across multiple casual dining concepts.
Domino’s Pizza Overview
Domino’s Pizza, Inc. operates as a global pizza company with a presence in approximately 18,800 stores across 90 markets. The company runs three segments: U.S. Stores, International Franchise, and Supply Chain, offering pizzas alongside other menu items like sandwiches and desserts. Founded in 1960 and based in Ann Arbor, Michigan, Domino’s emphasizes quick-service pizza delivery and franchise growth.
Key similarities and differences
Both companies operate within the restaurant industry but differ in their service models: Darden specializes in full-service dining with a broad range of restaurant brands, while Domino’s focuses on quick-service pizza delivery and franchising. Darden’s business relies heavily on company-owned locations, whereas Domino’s balances company-owned and franchised stores globally. Their differing operational approaches reflect distinct market strategies within the consumer cyclical sector.
Income Statement Comparison
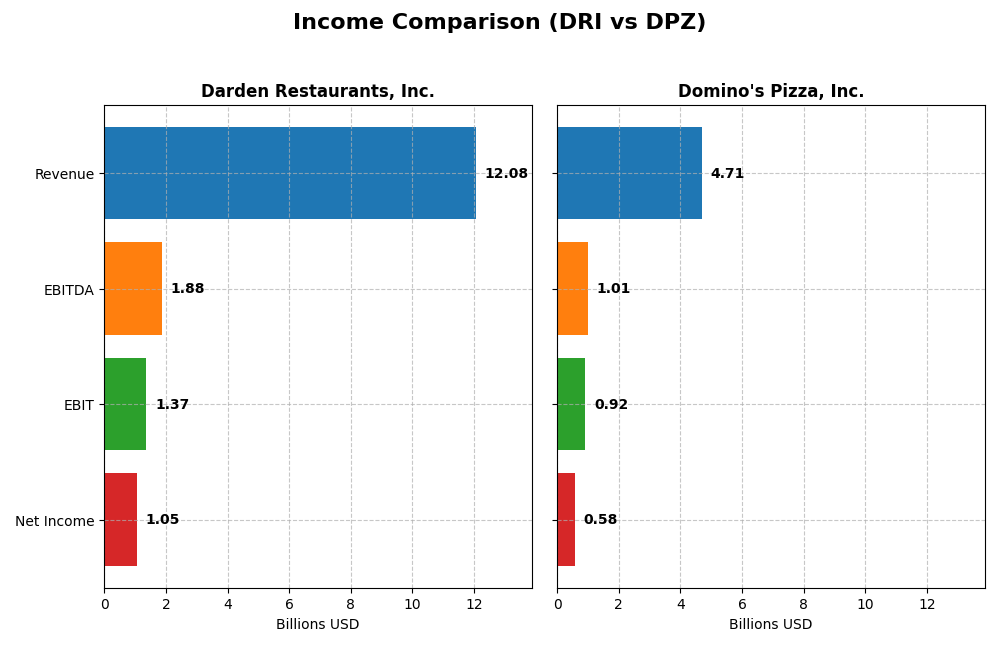
This table provides a snapshot comparison of key income statement metrics for Darden Restaurants, Inc. and Domino’s Pizza, Inc. for their most recent fiscal years.
| Metric | Darden Restaurants, Inc. (DRI) | Domino’s Pizza, Inc. (DPZ) |
|---|---|---|
| Market Cap | 23.6B | 13.7B |
| Revenue | 12.1B | 4.7B |
| EBITDA | 1.88B | 1.01B |
| EBIT | 1.37B | 918M |
| Net Income | 1.05B | 584M |
| EPS | 8.93 | 16.82 |
| Fiscal Year | 2025 | 2024 |
Income Statement Interpretations
Darden Restaurants, Inc.
Over 2021-2025, Darden Restaurants, Inc. showed strong revenue growth of 67.82%, with net income rising 66.79%. Gross and EBIT margins remained favorable around 21.88% and 11.31%, respectively, though net margin slightly declined by 0.62%. In 2025, revenue grew 6.03% but net margin dipped 3.67%, signaling some pressure on profitability despite continued EPS gains.
Domino’s Pizza, Inc.
Domino’s Pizza, Inc. experienced moderate revenue growth of 14.31% and net income growth of 18.9% from 2020 to 2024. Margins were notably higher than Darden’s, with gross margin at 39.28% and EBIT margin at 19.51%. In 2024, revenue rose 5.07%, and net margin improved 7.1%, reflecting solid operational efficiency alongside favorable EPS growth of 14.32%.
Which one has the stronger fundamentals?
Domino’s Pizza displays stronger margin profiles and more consistent margin expansion, supported by favorable EBIT and net margin growth. Darden shows higher absolute revenue and net income growth but faces slight margin contraction. Both have favorable income statements overall, yet Domino’s superior profitability metrics suggest steadier fundamental strength in margin management.
Financial Ratios Comparison
The table below presents the most recent fiscal year financial ratios for Darden Restaurants, Inc. (DRI) and Domino’s Pizza, Inc. (DPZ), offering a factual basis for comparison.
| Ratios | Darden Restaurants, Inc. (2025) | Domino’s Pizza, Inc. (2024) |
|---|---|---|
| ROE | 45.41% | -14.74% |
| ROIC | 11.40% | 54.10% |
| P/E | 22.84 | 25.01 |
| P/B | 10.37 | -3.69 |
| Current Ratio | 0.42 | 0.56 |
| Quick Ratio | 0.28 | 0.52 |
| D/E (Debt-to-Equity) | 2.70 | -1.31 |
| Debt-to-Assets | 49.49% | 299.21% |
| Interest Coverage | 7.55 | 4.49 |
| Asset Turnover | 0.96 | 2.71 |
| Fixed Asset Turnover | 1.46 | 9.20 |
| Payout Ratio | 62.74% | 35.94% |
| Dividend Yield | 2.75% | 1.44% |
Interpretation of the Ratios
Darden Restaurants, Inc.
Darden shows a mix of strong and weak ratios; ROE at 45.41% and ROIC at 11.4% are favorable, while liquidity ratios like current ratio (0.42) and quick ratio (0.28) are unfavorable, indicating potential short-term solvency concerns. The company maintains a dividend yield of 2.75%, supported by a stable payout, though leverage remains relatively high with a D/E ratio of 2.7.
Domino’s Pizza, Inc.
Domino’s demonstrates strong operational efficiency, with favorable asset turnover (2.71) and fixed asset turnover (9.2). However, the negative ROE (-14.74%) and elevated debt-to-assets ratio (299.21%) raise concerns. The dividend yield at 1.44% is neutral, reflecting modest shareholder returns, while some liquidity ratios remain below 1, suggesting possible short-term funding risks.
Which one has the best ratios?
Both companies present slightly favorable overall ratios, but Domino’s excels in operational efficiency and capital returns despite its negative ROE. Darden offers a stronger equity return and dividend yield but struggles with liquidity and leverage. The choice depends on weighing operational strength against financial stability and shareholder return consistency.
Strategic Positioning
This section compares the strategic positioning of Darden Restaurants, Inc. and Domino’s Pizza, Inc., focusing on market position, key segments, and exposure to technological disruption:
Darden Restaurants, Inc.
- Large market cap with diverse full-service restaurants, facing moderate competitive pressure.
- Key segments include Olive Garden, LongHorn Steakhouse, and Fine Dining, driving revenue diversification.
- Limited explicit information on technological disruption exposure provided.
Domino’s Pizza, Inc.
- Smaller market cap focused on pizza with significant international presence and competition.
- Key segments are U.S. stores, International franchise, and supply chain, emphasizing pizza and related products.
- No explicit details on technological disruption exposure available.
Darden Restaurants, Inc. vs Domino’s Pizza, Inc. Positioning
Darden shows a diversified portfolio across multiple restaurant brands, providing revenue stability but facing complexity in operations. Domino’s concentrates on pizza with strong franchise and supply chain segments, which may simplify focus but increase reliance on a specific market.
Which has the best competitive advantage?
Darden maintains a very favorable moat with growing ROIC, indicating durable competitive advantage and increasing profitability. Domino’s also creates value but has a slightly favorable moat due to declining ROIC, suggesting less stable profitability.
Stock Comparison
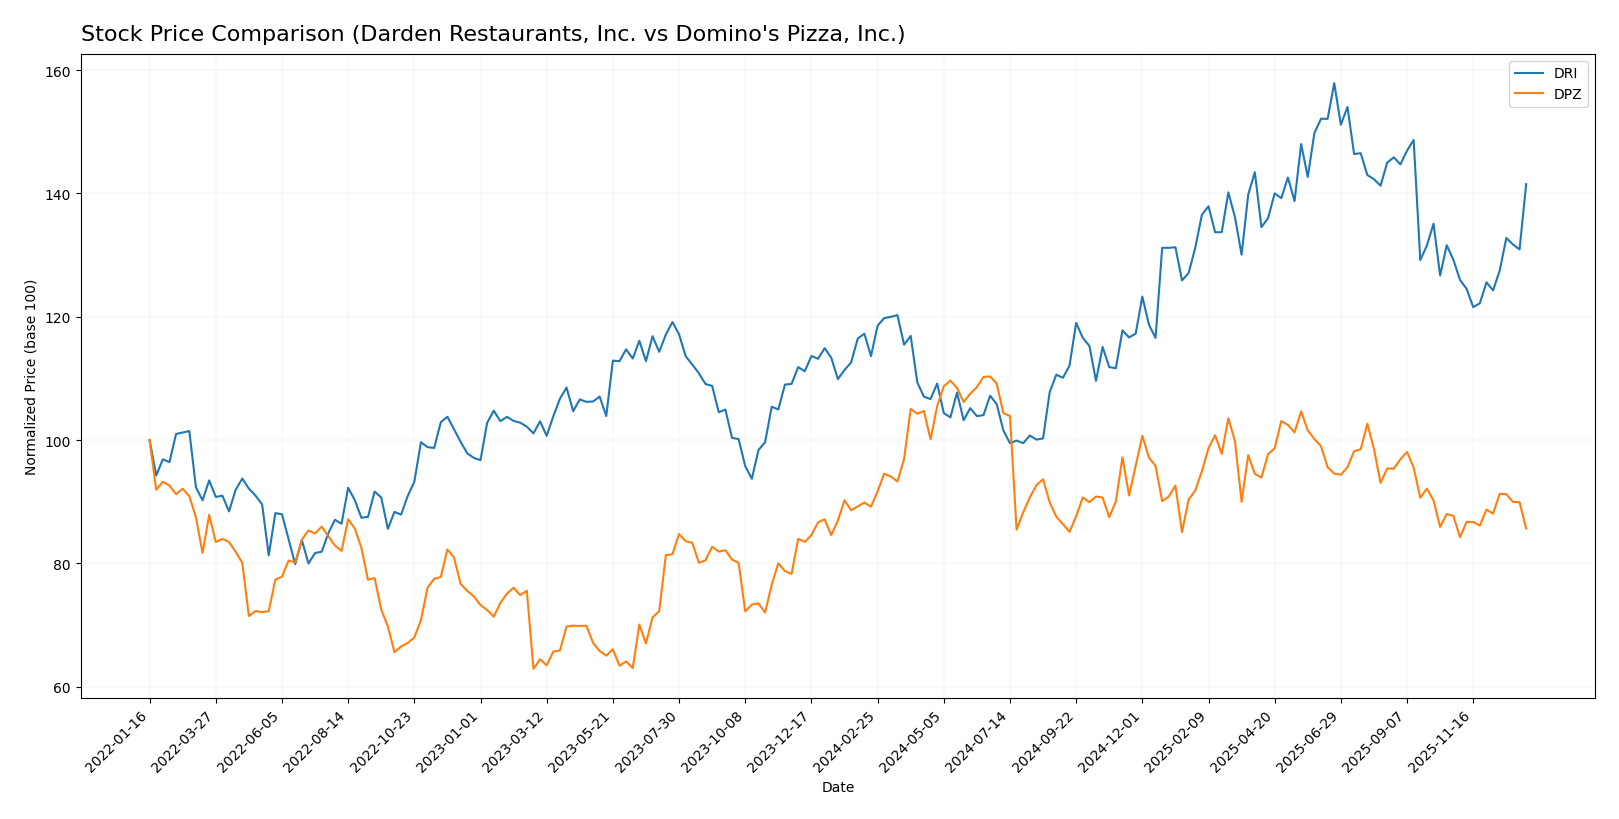
The past year showed contrasting stock price movements for Darden Restaurants, Inc. (DRI) and Domino’s Pizza, Inc. (DPZ), with DRI exhibiting a strong upward trajectory while DPZ faced a notable decline, reflecting differing trading dynamics.
Trend Analysis
Darden Restaurants, Inc. (DRI) displayed a bullish trend over the past 12 months with a 24.56% price increase and accelerating momentum, reaching a high of 225.78 and a low of 142.27.
Domino’s Pizza, Inc. (DPZ) experienced a bearish trend over the same period, with a 3.97% price decline despite accelerating trend dynamics; price ranged between 398.46 and 521.83.
Comparing the two, DRI delivered the highest market performance with a positive 24.56% return, outperforming DPZ’s negative 3.97% change over the analyzed year.
Target Prices
The analyst consensus for target prices indicates a positive outlook for both Darden Restaurants, Inc. and Domino’s Pizza, Inc.
| Company | Target High | Target Low | Consensus |
|---|---|---|---|
| Darden Restaurants, Inc. | 236 | 195 | 216.75 |
| Domino’s Pizza, Inc. | 540 | 370 | 472.5 |
Analysts expect Darden’s stock to appreciate moderately above its current price of 202.36 USD, while Domino’s shows a stronger upside potential versus its current price of 405.09 USD. Both reflect confidence but with varying risk and reward profiles.
Analyst Opinions Comparison
This section compares analysts’ ratings and grades for Darden Restaurants, Inc. and Domino’s Pizza, Inc.:
Rating Comparison
Darden Restaurants, Inc. Rating
- Rating: B+, considered very favorable by analysts.
- Discounted Cash Flow Score: 4, indicating favorable valuation.
- ROE Score: 5, very favorable, showing excellent profit generation from equity.
- ROA Score: 5, very favorable, indicating efficient asset use.
- Debt To Equity Score: 1, very unfavorable, indicating high financial risk.
- Overall Score: 3, moderate overall financial standing.
Domino’s Pizza, Inc. Rating
- Rating: C+, also considered very favorable by analysts.
- Discounted Cash Flow Score: 3, reflecting moderate valuation.
- ROE Score: 1, very unfavorable, indicating weak equity returns.
- ROA Score: 5, very favorable, indicating efficient asset use.
- Debt To Equity Score: 1, very unfavorable, indicating high financial risk.
- Overall Score: 2, moderate overall financial standing.
Which one is the best rated?
Based strictly on provided data, Darden Restaurants holds a higher rating (B+) and superior scores in discounted cash flow and return on equity than Domino’s Pizza (C+), indicating Darden is better rated overall.
Scores Comparison
The scores comparison between Darden Restaurants (DRI) and Domino’s Pizza (DPZ) are as follows:
DRI Scores
- Altman Z-Score: 2.35, indicating moderate bankruptcy risk in the grey zone.
- Piotroski Score: 7, reflecting strong financial health.
DPZ Scores
- Altman Z-Score: 3.21, indicating low bankruptcy risk in the safe zone.
- Piotroski Score: 8, reflecting very strong financial health.
Which company has the best scores?
Based strictly on the provided data, DPZ exhibits a higher Altman Z-Score in the safe zone and a superior Piotroski Score categorized as very strong, compared to DRI’s grey zone Z-Score and strong Piotroski Score.
Grades Comparison
Here is a detailed comparison of recent grades assigned to Darden Restaurants, Inc. and Domino’s Pizza, Inc.:
Darden Restaurants, Inc. Grades
The following table summarizes recent grades from established grading companies for Darden Restaurants, Inc.:
| Grading Company | Action | New Grade | Date |
|---|---|---|---|
| Truist Securities | Downgrade | Hold | 2026-01-08 |
| Barclays | Maintain | Overweight | 2026-01-07 |
| BMO Capital | Maintain | Market Perform | 2026-01-06 |
| Mizuho | Maintain | Neutral | 2025-12-22 |
| Stephens & Co. | Maintain | Equal Weight | 2025-12-19 |
| BTIG | Maintain | Buy | 2025-12-19 |
| Guggenheim | Maintain | Buy | 2025-12-17 |
| Jefferies | Maintain | Hold | 2025-12-15 |
| Morgan Stanley | Maintain | Overweight | 2025-12-12 |
| Stephens & Co. | Maintain | Equal Weight | 2025-12-11 |
Overall, Darden Restaurants shows a balanced mix of Hold and Buy ratings, with some recent downgrades but multiple maintained Buy and Overweight grades.
Domino’s Pizza, Inc. Grades
The following table presents recent ratings for Domino’s Pizza, Inc. from recognized grading firms:
| Grading Company | Action | New Grade | Date |
|---|---|---|---|
| Evercore ISI Group | Maintain | Outperform | 2026-01-08 |
| Stifel | Maintain | Buy | 2026-01-07 |
| Barclays | Maintain | Underweight | 2026-01-07 |
| TD Cowen | Downgrade | Hold | 2026-01-05 |
| BTIG | Maintain | Buy | 2025-11-14 |
| RBC Capital | Maintain | Sector Perform | 2025-10-15 |
| TD Cowen | Maintain | Buy | 2025-10-15 |
| B of A Securities | Maintain | Buy | 2025-10-15 |
| BTIG | Maintain | Buy | 2025-10-15 |
| TD Cowen | Maintain | Buy | 2025-10-14 |
Domino’s Pizza generally receives strong Buy and Outperform ratings, though a few Hold and Underweight grades indicate some caution.
Which company has the best grades?
Both companies have a majority of Buy-related ratings, but Domino’s Pizza shows a stronger consensus with multiple Outperform and Buy grades from top firms. This suggests a slightly more favorable outlook, which may influence investor confidence and portfolio decisions differently.
Strengths and Weaknesses
Below is a comparison of key strengths and weaknesses for Darden Restaurants, Inc. (DRI) and Domino’s Pizza, Inc. (DPZ) based on the most recent data from 2024-2025.
| Criterion | Darden Restaurants, Inc. (DRI) | Domino’s Pizza, Inc. (DPZ) |
|---|---|---|
| Diversification | Strong diversification with multiple segments: Olive Garden (5.2B), LongHorn Steakhouse (3B), Fine Dining and others | Moderate diversification: Supply Chain (2.8B), Domestic Stores (1.5B), International Franchise (318M) |
| Profitability | ROIC 11.4%, Net Margin 8.7%, ROE 45.4%, favorable ratios overall | ROIC 54.1%, Net Margin 12.4%, but negative ROE (-14.7%) signals profitability issues despite high ROIC |
| Innovation | Moderate innovation focus; steady growth in ROIC (58% trend) | High innovation in supply chain and operations but declining ROIC (-4.4% trend) indicates challenges |
| Global presence | Primarily US-focused with some international exposure | Strong international franchise presence with growing global footprint |
| Market Share | Large market share in casual dining with strong brand portfolio | Leading position in pizza delivery and carryout with scalable franchise model |
Darden Restaurants demonstrates a durable competitive advantage with diversified brands and consistent profitability growth, making it a stable investment choice. Domino’s shows strong value creation and global reach but faces challenges in profitability trends and leverage, requiring cautious risk management.
Risk Analysis
Below is a comparison of key risks for Darden Restaurants, Inc. (DRI) and Domino’s Pizza, Inc. (DPZ) based on the most recent data available.
| Metric | Darden Restaurants, Inc. (DRI) | Domino’s Pizza, Inc. (DPZ) |
|---|---|---|
| Market Risk | Beta 0.636, indicating lower volatility and moderate market sensitivity | Beta 1.158, higher volatility and sensitivity to market swings |
| Debt Level | High debt-to-equity ratio (2.7), debt-to-assets ~49.5%, unfavorable leverage | Debt-to-equity negative (-1.31) but extremely high debt-to-assets (299%), signaling complex leverage structure |
| Regulatory Risk | Moderate, typical for US/Canada restaurant operations | Moderate, with international franchise exposure adding complexity |
| Operational Risk | Diverse brand portfolio with 1,867 restaurants, complex operations | Large store network (~18,800 stores globally), operational complexity in franchise management |
| Environmental Risk | Moderate, industry-wide concerns on sustainability and waste | Moderate, similar sector risks including packaging and supply chain emissions |
| Geopolitical Risk | Low to moderate, primarily North America focused | Moderate, operations in 90 markets increase exposure to geopolitical shifts |
Synthesizing these risks, Domino’s Pizza faces higher market volatility and more significant geopolitical exposure due to its extensive international presence. Darden has a concerningly high debt-to-equity ratio, increasing financial risk despite a lower beta. Both companies must navigate moderate regulatory and environmental challenges inherent in the restaurant industry. Investors should weigh Domino’s operational complexity and international risks against Darden’s leverage and market stability when considering risk management.
Which Stock to Choose?
Darden Restaurants, Inc. (DRI) shows a favorable income statement with strong gross and EBIT margins, solid profitability, and a very favorable rating of B+. Despite some unfavorable liquidity and debt ratios, its ROE of 45.4% and growing ROIC above WACC indicate durable value creation.
Domino’s Pizza, Inc. (DPZ) presents a higher net margin and ROIC but suffers from negative ROE and elevated debt-to-assets ratio. The company’s rating is slightly lower at C+ with mixed financial ratios, reflecting value creation amid declining profitability and weaker balance sheet metrics.
Investors prioritizing durable competitive advantages and strong equity returns might find DRI’s profile more appealing, while those focused on high operating returns and margin growth could see DPZ as a potential fit, albeit with higher financial risk to consider.
Disclaimer: Investment carries a risk of loss of initial capital. The past performance is not a reliable indicator of future results. Be sure to understand risks before making an investment decision.
Go Further
I encourage you to read the complete analyses of Darden Restaurants, Inc. and Domino’s Pizza, Inc. to enhance your investment decisions: