Home > Comparison > Healthcare > DHR vs WAT
The strategic rivalry between Danaher Corporation and Waters Corporation shapes innovation in the healthcare diagnostics sector. Danaher operates as a diversified industrial powerhouse with broad life sciences and environmental solutions, while Waters focuses on specialized, high-precision analytical instruments. This head-to-head pits scale and diversification against niche expertise. This analysis aims to identify which corporate model offers a superior risk-adjusted return for a diversified portfolio.

Table of contents
Companies Overview
Danaher and Waters dominate the medical diagnostics and research equipment markets with cutting-edge technologies.
Danaher Corporation: Diversified Scientific Innovator
Danaher leads as a global healthcare conglomerate specializing in Life Sciences, Diagnostics, and Environmental Solutions. Its revenue stems from sophisticated instruments and consumables, such as mass spectrometers and clinical diagnostics products. In 2026, Danaher emphasizes expanding bioprocess technologies and integrated automation to deepen its competitive moat.
Waters Corporation: Precision Measurement Specialist
Waters commands a niche in analytical workflow solutions focused on chromatography and mass spectrometry systems. Revenue comes from selling high-performance instruments, consumables, and software for pharmaceutical and environmental testing. Its 2026 strategy centers on enhancing software integration and post-warranty services to boost customer retention and innovation.
Strategic Collision: Similarities & Divergences
Both companies thrive in medical diagnostics and laboratory instrumentation, but Danaher pursues a diversified, multi-segment approach while Waters focuses sharply on chromatography and mass spectrometry. Their primary battleground is advanced analytical technologies for life sciences. Danaher’s broad portfolio offers stability; Waters’ specialization provides focused growth potential, reflecting distinct investor risk profiles.
Income Statement Comparison
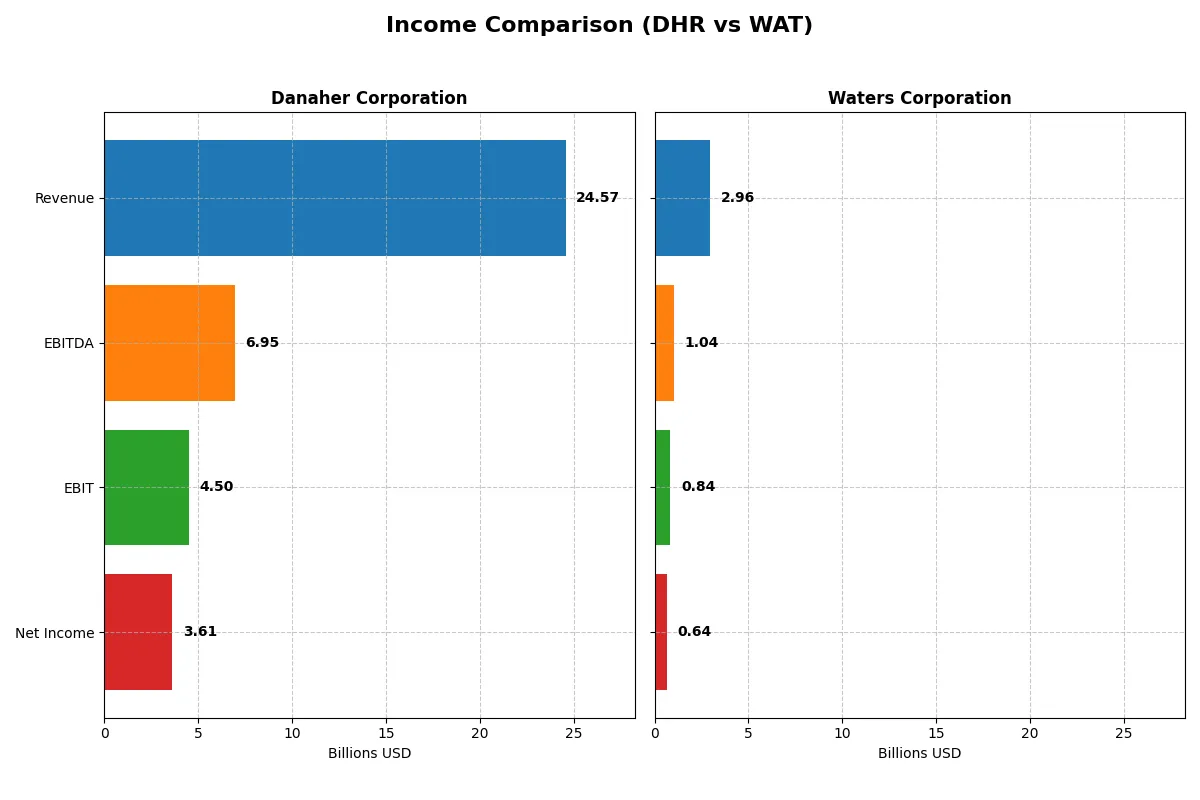
This data dissects the core profitability and scalability of both corporate engines to reveal who dominates the bottom line:
| Metric | Danaher Corporation (DHR) | Waters Corporation (WAT) |
|---|---|---|
| Revenue | 24.57B | 2.96B |
| Cost of Revenue | 9.60B | 1.20B |
| Operating Expenses | 9.83B | 0.93B |
| Gross Profit | 14.97B | 1.76B |
| EBITDA | 6.95B | 1.04B |
| EBIT | 4.50B | 0.84B |
| Interest Expense | 0.27B | 0.09B |
| Net Income | 3.61B | 0.64B |
| EPS | 5.07 | 10.75 |
| Fiscal Year | 2025 | 2024 |
Income Statement Analysis: The Bottom-Line Duel
This income statement comparison reveals which company runs a more efficient and profitable business engine over recent years.
Danaher Corporation Analysis
Danaher’s revenue trended downward from 29.5B in 2021 to 24.6B in 2025, with net income falling from 6.3B to 3.6B. Gross margin holds strong near 61%, but net margin slid to 14.7%. The latest year shows margin compression and declining profitability, signaling weakening operational momentum despite solid gross profit.
Waters Corporation Analysis
Waters posted steady revenue around 2.9B from 2020 to 2024, with net income growing from 522M to 638M. Gross margin stays robust at 59.4%, while net margin improves to 21.6%. Recent results reflect stable top-line and resilient margins, sustaining earnings growth and operational efficiency amid modest revenue gains.
Margin Power vs. Revenue Scale
Waters demonstrates superior margin health and steady net income growth, while Danaher faces declining revenue and shrinking net margins. Waters’ consistent profitability and margin expansion present a fundamentally stronger profile. Investors seeking operational efficiency may favor Waters’ stable earnings over Danaher’s scale but faltering profitability.
Financial Ratios Comparison
These vital ratios act as a diagnostic tool to expose the underlying fiscal health, valuation premiums, and capital efficiency of each company:
| Ratios | Danaher Corporation (DHR) | Waters Corporation (WAT) |
|---|---|---|
| ROE | 6.9% | 34.9% |
| ROIC | 5.7% | 18.4% |
| P/E | 44.8 | 34.5 |
| P/B | 3.1 | 12.0 |
| Current Ratio | 1.87 | 2.11 |
| Quick Ratio | 1.51 | 1.51 |
| D/E | 0.35 | 0.93 |
| Debt-to-Assets | 22.1% | 37.4% |
| Interest Coverage | 19.4 | 9.2 |
| Asset Turnover | 0.29 | 0.65 |
| Fixed Asset Turnover | 4.44 | 4.08 |
| Payout ratio | 24.3% | 0% |
| Dividend yield | 0.54% | 0% |
| Fiscal Year | 2025 | 2024 |
Efficiency & Valuation Duel: The Vital Signs
Ratios act as a company’s DNA, revealing hidden risks and operational excellence behind headline numbers.
Danaher Corporation
Danaher posts a modest 6.9% ROE, underperforming industry norms, despite a healthy 14.7% net margin. Its high P/E of 44.8 signals an expensive valuation, while a P/B of 3.08 confirms stretched multiples. The 0.54% dividend yield suggests modest shareholder returns, focusing more on reinvestment through R&D to sustain growth.
Waters Corporation
Waters delivers a strong 34.9% ROE and a robust 21.6% net margin, showcasing operational efficiency. Its P/E of 34.5 remains high, with a notably rich P/B of 12.04, indicating premium pricing. Waters pays no dividend, opting to reinvest aggressively in R&D and capex to fuel expansion and innovation.
Premium Valuation vs. Operational Safety
Danaher trades at a higher valuation with subdued ROE but maintains stability through dividends and solid capital structure. Waters offers superior profitability but at a premium price and no dividend cushion. Investors seeking steady income might prefer Danaher, while growth-focused profiles align better with Waters.
Which one offers the Superior Shareholder Reward?
I see Danaher (DHR) delivers a modest 0.54% dividend yield with a conservative 24% payout ratio, comfortably covered by robust free cash flow (7.4/share). Its steady buyback program boosts total returns sustainably. Waters (WAT) pays no dividend but reinvests heavily in growth, reflected in a higher free cash flow per share (10.4) and aggressive buybacks. However, WAT’s elevated leverage (debt/equity ~0.93) raises risk. I conclude Danaher offers a superior, more balanced shareholder reward in 2026, blending income with prudent capital returns. Waters’ reinvestment strategy appeals to growth-focused investors but carries more risk and less immediate yield.
Comparative Score Analysis: The Strategic Profile
The radar chart reveals the fundamental DNA and trade-offs of Danaher Corporation and Waters Corporation, highlighting their core financial strengths and weaknesses:
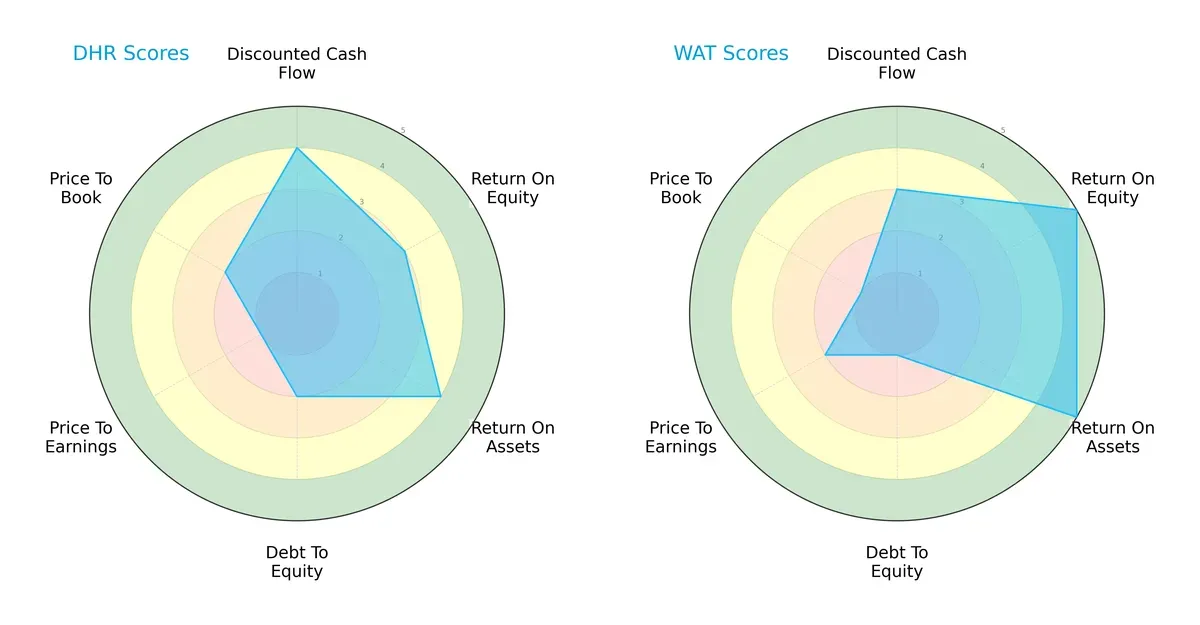
Danaher shows strength in discounted cash flow (4) and return on assets (4), indicating efficient asset use and solid valuation based on future cash flow. Waters excels in return on equity (5) and return on assets (5), reflecting superior profitability and asset efficiency. However, Waters carries higher financial risk with a weaker debt-to-equity score (1) versus Danaher’s moderate (2). Danaher’s valuation metrics lag, particularly in P/E (1), suggesting potential undervaluation but also caution. Overall, Danaher offers a more balanced profile, while Waters relies heavily on operational efficiency but with increased leverage risk.
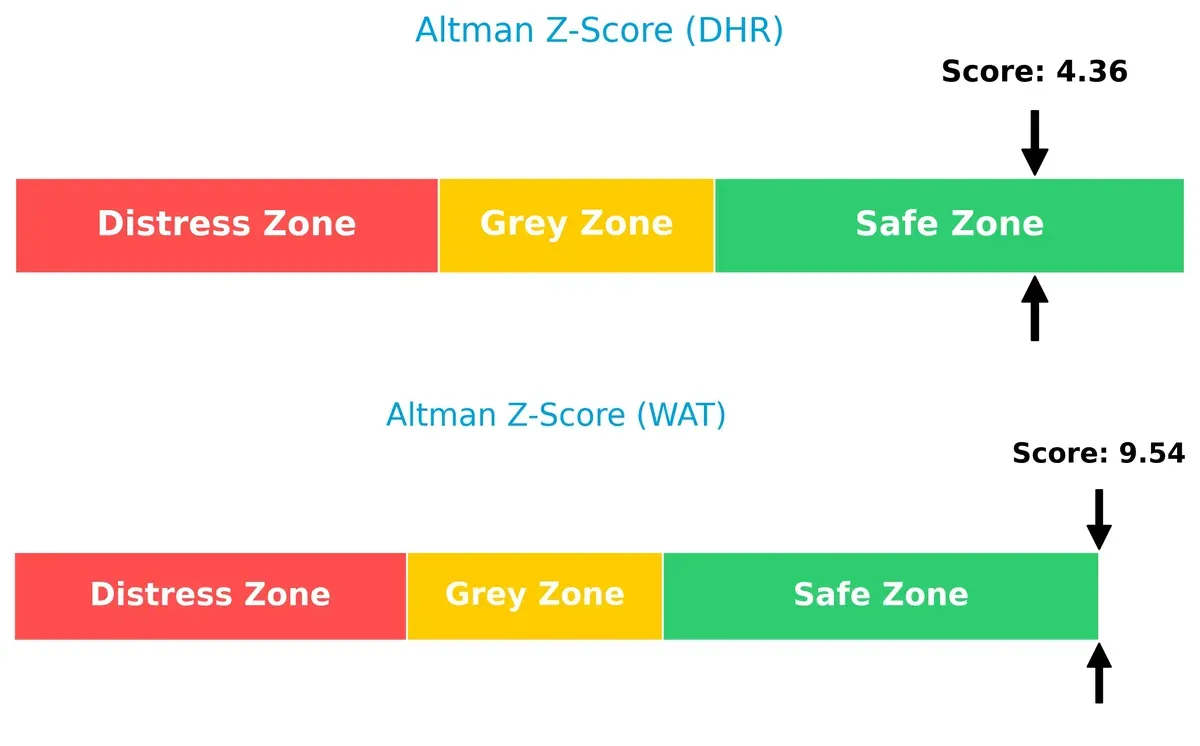
Bankruptcy Risk: Solvency Showdown
The Altman Z-Score gap between Danaher (4.36) and Waters (9.54) confirms both firms are in the safe zone, with Waters exhibiting significantly stronger solvency, enhancing its long-term survival prospects in this cycle:
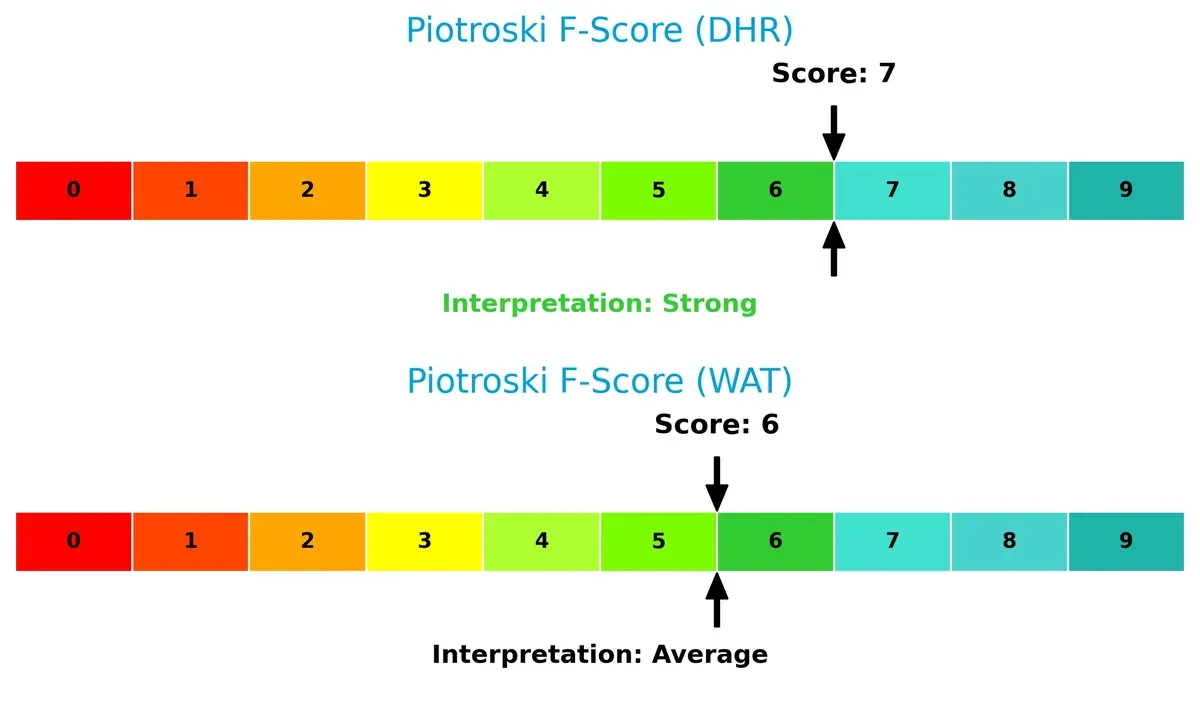
Financial Health: Quality of Operations
Danaher’s Piotroski F-Score of 7 versus Waters’ 6 indicates stronger internal financial health and operational quality. Danaher shows fewer red flags in profitability, leverage, and efficiency metrics, suggesting a more robust financial foundation:
How are the two companies positioned?
This section dissects Danaher and Waters’ operational DNA by comparing revenue distribution and internal dynamics. The goal is to confront their economic moats and identify which model offers a more resilient, sustainable advantage today.
Revenue Segmentation: The Strategic Mix
This comparison dissects how Danaher Corporation and Waters Corporation diversify their income streams and where their primary sector bets lie:
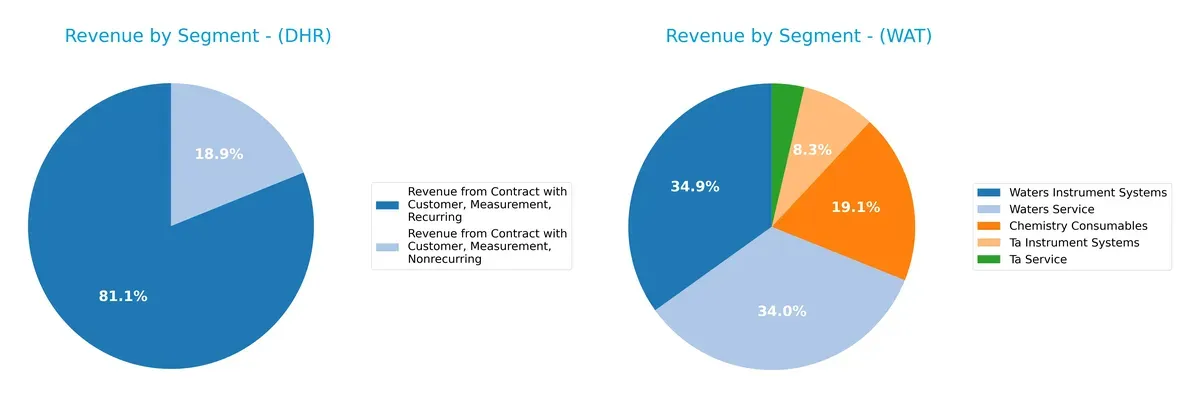
Danaher anchors revenue heavily in Measurement Recurring with $19.4B in 2024, dwarfing its Nonrecurring segment at $4.5B. This concentration signals strong ecosystem lock-in. In contrast, Waters spreads revenue across Waters Instrument Systems ($1.03B), Waters Service ($1.01B), Chemistry Consumables ($565M), and TA segments, showing a more diversified mix. Waters’ segmentation reduces concentration risk, while Danaher’s dominance in recurring measurement revenues emphasizes infrastructure dominance and recurring cash flows.
Strengths and Weaknesses Comparison
This table compares the Strengths and Weaknesses of Danaher Corporation and Waters Corporation:
Danaher Corporation Strengths
- Strong recurring revenue base of $19.4B in 2024
- Favorable net margin at 14.7%
- Solid liquidity with current ratio 1.87
- Low debt-to-assets at 22%
- Global presence with $11.1B in other developed markets revenue
Waters Corporation Strengths
- Higher net margin at 21.6%
- Strong ROE at 34.9% and ROIC at 18.4%
- Favorable current and quick ratios at 2.11 and 1.51
- Balanced revenue across Americas, Asia Pacific, Europe
- Strong fixed asset turnover of 4.08
Danaher Corporation Weaknesses
- Unfavorable ROE at 6.9% below WACC
- High P/E 44.8 and P/B 3.08 ratios
- Unfavorable asset turnover at 0.29
- Low dividend yield at 0.54%
- Heavy reliance on North America and China markets
Waters Corporation Weaknesses
- Elevated P/B ratio at 12.04 and P/E 34.5
- No dividend yield reported
- Higher debt-to-assets ratio at 37% (neutral)
- Asset turnover only neutral at 0.65
Overall, Danaher shows strength in steady recurring revenues and financial stability but faces challenges in profitability efficiency. Waters boasts superior profitability metrics and geographic diversification but carries valuation and leverage concerns. Each company’s profile suggests different strategic priorities in capital allocation and market focus.
The Moat Duel: Analyzing Competitive Defensibility
A structural moat is the sole barrier protecting long-term profits from relentless competition erosion. Let’s dissect how these two firms defend their turf:
Danaher Corporation: Intangible Asset Powerhouse
Danaher leverages specialized intellectual property and advanced diagnostics technology, reflecting in its historically stable margins. Yet, declining ROIC signals weakening moat durability in 2026.
Waters Corporation: Cost Advantage with Precision Engineering
Waters thrives on manufacturing efficiency and premium chromatography systems, delivering superior EBIT margins. Its positive ROIC spread over WACC underpins ongoing value creation despite a recent profitability dip.
Capital Efficiency vs. Technological Edge: The Moat Battle
Waters boasts the wider moat with excess returns above cost of capital, while Danaher’s shrinking ROIC warns of erosion. Waters appears better positioned to sustain and defend market share in 2026.
Which stock offers better returns?
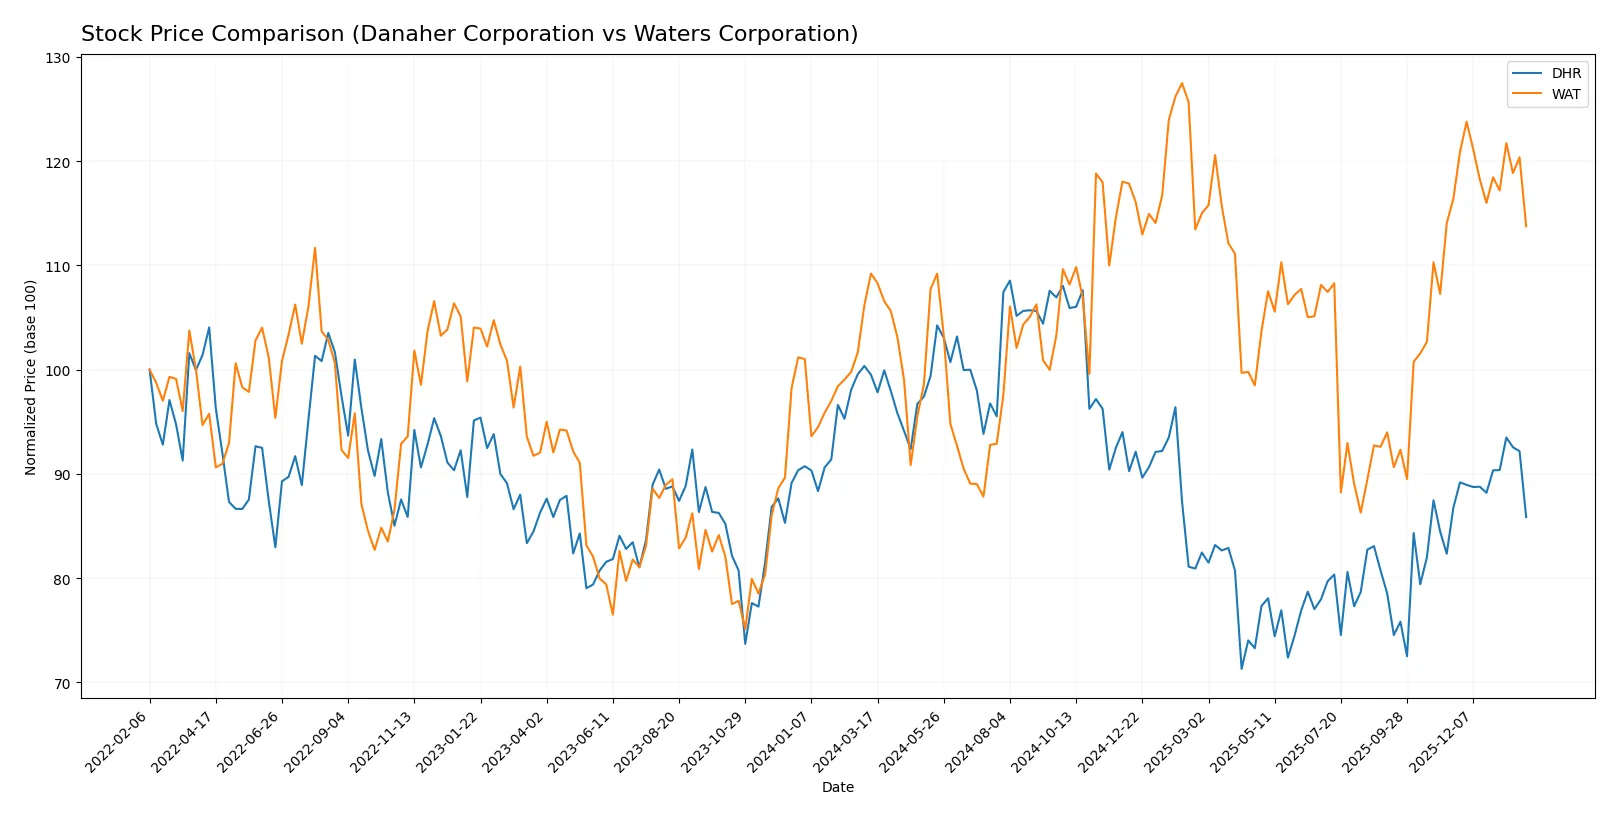
Over the past 12 months, Danaher Corporation’s shares declined sharply, while Waters Corporation’s stock showed moderate gains amid decelerating momentum.
Trend Comparison
Danaher’s stock fell 13.72% over the last year, marking a bearish trend with accelerating decline. The price ranged between 182 and 277, showing significant volatility.
Waters gained 4.15%, indicating a bullish trend despite decelerating growth. The stock fluctuated from 281 to 415, reflecting higher volatility than Danaher.
Waters outperformed Danaher over the year, delivering positive returns while Danaher saw a substantial drop in market value.
Target Prices
Analysts set a clear upside for Danaher Corporation and Waters Corporation in the current healthcare diagnostics sector.
| Company | Target Low | Target High | Consensus |
|---|---|---|---|
| Danaher Corporation | 220 | 270 | 252.33 |
| Waters Corporation | 315 | 480 | 406.86 |
Danaher’s consensus target of 252.33 suggests about a 15% upside from its current 218.89 price. Waters shows a stronger potential gain, with a 406.86 target versus a 370.72 price.

Don’t Let Luck Decide Your Entry Point
Optimize your entry points with our advanced ProRealTime indicators. You’ll get efficient buy signals with precise price targets for maximum performance. Start outperforming now!
How do institutions grade them?
Danaher Corporation Grades
The following table summarizes recent institutional grades for Danaher Corporation:
| Grading Company | Action | New Grade | Date |
|---|---|---|---|
| JP Morgan | maintain | Overweight | 2026-01-29 |
| Jefferies | maintain | Buy | 2026-01-29 |
| TD Cowen | maintain | Buy | 2026-01-07 |
| Guggenheim | maintain | Buy | 2026-01-05 |
| Wells Fargo | maintain | Equal Weight | 2025-12-15 |
| Wells Fargo | maintain | Equal Weight | 2025-10-23 |
| Barclays | maintain | Overweight | 2025-10-22 |
| TD Cowen | maintain | Buy | 2025-10-22 |
| Rothschild & Co | downgrade | Neutral | 2025-10-08 |
| Evercore ISI Group | maintain | Outperform | 2025-10-07 |
Waters Corporation Grades
The following table summarizes recent institutional grades for Waters Corporation:
| Grading Company | Action | New Grade | Date |
|---|---|---|---|
| Wells Fargo | maintain | Equal Weight | 2025-12-15 |
| Wolfe Research | upgrade | Outperform | 2025-12-10 |
| TD Cowen | maintain | Hold | 2025-11-05 |
| Wells Fargo | maintain | Equal Weight | 2025-11-05 |
| JP Morgan | maintain | Neutral | 2025-10-09 |
| Deutsche Bank | maintain | Hold | 2025-08-05 |
| Wells Fargo | maintain | Equal Weight | 2025-08-05 |
| Jefferies | maintain | Buy | 2025-08-04 |
| Baird | maintain | Outperform | 2025-07-16 |
| Wells Fargo | downgrade | Equal Weight | 2025-07-15 |
Which company has the best grades?
Danaher consistently receives stronger grades, with multiple “Buy,” “Overweight,” and “Outperform” ratings. Waters holds more “Equal Weight,” “Hold,” and fewer upgrades. This suggests Danaher currently commands higher institutional confidence, which may influence investor sentiment and portfolio positioning.
Risks specific to each company
The following categories identify the critical pressure points and systemic threats facing both firms in the 2026 market environment:
1. Market & Competition
Danaher Corporation
- Operates in a broad diagnostics and life sciences market with diversified segments, facing intense innovation pressure.
Waters Corporation
- Focuses on specialty measurement technologies with strong niche competition but narrower product range.
2. Capital Structure & Debt
Danaher Corporation
- Maintains a conservative debt-to-equity ratio of 0.35, reflecting prudent leverage and strong interest coverage.
Waters Corporation
- Carries higher leverage with debt-to-equity near 0.93, posing moderate financial risk amid rising rates.
3. Stock Volatility
Danaher Corporation
- Beta of 0.93 indicates below-market volatility, favoring risk-averse investors.
Waters Corporation
- Beta of 1.16 suggests higher volatility, increasing risk for cautious portfolios.
4. Regulatory & Legal
Danaher Corporation
- Subject to stringent healthcare and environmental regulations but benefits from diversified compliance experience.
Waters Corporation
- Faces regulatory scrutiny in analytical instrument markets, with potential risks from evolving drug testing standards.
5. Supply Chain & Operations
Danaher Corporation
- Complex global operations with robust supply chains but exposed to raw material price fluctuations.
Waters Corporation
- Smaller scale supply chain with specialized components, vulnerable to supplier disruptions.
6. ESG & Climate Transition
Danaher Corporation
- Invests in environmental solutions and sustainability, aligning with climate transition trends.
Waters Corporation
- Limited ESG disclosures pose transparency risks; potential lag in climate-related innovation.
7. Geopolitical Exposure
Danaher Corporation
- Global footprint exposes it to trade tensions and geopolitical instability, requiring active risk management.
Waters Corporation
- Primarily US and Europe-focused, somewhat insulated but still vulnerable to regulatory shifts.
Which company shows a better risk-adjusted profile?
Danaher’s lower leverage and broad diversification offer a more stable risk profile. Waters delivers higher returns but carries greater financial and market volatility risks. Danaher’s strong interest coverage and safer beta justify its more prudent standing. Waters’ higher debt and narrower focus elevate its risk despite superior profitability metrics.
Final Verdict: Which stock to choose?
Danaher Corporation’s superpower lies in its resilient operational efficiency and strong balance sheet metrics. However, its declining return on invested capital signals a point of vigilance. Danaher fits portfolios targeting steady cash flow with moderate risk tolerance, leaning toward disciplined value-oriented growth.
Waters Corporation commands a strategic moat through its superior return on equity and invested capital, reflecting effective capital allocation. Its higher profitability offers a safety cushion compared to Danaher’s value erosion. Waters suits investors seeking growth at a reasonable price with a tilt toward quality and capital efficiency.
If you prioritize operational stability and conservative value preservation, Danaher is the compelling choice due to its solid liquidity and manageable leverage. However, if you seek superior capital returns and a stronger profitability moat, Waters offers better stability despite a premium valuation. Both present distinct scenarios aligned with differing risk and growth preferences.
Disclaimer: Investment carries a risk of loss of initial capital. The past performance is not a reliable indicator of future results. Be sure to understand risks before making an investment decision.
Go Further
I encourage you to read the complete analyses of Danaher Corporation and Waters Corporation to enhance your investment decisions: