Home > Comparison > Healthcare > TMO vs DHR
The strategic rivalry between Thermo Fisher Scientific Inc. and Danaher Corporation defines the current trajectory of the healthcare diagnostics and research sector. Thermo Fisher operates as a diversified life sciences solutions powerhouse, while Danaher focuses on specialized instruments and diagnostics across life sciences and environmental applications. This head-to-head pits broad-based scale against segment specialization. This analysis will determine which corporate trajectory offers superior risk-adjusted returns for a diversified portfolio.

Table of contents
Companies Overview
Thermo Fisher Scientific Inc. and Danaher Corporation both lead in the medical diagnostics and research sector, shaping healthcare innovation globally.
Thermo Fisher Scientific Inc.: Life Sciences Powerhouse
Thermo Fisher dominates as a provider of life sciences solutions and analytical instruments. Its revenue stems from reagents, instruments, and biopharma services supporting drug discovery and clinical diagnostics. In 2026, it focuses strategically on expanding its biopharma services and specialty diagnostics, leveraging a broad product portfolio across global markets.
Danaher Corporation: Diversified Scientific Innovator
Danaher excels in designing and marketing professional and medical products. Its core revenue derives from life sciences tools, diagnostics, and environmental solutions. The company’s 2026 strategy prioritizes advancing lab automation and diagnostics technologies, targeting pharmaceutical, clinical, and industrial markets through innovation and integrated solutions.
Strategic Collision: Similarities & Divergences
Both companies emphasize life sciences and diagnostics, but Thermo Fisher champions a broad biopharma and lab product mix while Danaher pursues a diversified portfolio including environmental tech. Their primary battleground is advanced diagnostics and automation. Thermo Fisher’s extensive scale contrasts with Danaher’s focused innovation, defining distinct investment profiles grounded in scale versus specialization.
Income Statement Comparison
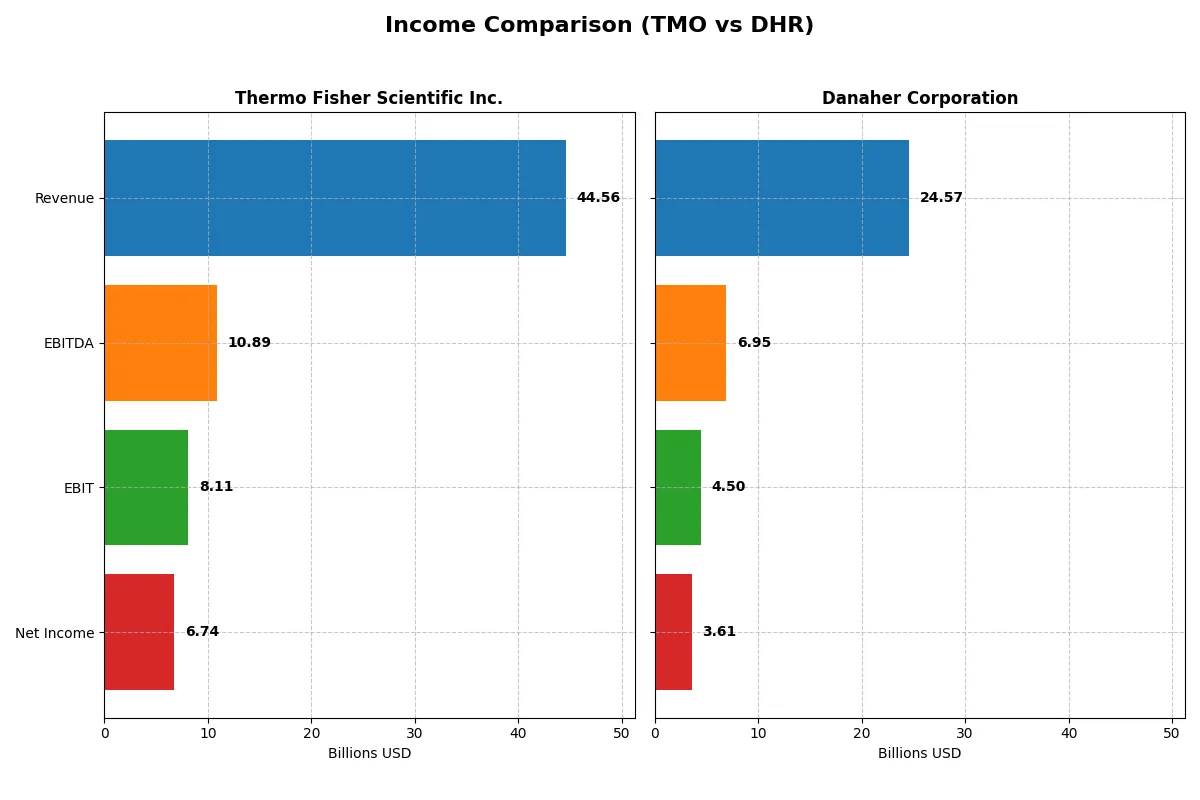
This data dissects the core profitability and scalability of both corporate engines to reveal who dominates the bottom line:
| Metric | Thermo Fisher Scientific Inc. (TMO) | Danaher Corporation (DHR) |
|---|---|---|
| Revenue | 44.6B | 24.6B |
| Cost of Revenue | 27.8B | 9.6B |
| Operating Expenses | 8.7B | 9.8B |
| Gross Profit | 16.8B | 15.0B |
| EBITDA | 10.9B | 6.9B |
| EBIT | 8.1B | 4.5B |
| Interest Expense | 1.4B | 265M |
| Net Income | 6.7B | 3.6B |
| EPS | 17.77 | 5.07 |
| Fiscal Year | 2025 | 2025 |
Income Statement Analysis: The Bottom-Line Duel
This income statement comparison reveals which company runs a more efficient and profitable business engine in the current market context.
Thermo Fisher Scientific Inc. Analysis
Thermo Fisher’s revenue grew steadily to $44.6B in 2025, but net income declined to $6.7B, reflecting margin pressure. Gross margin eased to 37.7%, while net margin remained a healthy 15.1%. Despite a slight dip in EBIT, the company maintained strong operational discipline and improved EPS by 7.3%, signaling resilience.
Danaher Corporation Analysis
Danaher’s revenue slid to $24.6B in 2025 amid a longer-term decline, with net income halving to $3.6B since 2021. Its gross margin impressively stood at 60.9%, but net margin contracted to 14.7%. EBIT dropped nearly 9% last year, and EPS declined by 4.7%, pointing to weakening momentum and operational challenges.
Margin Strength vs. Revenue Scale
Thermo Fisher outperforms Danaher in revenue growth and net income stability, despite Danaher’s superior gross margin. Thermo’s balance of scale and margin efficiency creates a stronger bottom line. For investors, Thermo Fisher’s profile offers more robust earnings growth and operational resilience in a shifting environment.
Financial Ratios Comparison
These vital ratios act as a diagnostic tool to expose the underlying fiscal health, valuation premiums, and capital efficiency of the companies compared below:
| Ratios | Thermo Fisher Scientific Inc. (TMO) | Danaher Corporation (DHR) |
|---|---|---|
| ROE | 12.6% | 6.9% |
| ROIC | 7.6% | 5.7% |
| P/E | 32.3 | 44.8 |
| P/B | 4.08 | 3.08 |
| Current Ratio | 1.89 | 1.87 |
| Quick Ratio | 1.53 | 1.51 |
| D/E | 0.74 | 0.35 |
| Debt-to-Assets | 35.7% | 22.1% |
| Interest Coverage | 5.71 | 19.4 |
| Asset Turnover | 0.40 | 0.29 |
| Fixed Asset Turnover | 4.22 | 4.44 |
| Payout Ratio | 9.4% | 24.3% |
| Dividend Yield | 0.29% | 0.54% |
| Fiscal Year | 2025 | 2025 |
Efficiency & Valuation Duel: The Vital Signs
Financial ratios act as the company’s DNA, revealing hidden risks and operational excellence critical for investors’ decision-making.
Thermo Fisher Scientific Inc.
Thermo Fisher shows solid profitability with a 12.6% ROE and a favorable 15.1% net margin, signaling efficient operations. Its P/E ratio at 32.3 appears stretched, reflecting premium valuation. Shareholder returns are modest, with a low 0.29% dividend yield, focusing more on reinvestment in R&D to sustain growth.
Danaher Corporation
Danaher posts a weaker 6.9% ROE but maintains a strong 14.7% net margin, suggesting operational discipline despite lower equity profit. Its P/E of 44.8 signals an expensive stock, yet a more conservative debt ratio and higher interest coverage provide financial stability. Dividend yield stands at 0.54%, slightly higher but still modest.
Premium Valuation vs. Operational Safety
Danaher’s higher valuation demands more growth to justify its price, but it offers better balance sheet strength and cash flow coverage. Thermo Fisher delivers higher profitability and reinvests heavily in innovation, though at a slightly stretched valuation. Growth-oriented investors may prefer Thermo Fisher’s profile, while risk-averse investors might lean toward Danaher’s financial prudence.
Which one offers the Superior Shareholder Reward?
I see Thermo Fisher Scientific (TMO) pays a modest 0.29% dividend yield with a low 9.4% payout ratio, indicating ample free cash flow (FCF) coverage and capacity to grow dividends. Its buyback program is less aggressive compared to Danaher (DHR), which yields 0.54% but pays out nearly 24% of earnings as dividends, a heavier distribution load. Danaher’s buybacks are steady but less substantial than TMO’s cash flow strength suggests. I appreciate TMO’s conservative distribution and reinvestment balance, enhancing long-term sustainability. Danaher’s higher payout ratio and elevated P/E of 44.8x versus TMO’s 32.3x raise valuation risk. In 2026, Thermo Fisher offers a superior total return profile, blending modest dividends, smart buybacks, and stronger free cash flow reinvestment for durable value creation.
Comparative Score Analysis: The Strategic Profile
The radar chart reveals the fundamental DNA and trade-offs of Thermo Fisher Scientific and Danaher Corporation, highlighting their financial strengths and vulnerabilities:
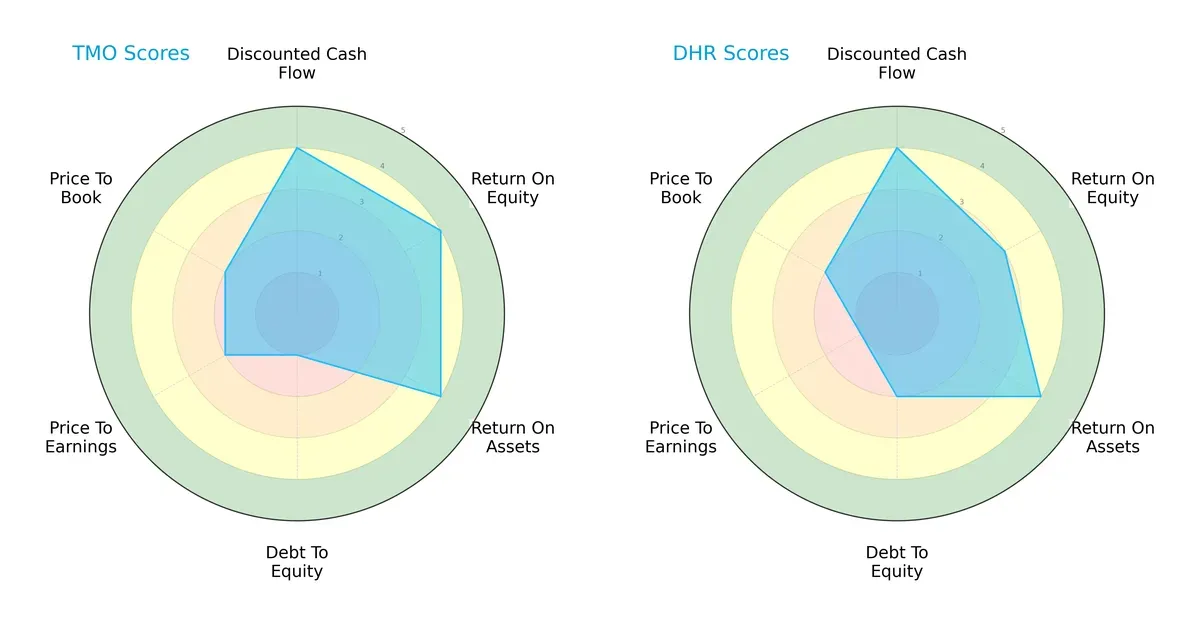
Thermo Fisher excels in return on equity (4) and assets (4), paired with strong discounted cash flow (4), but suffers a very unfavorable debt-to-equity score (1). Danaher shows a more balanced debt profile (2) but lags in ROE (3) and suffers from a very unfavorable P/E score (1). Thermo Fisher relies heavily on profitability despite leverage risks, while Danaher maintains steadier financial risk at the cost of some profitability metrics.
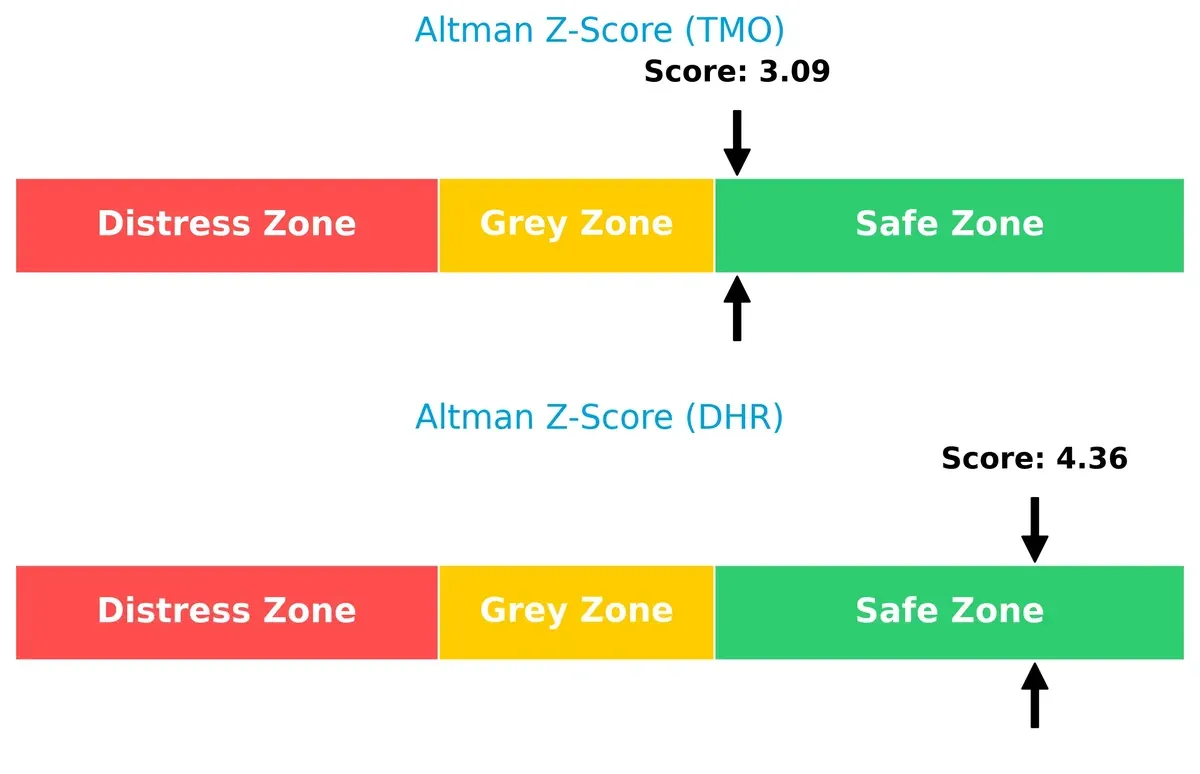
Bankruptcy Risk: Solvency Showdown
The Altman Z-Score gap favors Danaher (4.36) over Thermo Fisher (3.09), both safely above the distress threshold, signaling strong long-term survival prospects in this cycle:
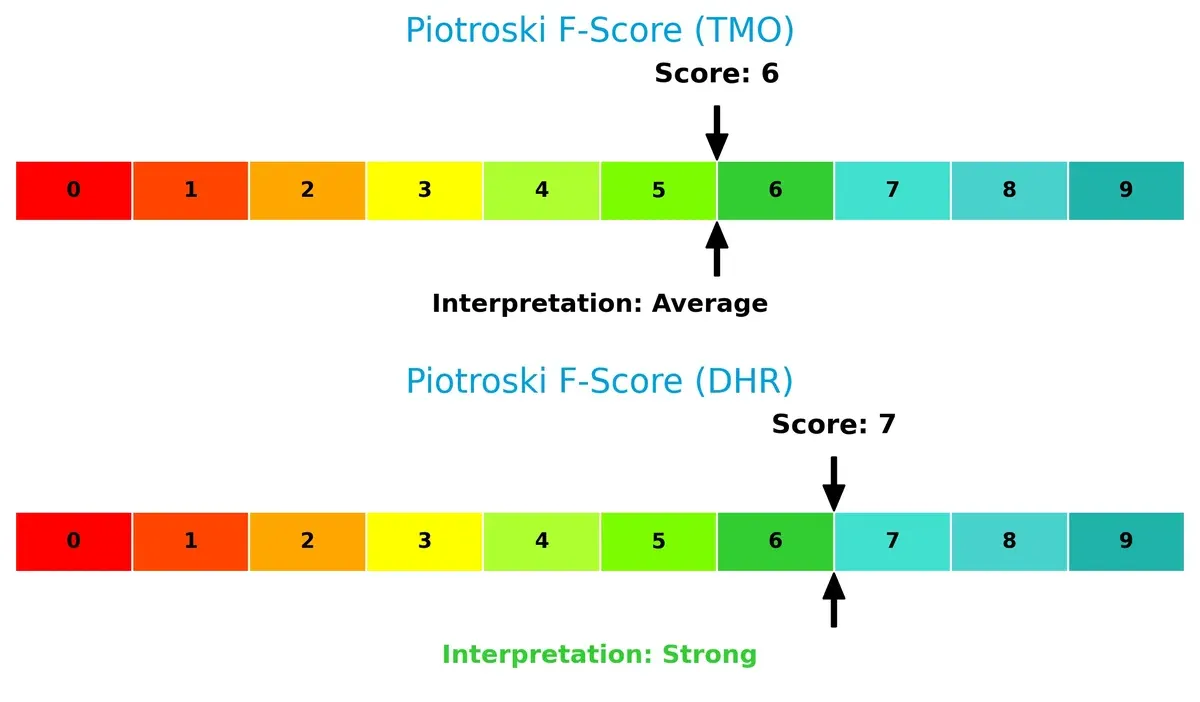
Financial Health: Quality of Operations
Danaher’s Piotroski score of 7 surpasses Thermo Fisher’s 6, indicating stronger operational quality and fewer internal red flags amid current market pressures:
How are the two companies positioned?
This section dissects the operational DNA of TMO and DHR by comparing their revenue distribution and internal dynamics, including strengths and weaknesses. The goal is to confront their economic moats to identify which model offers the most resilient competitive advantage today.
Revenue Segmentation: The Strategic Mix
This visual comparison dissects how Thermo Fisher Scientific Inc. and Danaher Corporation diversify income streams and reveals their primary sector bets:
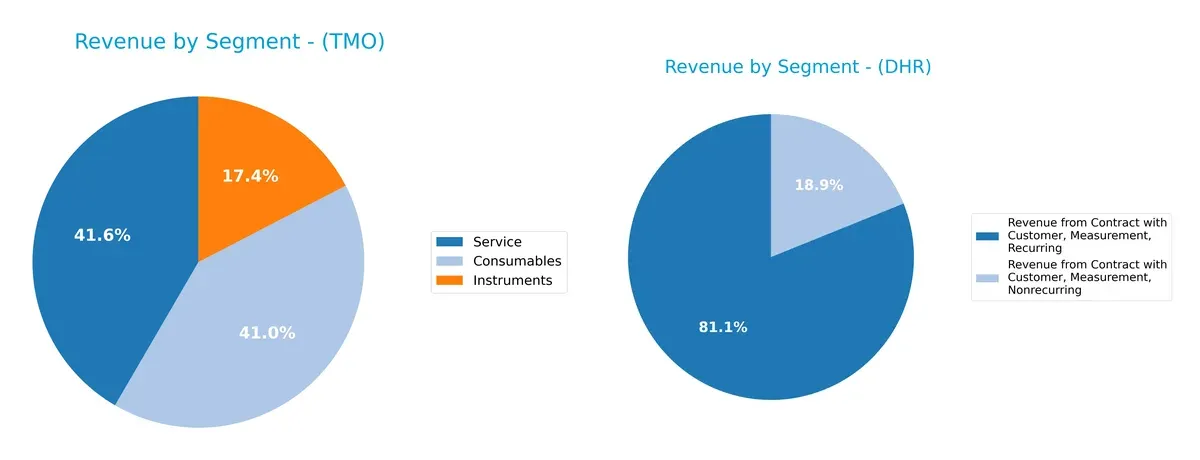
Thermo Fisher anchors revenue around three broad segments: Consumables at $17.6B, Services at $17.8B, and Instruments at $7.4B, showing a balanced but slightly service-tilted mix. Danaher pivots heavily on recurring measurement contracts at $19.4B, dwarfing nonrecurring at $4.5B, signaling strong ecosystem lock-in. Thermo Fisher’s spread reduces concentration risk, while Danaher’s focus emphasizes infrastructure dominance in contract measurement services.
Strengths and Weaknesses Comparison
This table compares the strengths and weaknesses of Thermo Fisher Scientific Inc. and Danaher Corporation based on diversification, profitability, financial health, innovation, global presence, and market share:
Thermo Fisher Scientific Inc. Strengths
- Diversified revenue streams across consumables, instruments, and services
- Favorable net margin at 15.12%
- Strong liquidity with current ratio 1.89 and quick ratio 1.53
- Fixed asset turnover favorable at 4.22
- Broad global presence with significant revenue in US, Europe, and Asia Pacific
Danaher Corporation Strengths
- Favorable net margin at 14.71%
- Strong solvency with low debt-to-assets 22.07% and high interest coverage 16.97
- Fixed asset turnover favorable at 4.44
- Diversified recurring revenues dominate total sales
- Global footprint includes North America, China, and other developed markets
Thermo Fisher Scientific Inc. Weaknesses
- Unfavorable high P/E at 32.34 and P/B at 4.08 indicating potentially expensive valuation
- ROE and ROIC neutral, close to WACC, suggesting limited capital efficiency
- Asset turnover low at 0.40, reflecting lower asset utilization
- Dividend yield low at 0.29%
- Moderate leverage with debt-to-equity 0.74
Danaher Corporation Weaknesses
- Unfavorable high P/E at 44.8 and P/B at 3.08, showing rich valuation
- Weak ROE at 6.88% below cost of capital
- Asset turnover lower at 0.29, indicating less efficient asset use
- Dividend yield also low at 0.54%
Both companies demonstrate solid profitability and global diversification, but face challenges in asset efficiency and high valuation multiples. Their strategies likely focus on balancing innovation and market expansion while managing capital allocation prudently.
The Moat Duel: Analyzing Competitive Defensibility
A structural moat is the only defense against long-term profit erosion by competition. Let’s examine how Thermo Fisher and Danaher protect their turf:
Thermo Fisher Scientific Inc.: Intangible Assets and Innovation Powerhouse
Thermo Fisher’s moat stems from deep intangible assets, including proprietary lab technologies and brand strength. Its solid 18.2% EBIT margin signals efficient capital use. However, a declining ROIC trend warns of margin pressure in 2026 amid rising competition and innovation demands.
Danaher Corporation: Operational Excellence and Cost Advantage
Danaher relies on lean operations and cost advantages, driving a strong 60.9% gross margin. Despite this, its steep ROIC decline and negative value creation suggest weakening competitive positioning. The firm must innovate aggressively to regain growth momentum and fend off disruptive entrants.
Intangible Assets vs. Cost Leadership: Who Holds the Deeper Moat?
Both companies face declining ROICs, signaling eroding moats. Thermo Fisher’s intangible asset base provides a wider competitive buffer, while Danaher’s cost advantage currently lacks sustainable value creation. Thermo Fisher is better positioned to defend market share through innovation and brand leverage.
Which stock offers better returns?
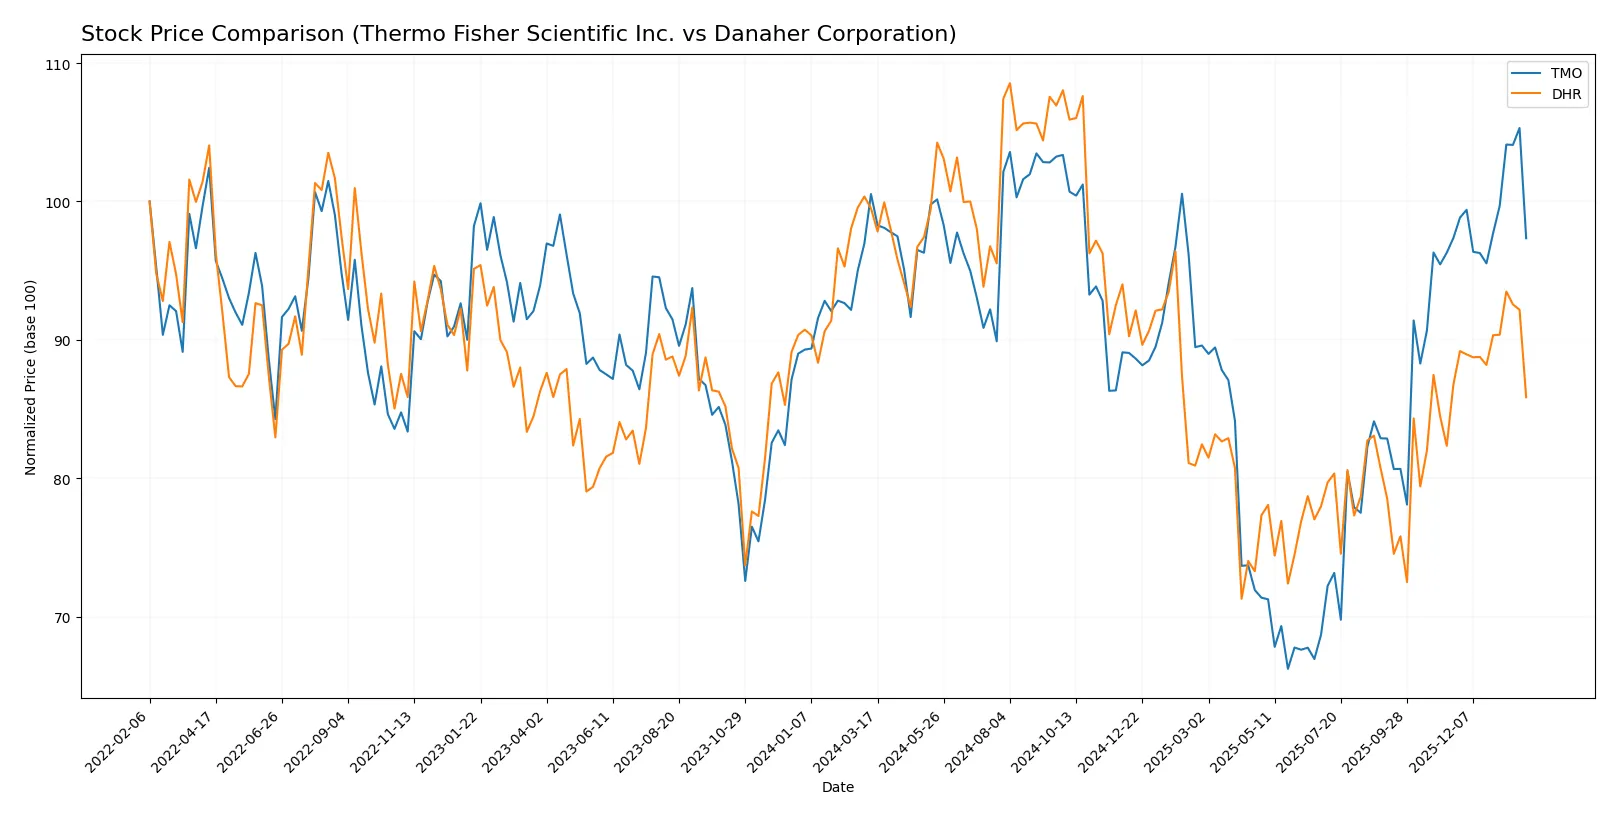
The past year shows distinct bearish trends for both Thermo Fisher Scientific and Danaher Corporation, with accelerated declines and notable price swings shaping their trading dynamics.
Trend Comparison
Thermo Fisher Scientific’s stock declined 3.18% over the last 12 months, marking a bearish trend with accelerating losses. The price ranged between 393.66 and 625.98, showing significant volatility (std dev 64.8).
Danaher’s stock fell 13.72% over the same period, also bearish with accelerating decline. The price fluctuated from 181.77 to 276.75 with moderate volatility (std dev 26.61), indicating steadier but sharper losses.
Comparing both, Thermo Fisher’s stock outperformed Danaher’s, delivering a smaller percentage loss and higher price resilience throughout the year.
Target Prices
Analysts present a bullish consensus for both Thermo Fisher Scientific Inc. and Danaher Corporation.
| Company | Target Low | Target High | Consensus |
|---|---|---|---|
| Thermo Fisher Scientific Inc. | 561 | 750 | 643.69 |
| Danaher Corporation | 220 | 270 | 252.33 |
The target consensus for Thermo Fisher suggests upside from the current 579 price, while Danaher’s consensus also implies a moderate increase above today’s 219 level.

Don’t Let Luck Decide Your Entry Point
Optimize your entry points with our advanced ProRealTime indicators. You’ll get efficient buy signals with precise price targets for maximum performance. Start outperforming now!
How do institutions grade them?
Thermo Fisher Scientific Inc. Grades
The table below summarizes recent institutional grades for Thermo Fisher Scientific Inc.:
| Grading Company | Action | New Grade | Date |
|---|---|---|---|
| TD Cowen | Maintain | Buy | 2026-01-30 |
| Barclays | Maintain | Overweight | 2026-01-30 |
| Citigroup | Maintain | Buy | 2026-01-30 |
| Stifel | Maintain | Buy | 2026-01-09 |
| TD Cowen | Maintain | Buy | 2026-01-07 |
| Wells Fargo | Maintain | Overweight | 2025-12-15 |
| Citigroup | Upgrade | Buy | 2025-12-11 |
| Keybanc | Upgrade | Overweight | 2025-12-08 |
| Morgan Stanley | Maintain | Overweight | 2025-12-02 |
| HSBC | Upgrade | Buy | 2025-12-01 |
Danaher Corporation Grades
The table below summarizes recent institutional grades for Danaher Corporation:
| Grading Company | Action | New Grade | Date |
|---|---|---|---|
| JP Morgan | Maintain | Overweight | 2026-01-29 |
| Jefferies | Maintain | Buy | 2026-01-29 |
| TD Cowen | Maintain | Buy | 2026-01-07 |
| Guggenheim | Maintain | Buy | 2026-01-05 |
| Wells Fargo | Maintain | Equal Weight | 2025-12-15 |
| Wells Fargo | Maintain | Equal Weight | 2025-10-23 |
| Barclays | Maintain | Overweight | 2025-10-22 |
| TD Cowen | Maintain | Buy | 2025-10-22 |
| Rothschild & Co | Downgrade | Neutral | 2025-10-08 |
| Evercore ISI Group | Maintain | Outperform | 2025-10-07 |
Which company has the best grades?
Thermo Fisher Scientific consistently receives Buy and Overweight grades, with several recent upgrades. Danaher’s grades include Buy and Overweight, but also Neutral and Equal Weight ratings. Thermo Fisher’s stronger and more frequent upgrades suggest higher analyst conviction, which may influence investors seeking more confident institutional support.
Risks specific to each company
The following categories identify the critical pressure points and systemic threats facing both firms in the 2026 market environment:
1. Market & Competition
Thermo Fisher Scientific Inc.
- Faces intense competition in life sciences and diagnostics sectors; premium pricing pressures affect margins.
Danaher Corporation
- Competes across multiple segments including environmental solutions; diverse product portfolio mitigates some competitive risks.
2. Capital Structure & Debt
Thermo Fisher Scientific Inc.
- Debt-to-equity ratio at 0.74 signals moderate leverage; interest coverage favorable but warrants monitoring.
Danaher Corporation
- Lower leverage with debt-to-equity at 0.35; strong interest coverage reduces refinancing risk significantly.
3. Stock Volatility
Thermo Fisher Scientific Inc.
- Beta at 0.91 indicates slightly less volatility than the market; stable trading range but recent price drop signals caution.
Danaher Corporation
- Beta at 0.93 reflects market-correlated volatility; higher average volume suggests active trading and potential price swings.
4. Regulatory & Legal
Thermo Fisher Scientific Inc.
- Operates in heavily regulated healthcare markets; compliance costs and litigation risks remain material.
Danaher Corporation
- Similar regulatory environment; additional exposure in environmental and applied solutions may increase complexity.
5. Supply Chain & Operations
Thermo Fisher Scientific Inc.
- Global operations subject to supply chain disruptions, especially in biopharma services and specialty diagnostics.
Danaher Corporation
- Complex global supply chains across diverse segments; operational efficiency key to managing cost pressures.
6. ESG & Climate Transition
Thermo Fisher Scientific Inc.
- Growing focus on sustainability in healthcare; transition risks moderate but investor scrutiny increasing.
Danaher Corporation
- Environmental segment exposure raises ESG importance; climate transition strategy critical for long-term resilience.
7. Geopolitical Exposure
Thermo Fisher Scientific Inc.
- Significant international exposure across Asia-Pacific and Europe; geopolitical tensions could disrupt markets.
Danaher Corporation
- Also globally diversified; operations in sensitive regions may face trade and regulatory uncertainties.
Which company shows a better risk-adjusted profile?
Thermo Fisher faces its biggest risk in capital structure with moderate leverage nearing 0.74 debt-to-equity, which could constrain flexibility amid rising rates. Danaher’s primary risk lies in market competition across its varied segments, where margin pressure is acute. Danaher’s lower leverage and stronger interest coverage enhance its risk-adjusted profile. The notable recent drop in Thermo Fisher’s stock price underscores market sensitivity to leverage risks, favoring Danaher’s steadier financial footing.
Final Verdict: Which stock to choose?
Thermo Fisher Scientific Inc. (TMO) wields the superpower of operational scale and diversified innovation, driving solid cash flow despite some margin pressures. Its key point of vigilance is a declining ROIC trend, signaling caution on capital efficiency. TMO suits aggressive growth portfolios seeking resilience in life sciences.
Danaher Corporation (DHR) secures a strategic moat through its strong recurring revenue and superior income quality, supported by a robust balance sheet with lower leverage. Relative to TMO, DHR offers better financial stability but slower growth momentum. It fits well within GARP (Growth at a Reasonable Price) portfolios prioritizing safety.
If you prioritize scalable growth with innovative breadth, TMO is the compelling choice due to its commanding market position and cash generation. However, if you seek financial prudence and steady income quality, DHR offers better stability and a stronger balance sheet. Both present analytical scenarios worth weighing against your risk tolerance.
Disclaimer: Investment carries a risk of loss of initial capital. The past performance is not a reliable indicator of future results. Be sure to understand risks before making an investment decision.
Go Further
I encourage you to read the complete analyses of Thermo Fisher Scientific Inc. and Danaher Corporation to enhance your investment decisions: