Home > Comparison > Healthcare > DHR vs DGX
The strategic rivalry between Danaher Corporation and Quest Diagnostics shapes the healthcare diagnostics landscape. Danaher operates a diversified, capital-intensive model spanning life sciences, diagnostics, and environmental solutions. Quest Diagnostics focuses on diagnostic information services through an extensive laboratory and patient service network. This analysis contrasts Danaher’s broad industrial approach with Quest’s service-centric model to identify which offers a superior risk-adjusted return for diversified portfolios in today’s evolving healthcare sector.

Table of contents
Companies Overview
Danaher Corporation and Quest Diagnostics Incorporated stand as pillars in the medical diagnostics and research industry, shaping healthcare innovation and patient outcomes.
Danaher Corporation: Global Innovator in Life Sciences and Diagnostics
Danaher Corporation commands a diversified healthcare portfolio, primarily generating revenue from life sciences, diagnostics, and environmental solutions. Its core strength lies in advanced instruments and consumables for biopharmaceutical and clinical markets. In 2026, Danaher focuses strategically on expanding its technological edge in genomics and automation to drive sustainable growth.
Quest Diagnostics Incorporated: Premier Diagnostic Testing Provider
Quest Diagnostics leads as a diagnostic information services specialist, earning revenue through routine and advanced clinical testing across the US and internationally. It emphasizes comprehensive testing services delivered via an extensive network of labs and patient centers. Quest’s 2026 strategy centers on strengthening its patient access and IT solutions to enhance diagnostic accuracy and customer experience.
Strategic Collision: Similarities & Divergences
Both companies operate in healthcare diagnostics but diverge in approach. Danaher pursues a technology-driven, product innovation model with a broad industrial footprint. Quest Diagnostics adopts a service-oriented, patient-centric model focusing on diagnostic delivery and information services. Their primary battleground is clinical diagnostics innovation versus service efficiency. This contrast defines distinct investment profiles: Danaher as a diversified innovator and Quest as a diagnostic service leader.
Income Statement Comparison
This data dissects the core profitability and scalability of both corporate engines to reveal who dominates the bottom line:
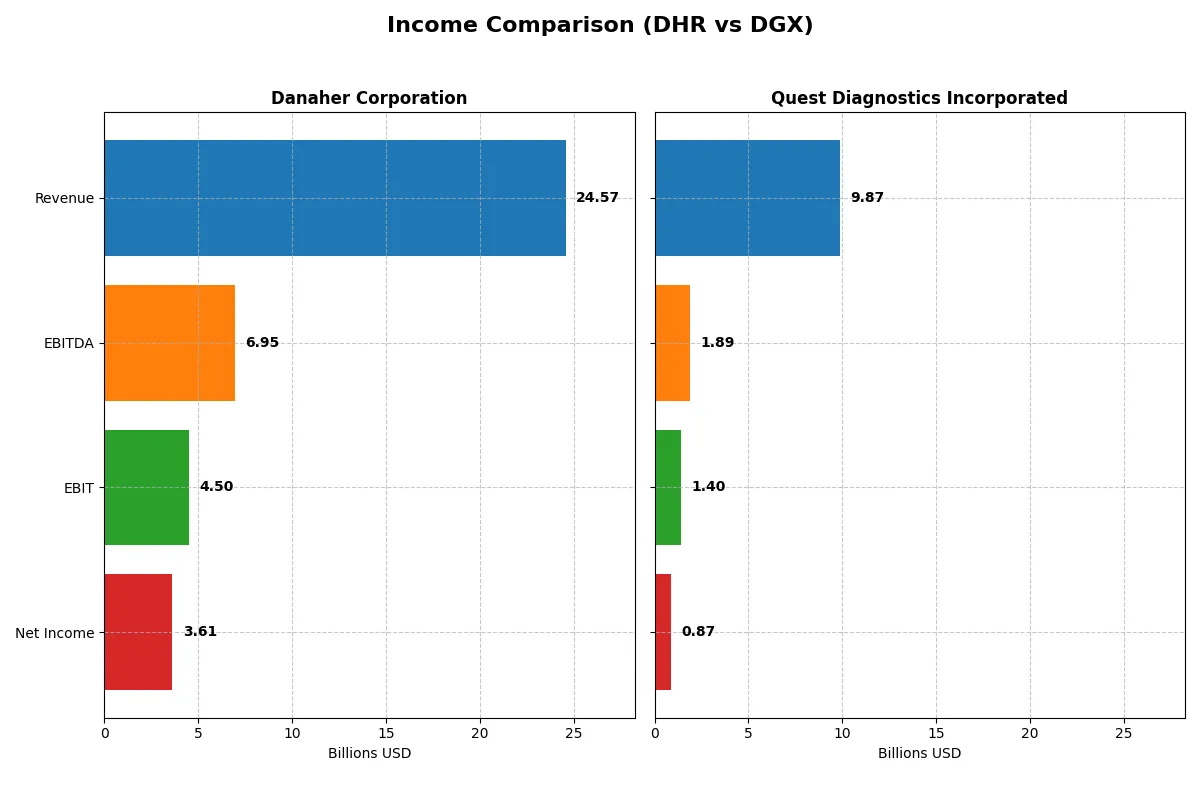
| Metric | Danaher Corporation (DHR) | Quest Diagnostics Incorporated (DGX) |
|---|---|---|
| Revenue | 24.57B | 9.87B |
| Cost of Revenue | 9.60B | 6.63B |
| Operating Expenses | 9.83B | 1.90B |
| Gross Profit | 14.97B | 3.24B |
| EBITDA | 6.95B | 1.89B |
| EBIT | 4.50B | 1.40B |
| Interest Expense | 0.27B | 0.23B |
| Net Income | 3.61B | 0.87B |
| EPS | 5.07 | 7.80 |
| Fiscal Year | 2025 | 2024 |
Income Statement Analysis: The Bottom-Line Duel
This income statement comparison exposes each company’s operational efficiency and profitability dynamics over recent years.
Danaher Corporation Analysis
Danaher’s revenue peaked at 29.45B in 2021 but declined to 24.57B by 2025, dragging net income down from 6.43B to 3.61B. Its gross margin stays robust around 61%, signaling strong cost control. However, a 9.9% net margin drop in 2025 reveals waning profitability momentum and challenges sustaining efficiency.
Quest Diagnostics Incorporated Analysis
Quest’s revenue grew modestly from 9.44B in 2020 to 9.87B in 2024, with net income rising initially but slipping to 871M recently. The firm maintains a stable gross margin near 33% and improved EBIT margin to 14.2%. Despite a slight net margin decline, operational expense management fuels positive EBIT growth, indicating improving operational efficiency.
Margin Strength vs. Growth Trajectory
Danaher dominates in margin strength with a superior gross and net margin but suffers from declining revenue and earnings momentum. Quest shows steadier revenue growth and improving EBIT despite lower margins. For investors, Danaher’s margin power suits those prioritizing profitability, while Quest appeals to those valuing gradual growth and operational improvements.
Financial Ratios Comparison
These vital ratios act as a diagnostic tool to expose the underlying fiscal health, valuation premiums, and capital efficiency of the companies compared below:
| Ratios | Danaher Corporation (DHR) | Quest Diagnostics Incorporated (DGX) |
|---|---|---|
| ROE | 6.9% | 12.9% |
| ROIC | 5.7% | 7.0% |
| P/E | 44.8 | 19.2 |
| P/B | 3.08 | 2.47 |
| Current Ratio | 1.87 | 1.10 |
| Quick Ratio | 1.51 | 1.02 |
| D/E | 0.35 | 1.05 |
| Debt-to-Assets | 22.1% | 43.9% |
| Interest Coverage | 19.4 | 6.0 |
| Asset Turnover | 0.29 | 0.61 |
| Fixed Asset Turnover | 4.44 | 3.57 |
| Payout Ratio | 24.3% | 38.0% |
| Dividend Yield | 0.54% | 1.98% |
| Fiscal Year | 2025 | 2024 |
Efficiency & Valuation Duel: The Vital Signs
Financial ratios serve as a company’s DNA, revealing hidden risks and operational excellence that raw numbers often obscure.
Danaher Corporation
Danaher’s ROE at 6.88% signals modest profitability, with a strong net margin of 14.71%. Its P/E of 44.8 marks the stock as expensive, stretched beyond typical sector averages. The company favors reinvestment, allocating 6.5% of revenue to R&D, reflecting a growth-focused strategy over dividends, which yield a low 0.54%.
Quest Diagnostics Incorporated
Quest Diagnostics shows healthier profitability with a 12.85% ROE and a neutral net margin of 8.82%. Its P/E of 19.23 presents a more reasonable valuation, neither cheap nor expensive. The firm pays a 1.98% dividend yield, balancing shareholder returns with stable earnings and moderate reinvestment, exhibiting a conservative capital allocation approach.
Premium Valuation vs. Balanced Profitability
Danaher commands a premium valuation, supported by solid margins but lower ROE, suggesting growth at a high price. Quest Diagnostics offers a steadier profit profile, with moderate valuation and higher returns on equity. Investors seeking growth and reinvestment may prefer Danaher; those favoring income and valuation discipline might lean toward Quest.
Which one offers the Superior Shareholder Reward?
I see Danaher (DHR) delivers a conservative 0.54% dividend yield with a payout ratio near 24%, supported by strong FCF coverage (3.15x). Its buyback activity is less prominent but steady. Quest Diagnostics (DGX) pays almost 2% yield with a higher 38% payout ratio, yet weaker dividend and capex coverage (1.76x). DGX’s aggressive buybacks complement total returns. I find Danaher’s balanced dividend and buyback model more sustainable given its stronger cash flow and lower leverage. In 2026, Danaher offers a superior total return profile with prudent capital allocation anchoring long-term value.
Comparative Score Analysis: The Strategic Profile
The radar chart reveals the fundamental DNA and trade-offs of Danaher Corporation and Quest Diagnostics Incorporated:
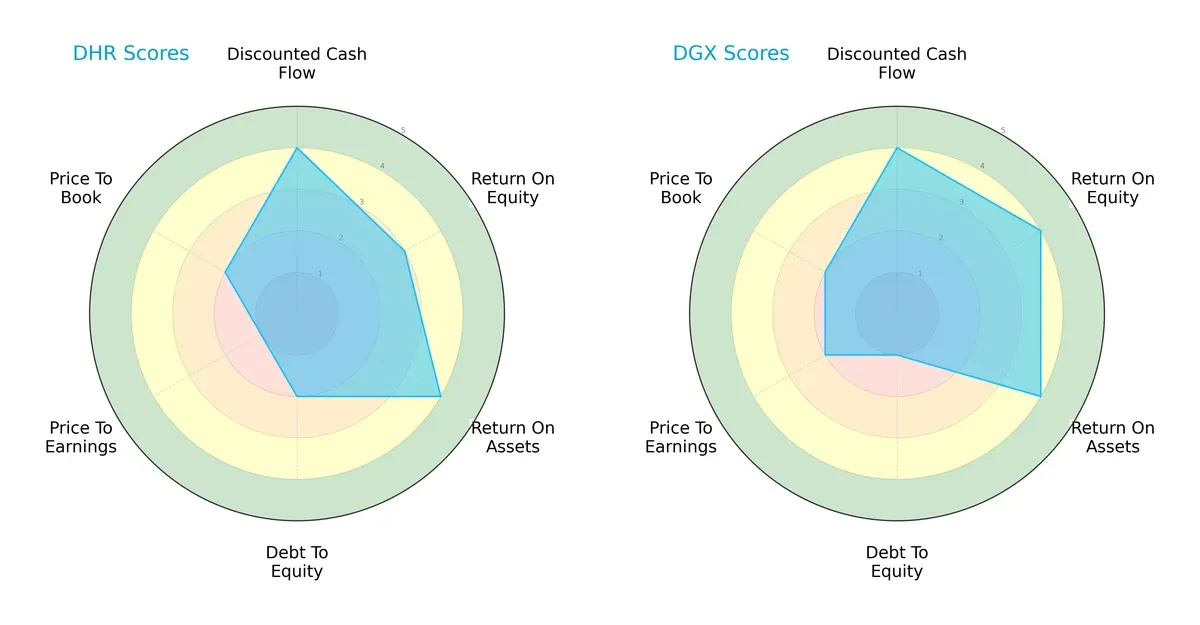
Danaher and Quest Diagnostics share strong discounted cash flow and return on assets scores, indicating efficient asset use and solid cash flow projections. Quest Diagnostics edges ahead on return on equity but struggles with a weak debt-to-equity score, signaling higher financial risk. Danaher shows a more balanced profile, though its very unfavorable price-to-earnings score suggests valuation concerns. Quest relies on profitability strength but carries leverage risks.
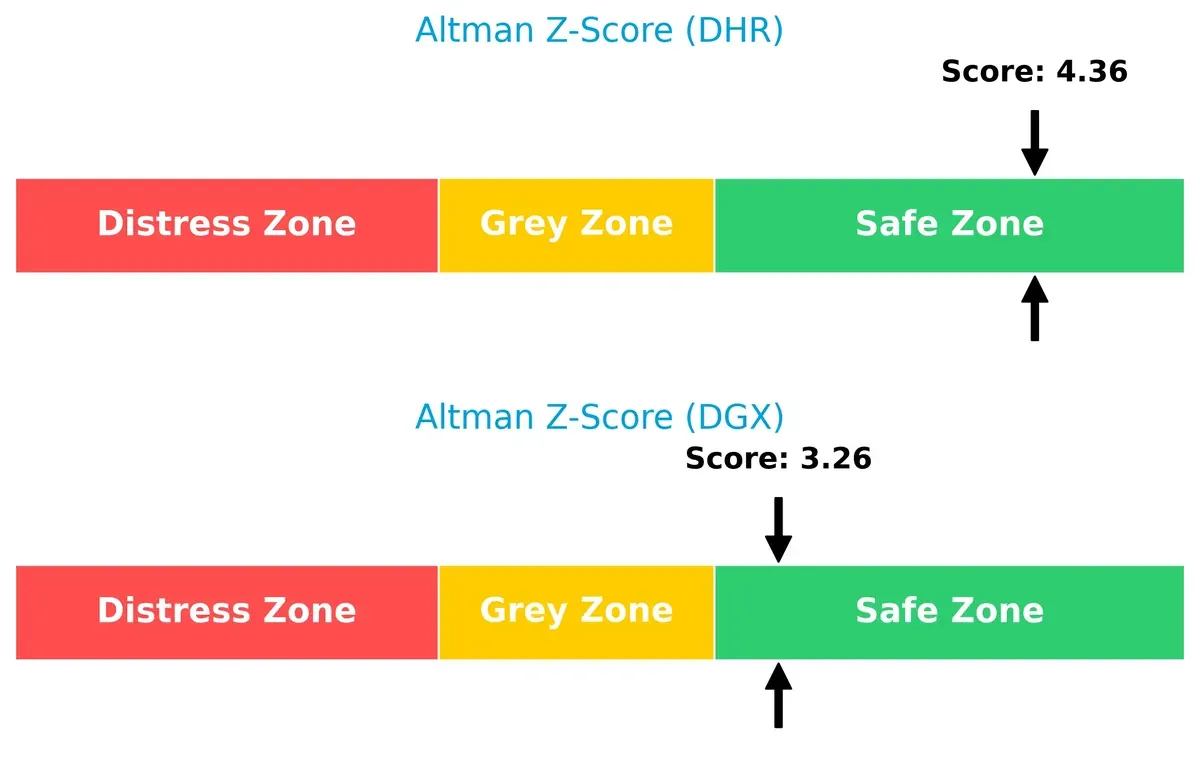
Bankruptcy Risk: Solvency Showdown
Danaher’s higher Altman Z-Score (4.36 vs. 3.26) signals stronger financial stability and lower bankruptcy risk in this cycle:
Financial Health: Quality of Operations
Both firms score a strong 7 on the Piotroski F-Score, indicating robust internal financial metrics and operational quality:

How are the two companies positioned?
This section dissects the operational DNA of Danaher and Quest Diagnostics by comparing their revenue distribution and internal strengths and weaknesses. The goal is to confront their economic moats to identify which model offers the most resilient competitive advantage today.
Revenue Segmentation: The Strategic Mix
This comparison dissects how Danaher Corporation and Quest Diagnostics diversify their income streams and reveals where their primary sector bets lie:
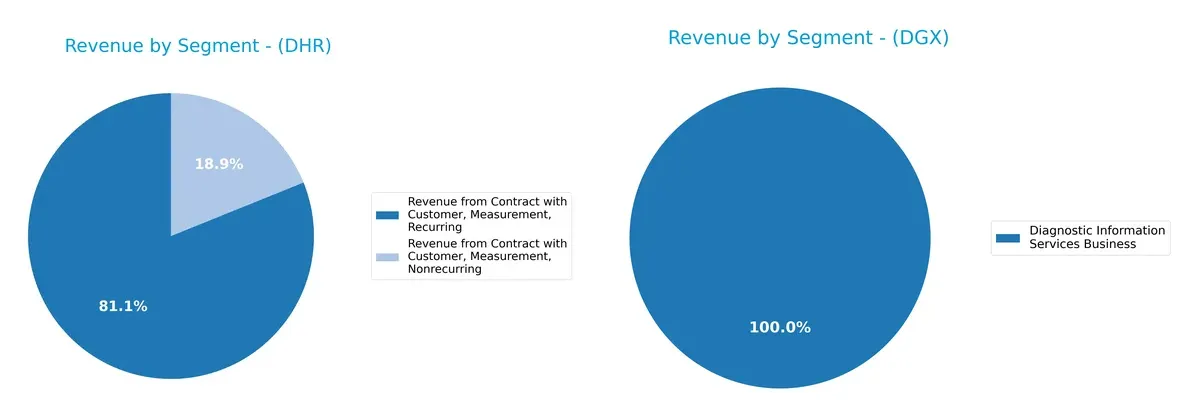
Danaher leans heavily on two core segments: recurring measurement revenue at $19.4B and nonrecurring at $4.5B. Quest Diagnostics, by contrast, concentrates $9.6B in Diagnostic Information Services, with minor contributions elsewhere. Danaher’s mix shows deliberate diversification within measurement services, reducing single-segment risk. Quest’s reliance on one dominant segment exposes it to sector-specific fluctuations but underscores its entrenched position in diagnostics.
Strengths and Weaknesses Comparison
This table compares the Strengths and Weaknesses of Danaher Corporation and Quest Diagnostics Incorporated:
Danaher Corporation Strengths
- Diversified revenue streams across dental, diagnostics, environmental, and life sciences
- Favorable net margin of 14.7%
- Strong liquidity ratios with current ratio 1.87 and quick ratio 1.51
- Low debt-to-equity at 0.35 and high interest coverage of 16.97
- Global presence with significant revenues from North America and other developed markets
Quest Diagnostics Strengths
- Focused diagnostic services business with stable revenue around 9.6B
- Neutral net margin and ROIC indicating steady profitability
- Favorable weighted average cost of capital at 5.8%
- Adequate liquidity with quick ratio of 1.02
- Moderate debt levels with debt-to-assets at 43.9% and interest coverage of 6.2
Danaher Corporation Weaknesses
- Unfavorable ROE at 6.9% below WACC of 7.7%
- High price multiples with PE at 44.8 and PB at 3.08
- Low asset turnover at 0.29 suggesting capital inefficiency
- Low dividend yield at 0.54% may deter income investors
Quest Diagnostics Weaknesses
- Higher debt-to-equity ratio at 1.05 indicating leverage risk
- Neutral current ratio at 1.1 suggests limited liquidity buffer
- Moderate asset turnover of 0.61 not excelling in asset efficiency
- PE and PB ratios in neutral territory may reflect valuation uncertainties
Danaher’s strengths lie in diversification and solid liquidity coupled with strong global footprint. Quest Diagnostics showcases focused market presence with steady profitability but bears higher leverage and moderate liquidity. These profiles shape their strategic priorities differently.
The Moat Duel: Analyzing Competitive Defensibility
A structural moat alone protects long-term profits from relentless competitive pressure. Let’s dissect how these firms shield their earnings in 2026:
Danaher Corporation: Innovation-Driven Intangible Assets
Danaher’s moat stems from its intangible assets—proprietary life sciences and diagnostics technologies. This manifests in superior margins, yet declining ROIC signals emerging efficiency challenges. New product lines in bioprocessing could deepen its moat if execution improves.
Quest Diagnostics Incorporated: Network Effects in Diagnostic Services
Quest leverages extensive diagnostic networks and patient service reach, creating switching costs unseen in Danaher’s model. Despite a slightly unfavorable moat rating, revenue growth and operational gains suggest resilience. Expansion into IT-enabled healthcare services could disrupt traditional lab testing.
Verdict: Intangible Assets vs. Network Effects in Healthcare Diagnostics
Danaher’s innovation moat is deeper but currently eroding due to falling capital efficiency. Quest’s network effect moat is narrower yet more stable, better defending market share in a consolidating sector. I see Quest as better positioned to sustain competitive advantage in 2026.
Which stock offers better returns?
Over the past year, Danaher Corporation’s shares declined significantly, while Quest Diagnostics posted robust gains despite recent stabilization in both stocks’ trading activity.
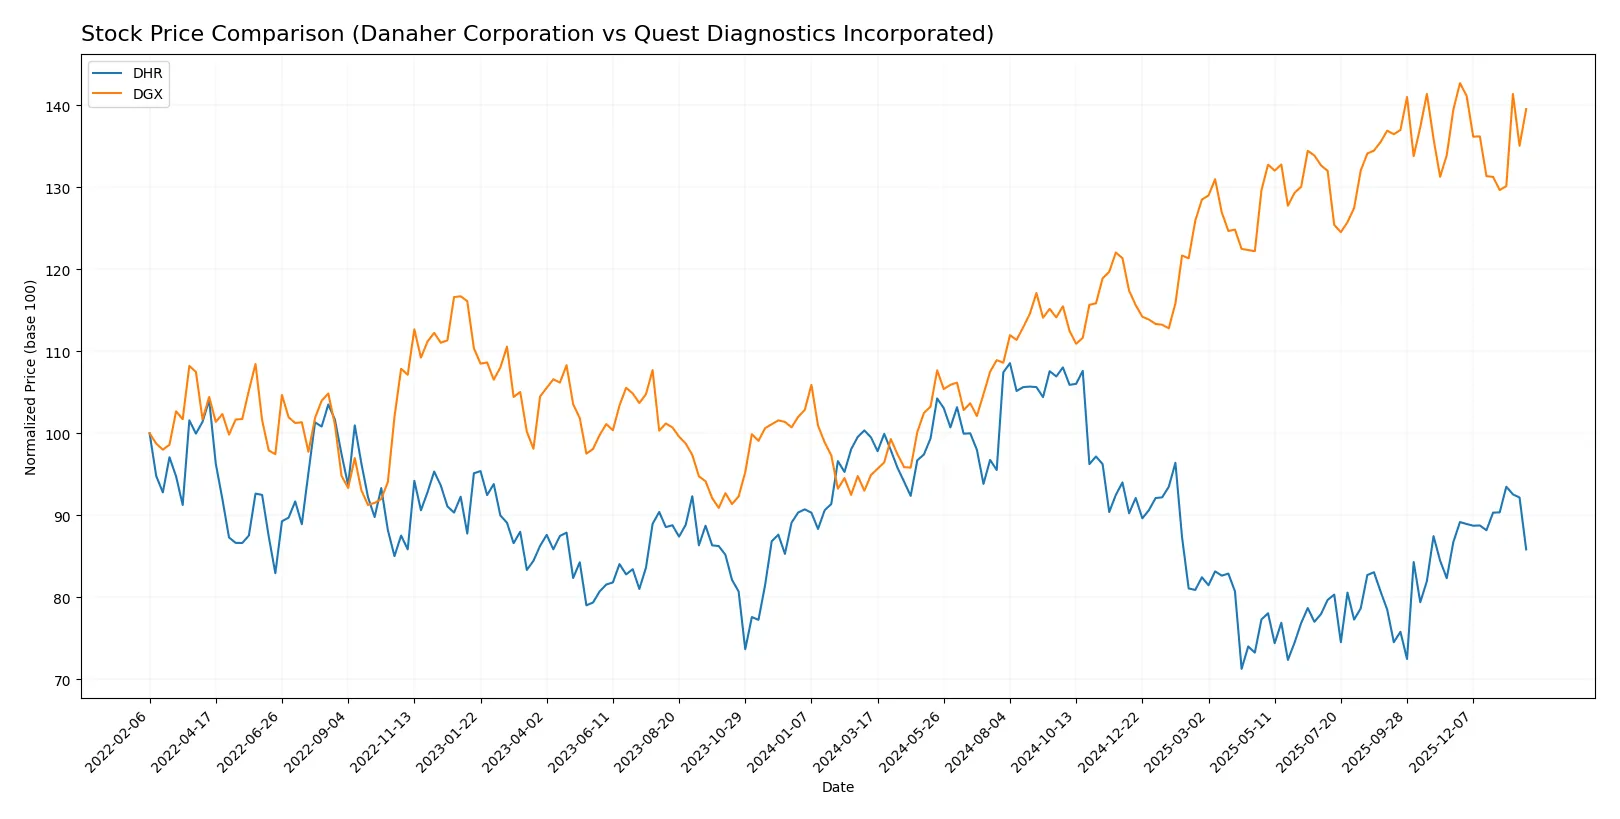
Trend Comparison
Danaher Corporation’s stock fell 13.72% over the last 12 months, reflecting a bearish trend with accelerating downside momentum and a high volatility level (26.61 std deviation). Its price ranged between 181.77 and 276.75.
Quest Diagnostics’ shares rose 46.99% in the same period, signaling a bullish trend with decelerating upward momentum and moderate volatility (17.42 std deviation). The stock traded between 127.24 and 191.25.
Comparing both, Quest Diagnostics outperformed Danaher significantly, delivering the highest market returns amid contrasting trend directions.
Target Prices
Analysts present a bullish consensus for both Danaher Corporation and Quest Diagnostics, reflecting confidence in their growth potential.
| Company | Target Low | Target High | Consensus |
|---|---|---|---|
| Danaher Corporation | 220 | 270 | 252.33 |
| Quest Diagnostics Incorporated | 190 | 215 | 203.1 |
Danaher’s consensus target at 252.33 implies a 15% upside from the current 218.89 price. Quest Diagnostics shows roughly 9% upside from 187.03, signaling moderate analyst optimism.

Don’t Let Luck Decide Your Entry Point
Optimize your entry points with our advanced ProRealTime indicators. You’ll get efficient buy signals with precise price targets for maximum performance. Start outperforming now!
How do institutions grade them?
Danaher Corporation Grades
Below are the recent institutional grades for Danaher Corporation:
| Grading Company | Action | New Grade | Date |
|---|---|---|---|
| JP Morgan | maintain | Overweight | 2026-01-29 |
| Jefferies | maintain | Buy | 2026-01-29 |
| TD Cowen | maintain | Buy | 2026-01-07 |
| Guggenheim | maintain | Buy | 2026-01-05 |
| Wells Fargo | maintain | Equal Weight | 2025-12-15 |
| Wells Fargo | maintain | Equal Weight | 2025-10-23 |
| Barclays | maintain | Overweight | 2025-10-22 |
| TD Cowen | maintain | Buy | 2025-10-22 |
| Rothschild & Co | downgrade | Neutral | 2025-10-08 |
| Evercore ISI Group | maintain | Outperform | 2025-10-07 |
Quest Diagnostics Incorporated Grades
Below are the recent institutional grades for Quest Diagnostics Incorporated:
| Grading Company | Action | New Grade | Date |
|---|---|---|---|
| Piper Sandler | maintain | Neutral | 2025-10-27 |
| Truist Securities | maintain | Hold | 2025-10-22 |
| Barclays | maintain | Equal Weight | 2025-10-22 |
| Jefferies | maintain | Buy | 2025-10-21 |
| Leerink Partners | maintain | Outperform | 2025-10-21 |
| Mizuho | maintain | Outperform | 2025-10-17 |
| UBS | maintain | Neutral | 2025-10-17 |
| Evercore ISI Group | maintain | In Line | 2025-10-08 |
| Barclays | maintain | Equal Weight | 2025-10-02 |
| Baird | downgrade | Neutral | 2025-08-25 |
Which company has the best grades?
Danaher Corporation holds more consistent Buy and Overweight ratings from leading firms, signaling stronger institutional confidence. Quest Diagnostics shows mixed ratings, including Neutral and Equal Weight, indicating a more cautious outlook. This divergence may influence investor sentiment and portfolio positioning differently.
Risks specific to each company
The following categories identify critical pressure points and systemic threats facing Danaher Corporation and Quest Diagnostics in the 2026 market environment:
1. Market & Competition
Danaher Corporation
- Operates in diverse segments with strong innovation but faces intense competition from specialized biotech firms.
Quest Diagnostics Incorporated
- Focuses on diagnostic testing services, competing heavily with regional labs and emerging telehealth diagnostics.
2. Capital Structure & Debt
Danaher Corporation
- Maintains a conservative debt-to-equity ratio of 0.35, signaling low financial leverage risk.
Quest Diagnostics Incorporated
- High debt-to-equity ratio of 1.05 raises financial risk and limits flexibility in downturns.
3. Stock Volatility
Danaher Corporation
- Beta near 0.93 suggests moderate sensitivity to market swings, slightly above Quest’s.
Quest Diagnostics Incorporated
- Lower beta at 0.64 indicates less price volatility, offering defensive equity characteristics.
4. Regulatory & Legal
Danaher Corporation
- Subject to stringent FDA and international regulatory standards across multiple product lines.
Quest Diagnostics Incorporated
- Faces regulatory scrutiny mainly in clinical testing compliance and patient data privacy laws.
5. Supply Chain & Operations
Danaher Corporation
- Complex supply chain risks from global manufacturing and raw material sourcing.
Quest Diagnostics Incorporated
- Dependent on logistics and timely sample processing; operational delays can impact service delivery.
6. ESG & Climate Transition
Danaher Corporation
- Advanced environmental solutions segment aligns with climate goals but requires continuous investment.
Quest Diagnostics Incorporated
- ESG risks moderate; focus on sustainable lab practices but less diversified in green innovation.
7. Geopolitical Exposure
Danaher Corporation
- Global footprint exposes it to trade tensions and regulatory shifts in multiple jurisdictions.
Quest Diagnostics Incorporated
- Primarily US-focused, limiting geopolitical risk but more vulnerable to domestic policy changes.
Which company shows a better risk-adjusted profile?
Danaher’s most significant risk lies in market competition amid rapid innovation but benefits from a strong balance sheet and diversified operations. Quest Diagnostics faces considerable financial risk from high leverage but exhibits lower stock volatility and regulatory exposure. Danaher’s superior Altman Z-score and debt metrics signal a better risk-adjusted profile. Recent data highlights Quest’s elevated debt-to-equity ratio (1.05) as a red flag, whereas Danaher’s conservative leverage (0.35) supports financial resilience.
Final Verdict: Which stock to choose?
Danaher Corporation’s superpower lies in its operational efficiency and strong balance sheet, which supports stable cash flow generation. However, its declining profitability and value destruction pose a point of vigilance. It suits investors with an appetite for aggressive growth who can tolerate short-term setbacks for long-term operational strength.
Quest Diagnostics benefits from a strategic moat built on recurring revenue and solid cash flow, offering better safety in a volatile market. Though it carries higher leverage, its favorable income growth and valuation metrics make it more suitable for those seeking Growth at a Reasonable Price (GARP) with moderate risk tolerance.
If you prioritize operational excellence and can weather profitability headwinds, Danaher outshines as a choice for growth-focused portfolios. However, if you seek greater stability and a more balanced risk profile, Quest Diagnostics offers better footing with its recurring revenues and reasonable valuation. Both present distinct analytical scenarios depending on your risk and growth preferences.
Disclaimer: Investment carries a risk of loss of initial capital. The past performance is not a reliable indicator of future results. Be sure to understand risks before making an investment decision.
Go Further
I encourage you to read the complete analyses of Danaher Corporation and Quest Diagnostics Incorporated to enhance your investment decisions: