Home > Comparison > Healthcare > DHR vs IQV
The strategic rivalry between Danaher Corporation and IQVIA Holdings Inc. shapes the future of the healthcare diagnostics and research sector. Danaher, a diversified medical products manufacturer, contrasts with IQVIA’s data-driven clinical research and technology services model. This head-to-head frames a contest between industrial innovation and advanced analytics leadership. This analysis aims to reveal which corporate path offers superior risk-adjusted returns for a diversified portfolio in today’s dynamic healthcare landscape.

Table of contents
Companies Overview
Danaher Corporation and IQVIA Holdings Inc. stand as pivotal innovators in the healthcare diagnostics and research market.
Danaher Corporation: Precision Instrumentation Leader
Danaher dominates the medical diagnostics and life sciences instruments sector, generating revenue from advanced tools like mass spectrometers and genomics consumables. Its strategic focus in 2026 centers on expanding bioprocess technologies and environmental solutions, catering to pharmaceutical, research, and industrial clients globally. This broad yet specialized portfolio fuels its robust market position.
IQVIA Holdings Inc.: Data-Driven Clinical Services Powerhouse
IQVIA leads in advanced analytics and clinical research services for life sciences, monetizing through cloud-based software, real-world evidence, and clinical trial management. In 2026, it emphasizes enhancing technology solutions and expanding virtual trial capabilities to optimize healthcare decision-making and patient outcomes across multiple continents.
Strategic Collision: Similarities & Divergences
Both companies serve healthcare but differ sharply: Danaher offers tangible instruments and diagnostics, while IQVIA provides intangible analytics and research services. Their primary battleground lies in supporting life sciences innovation—one through hardware, the other through data and clinical processes. Investors must weigh Danaher’s asset-heavy, diversified model against IQVIA’s high-growth, tech-centric profile.
Income Statement Comparison
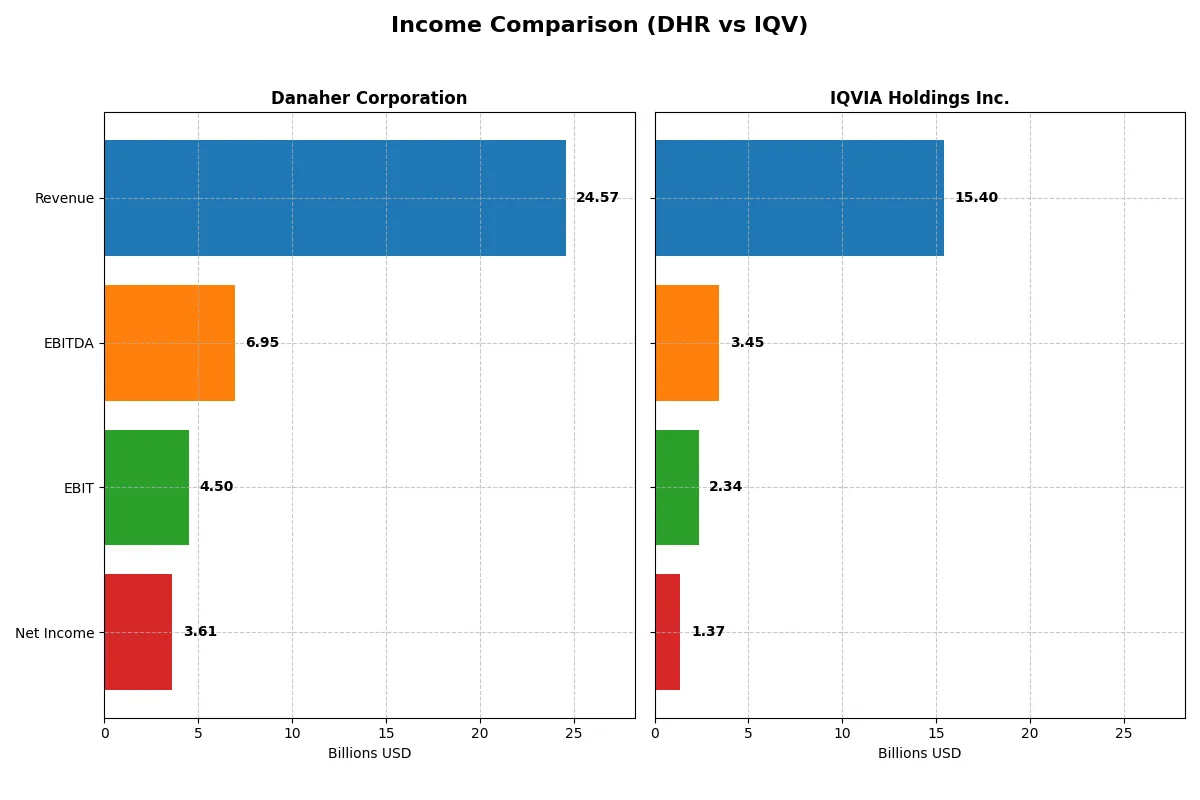
This data dissects the core profitability and scalability of both corporate engines to reveal who dominates the bottom line:
| Metric | Danaher Corporation (DHR) | IQVIA Holdings Inc. (IQV) |
|---|---|---|
| Revenue | 24.6B | 15.4B |
| Cost of Revenue | 9.6B | 10.0B |
| Operating Expenses | 9.8B | 3.2B |
| Gross Profit | 15.0B | 5.4B |
| EBITDA | 6.9B | 3.5B |
| EBIT | 4.5B | 2.3B |
| Interest Expense | 0.3B | 0.7B |
| Net Income | 3.6B | 1.4B |
| EPS | 5.07 | 7.57 |
| Fiscal Year | 2025 | 2024 |
Income Statement Analysis: The Bottom-Line Duel
This income statement comparison exposes the core operating efficiency and profit quality of two leading corporate engines.
Danaher Corporation Analysis
Danaher’s revenue slipped from 29.5B in 2021 to 24.6B in 2025, revealing a downward trend. Net income fell sharply by 44% over five years to 3.6B in 2025. Despite this, the company sustains strong gross margins near 61% and a solid net margin of 14.7%. However, recent declines in EBIT (-8.7%) and EPS (-4.7%) signal weakening momentum and efficiency challenges.
IQVIA Holdings Inc. Analysis
IQVIA grew revenue steadily from 11.4B in 2020 to 15.4B in 2024, marking robust expansion. Net income surged over 390% to 1.37B, reflecting impressive bottom-line growth. Gross margin holds at a moderate 34.9%, with an EBIT margin of 15.2%. IQV’s EBIT grew 9.8% last year, and EPS increased 2.7%, showcasing improving operational leverage and margin expansion.
Margin Strength vs. Growth Trajectory
Danaher dominates with superior margin profiles but suffers from declining revenue and earnings over the medium term. IQV shows less margin power but outpaces Danaher in revenue and net income growth with accelerating profitability. For investors, Danaher’s profile suits those prioritizing margin quality, while IQV appeals to growth-focused portfolios seeking dynamic earnings gains.
Financial Ratios Comparison
These vital ratios act as a diagnostic tool to expose the underlying fiscal health, valuation premiums, and capital efficiency of the companies compared below:
| Ratios | Danaher Corporation (DHR) | IQVIA Holdings Inc. (IQV) |
|---|---|---|
| ROE | 6.9% | 22.6% |
| ROIC | 5.7% | 8.6% |
| P/E | 44.8 | 25.9 |
| P/B | 3.08 | 5.87 |
| Current Ratio | 1.87 | 0.84 |
| Quick Ratio | 1.51 | 0.84 |
| D/E | 0.35 | 2.33 |
| Debt-to-Assets | 22.1% | 52.6% |
| Interest Coverage | 19.4 | 3.29 |
| Asset Turnover | 0.29 | 0.57 |
| Fixed Asset Turnover | 4.44 | 19.93 |
| Payout ratio | 24.3% | 0% |
| Dividend yield | 0.54% | 0% |
| Fiscal Year | 2025 | 2024 |
Efficiency & Valuation Duel: The Vital Signs
Financial ratios act as a company’s DNA, unveiling hidden risks and operational strengths that shape investor confidence and valuation.
Danaher Corporation
Danaher posts a modest 6.9% ROE with a strong 14.7% net margin, signaling solid profitability but limited equity efficiency. The stock trades at a stretched 44.8 P/E and 3.08 P/B, reflecting premium valuation. Shareholder returns lean on a low 0.54% dividend, with heavy reinvestment in R&D bolstering future growth.
IQVIA Holdings Inc.
IQVIA shows an impressive 22.6% ROE but a moderate 8.9% net margin, indicating high return on equity despite slimmer margins. Its P/E of 25.95 and P/B of 5.87 mark the stock as expensive amid weaker liquidity ratios. IQV offers no dividends, focusing capital on growth rather than immediate shareholder payouts.
Premium Valuation vs. Operational Safety
Danaher’s valuation is more stretched but backed by operational safety and a balanced capital structure. IQV boasts superior ROE but weaker liquidity and higher leverage. Danaher suits risk-averse investors seeking stability; IQV fits those targeting growth with tolerance for financial risk.
Which one offers the Superior Shareholder Reward?
I observe Danaher (DHR) maintains a modest 0.54% dividend yield with a sustainable 24% payout ratio, supported by robust free cash flow coverage above 80%. Their disciplined buybacks enhance shareholder returns steadily. IQVIA (IQV) pays no dividends, instead reinvesting all free cash flow into growth, evidenced by higher capex and R&D intensity. IQV’s buybacks appear limited, constrained by heavy leverage (debt-to-equity over 2.3x). Historically, Danaher’s balanced distribution—dividends plus buybacks—offers a more reliable total return in 2026, while IQV’s aggressive reinvestment strategy carries higher risk but growth potential. For risk-conscious investors seeking consistent reward, I favor Danaher’s superior and sustainable shareholder return model.
Comparative Score Analysis: The Strategic Profile
The radar chart reveals the fundamental DNA and trade-offs of Danaher Corporation and IQVIA Holdings Inc., highlighting their strategic financial strengths:
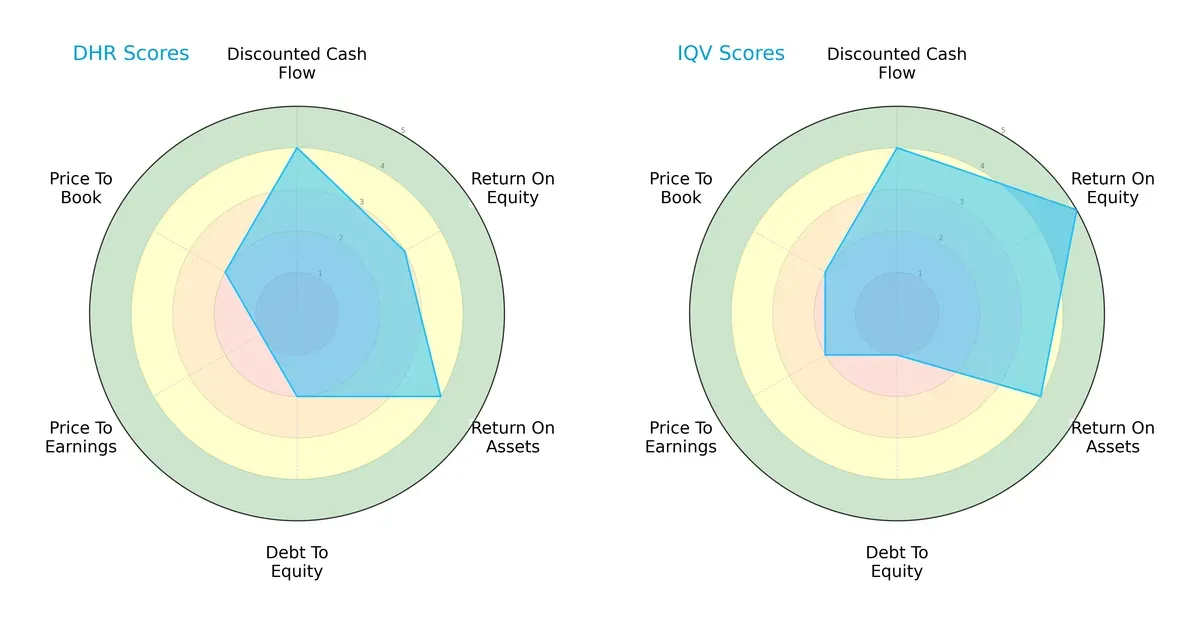
Danaher shows solid discounted cash flow (DCF) and return on assets (ROA) scores but struggles with valuation metrics, especially price-to-earnings (P/E). IQVIA excels in return on equity (ROE) and maintains a lower debt-to-equity ratio, reflecting financial prudence. IQVIA’s profile is more balanced, while Danaher relies on operational efficiency despite valuation pressures.
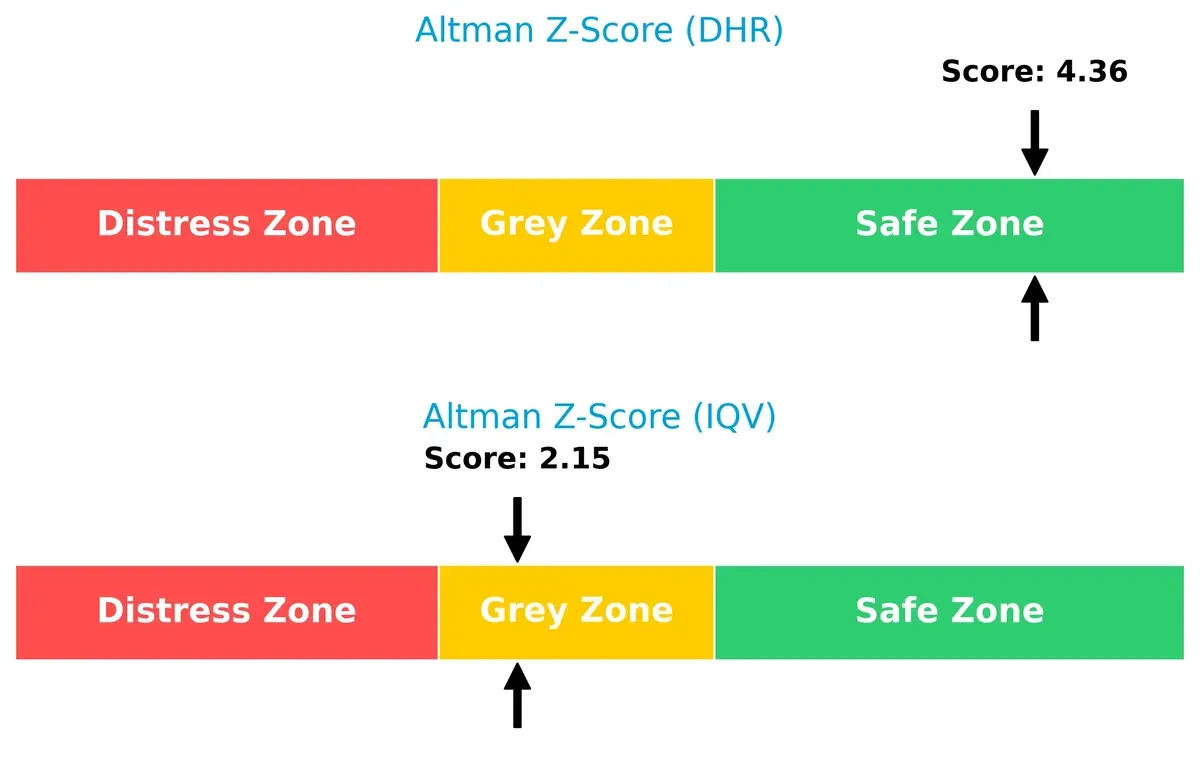
Bankruptcy Risk: Solvency Showdown
Danaher’s Altman Z-Score of 4.36 places it comfortably in the safe zone, signaling strong long-term solvency. IQVIA’s 2.15 in the grey zone signals moderate bankruptcy risk in this market cycle:
Financial Health: Quality of Operations
Danaher’s Piotroski F-Score of 7 indicates strong financial health and sound internal operations. IQVIA’s score of 5 suggests average quality with some potential red flags to monitor:

How are the two companies positioned?
This section dissects the operational DNA of Danaher and IQVIA by comparing their revenue distribution by segment alongside their internal strengths and weaknesses. The goal is to confront their economic moats and identify which model delivers the most resilient, sustainable competitive advantage today.
Revenue Segmentation: The Strategic Mix
This visual comparison dissects how Danaher Corporation and IQVIA Holdings diversify their income streams and reveals their primary sector bets:
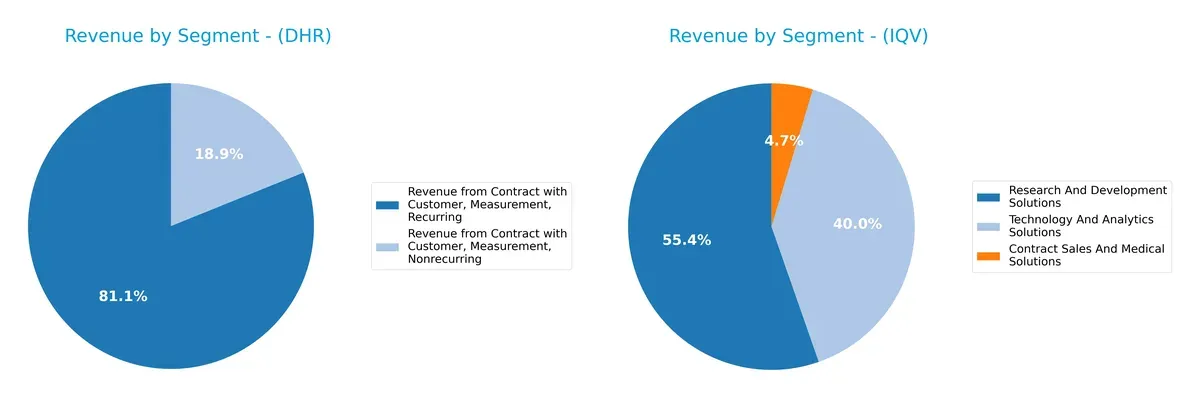
Danaher’s revenue pivots heavily on Measurement contracts, with $19.4B in recurring and $4.5B in nonrecurring revenue for 2024, showing a concentrated yet stable stream. IQVIA displays a more balanced mix, with $8.5B from Research and Development Solutions, $6.2B from Technology and Analytics, and $0.7B from Contract Sales. Danaher’s focus anchors on infrastructure dominance, while IQVIA’s spread mitigates concentration risk through diversified healthcare services.
Strengths and Weaknesses Comparison
This table compares the strengths and weaknesses of Danaher Corporation and IQVIA Holdings Inc.:
Danaher Corporation Strengths
- Strong net margin at 14.71%
- Favorable current and quick ratios above 1.5
- Low debt-to-assets at 22%
- High interest coverage at 16.97
- Recurring revenue above 19B USD
- Diverse geographic presence including North America and China
IQVIA Holdings Inc. Strengths
- High ROE at 22.63% indicating efficient equity use
- Favorable fixed asset turnover at 19.93
- Growing revenue in research and development solutions over 8.5B USD
- Broad global reach with strong Americas and EMEA sales
- Neutral net margin suggests stable profitability
- Innovation-driven segments like technology and analytics
Danaher Corporation Weaknesses
- ROE weak at 6.88%, below sector standard
- High P/E ratio of 44.8 implies premium valuation
- Unfavorable asset turnover at 0.29 limits efficiency
- Dividend yield is low at 0.54%
- Price-to-book ratio above 3 signals overvaluation
IQVIA Holdings Inc. Weaknesses
- Current ratio below 1 at 0.84 indicates liquidity risk
- High debt-to-equity ratio at 2.33 increases financial risk
- Elevated price-to-book at 5.87 suggests expensive stock
- Dividend yield absent, reducing income appeal
- Net margin moderate at 8.91%
- Interest coverage low at 3.49 raises solvency concerns
Danaher demonstrates financial stability and diversified recurring revenue but faces valuation and efficiency challenges. IQVIA excels in equity returns and asset utilization but shows liquidity and leverage vulnerabilities. These contrasts highlight differing strategic focuses and risk profiles for each company.
The Moat Duel: Analyzing Competitive Defensibility
A structural moat is the only true shield protecting long-term profits against relentless competitive erosion. Let’s dissect the core moats behind two healthcare giants:
Danaher Corporation: Intangible Assets & Integration Mastery
Danaher leverages deep intangible assets and operational integration, reflected in stable gross margins near 61%. However, declining ROIC signals weakening profitability in 2026, threatening its moat durability.
IQVIA Holdings Inc.: Data Network Effects & Analytics Scale
IQVIA’s moat stems from vast data network effects and analytics scale. Its growing ROIC and robust margin expansions highlight strengthening competitive positioning, with promising expansion in real-world evidence and cloud solutions.
Intangible Assets vs. Data Network Effects: Who Defends Better?
Danaher’s moat is broader but currently eroding, while IQVIA exhibits a narrower yet deepening moat fueled by accelerating profitability. IQVIA stands better equipped to defend and grow its market share in 2026.
Which stock offers better returns?
The past year reveals notable price declines for both Danaher Corporation and IQVIA Holdings Inc., with recent shifts suggesting divergent short-term momentum.
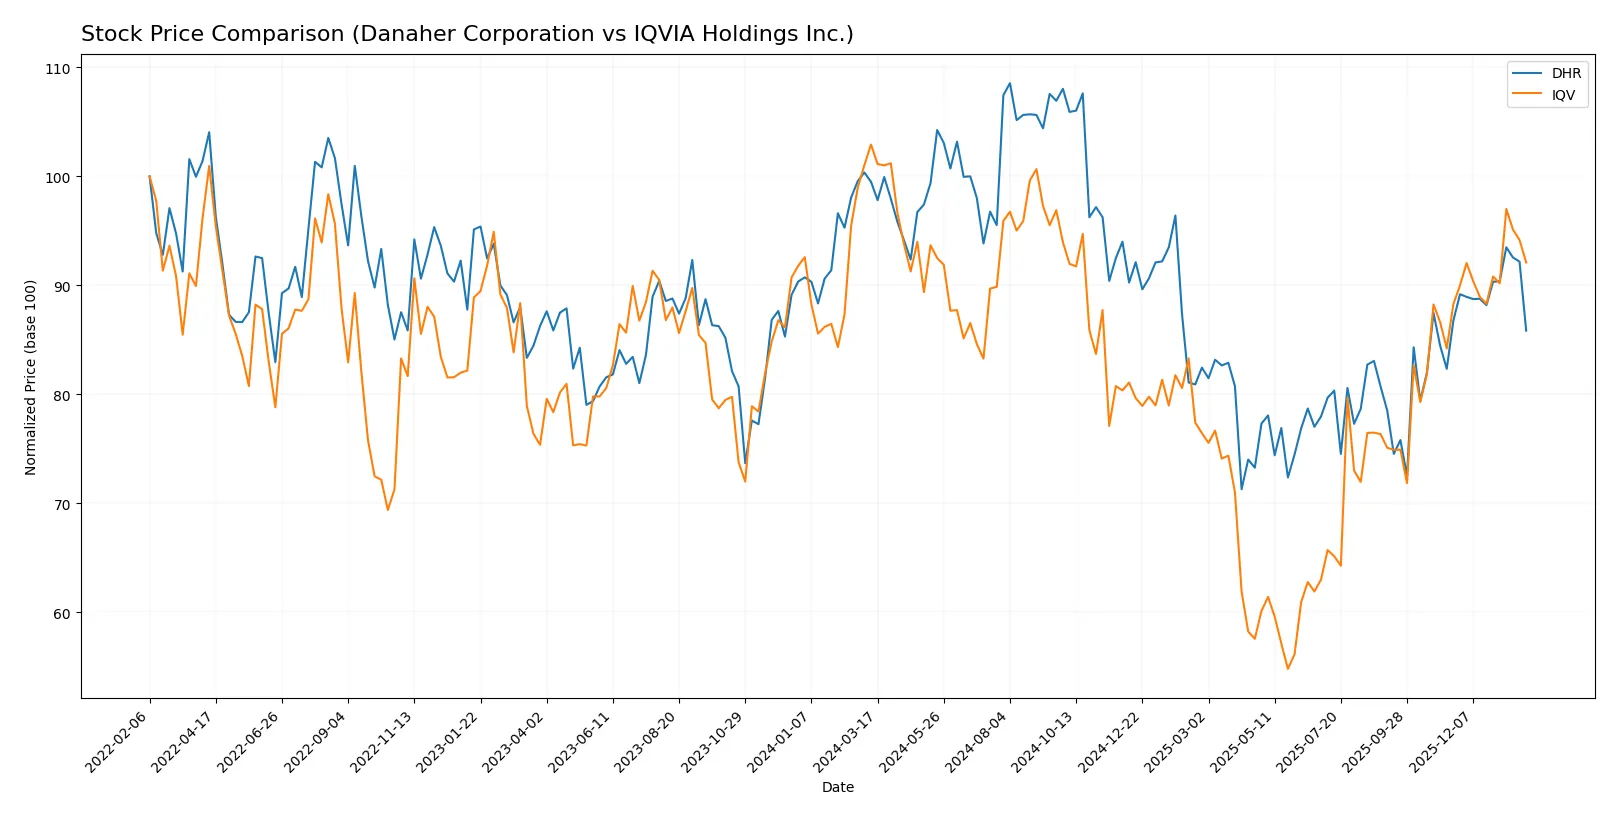
Trend Comparison
Danaher Corporation’s stock fell 13.72% over the last 12 months, reflecting an accelerating bearish trend with high volatility and a low near 182. The recent slight uptrend shows minimal recovery.
IQVIA Holdings Inc. declined 10.51% in the same period, also with an accelerating bearish trend and higher volatility. The recent trend reversed to a 4.32% gain, indicating short-term bullish momentum.
Comparing both stocks, IQVIA delivered a smaller annual loss and shows recent price strength, outperforming Danaher’s steeper decline and weaker short-term trend.
Target Prices
Analysts present a moderately bullish consensus for both Danaher Corporation and IQVIA Holdings.
| Company | Target Low | Target High | Consensus |
|---|---|---|---|
| Danaher Corporation | 220 | 270 | 252.33 |
| IQVIA Holdings Inc. | 214 | 290 | 253.2 |
The target consensus for Danaher exceeds its current price of 218.89, implying upside potential. IQVIA’s consensus target also surpasses its current price of 230.15, reflecting positive analyst expectations.

Don’t Let Luck Decide Your Entry Point
Optimize your entry points with our advanced ProRealTime indicators. You’ll get efficient buy signals with precise price targets for maximum performance. Start outperforming now!
How do institutions grade them?
Danaher Corporation Grades
Below are recent grades from major financial institutions for Danaher Corporation:
| Grading Company | Action | New Grade | Date |
|---|---|---|---|
| JP Morgan | maintain | Overweight | 2026-01-29 |
| Jefferies | maintain | Buy | 2026-01-29 |
| TD Cowen | maintain | Buy | 2026-01-07 |
| Guggenheim | maintain | Buy | 2026-01-05 |
| Wells Fargo | maintain | Equal Weight | 2025-12-15 |
| Wells Fargo | maintain | Equal Weight | 2025-10-23 |
| Barclays | maintain | Overweight | 2025-10-22 |
| TD Cowen | maintain | Buy | 2025-10-22 |
| Rothschild & Co | downgrade | Neutral | 2025-10-08 |
| Evercore ISI Group | maintain | Outperform | 2025-10-07 |
IQVIA Holdings Inc. Grades
Recent institutional grades for IQVIA Holdings Inc. are summarized below:
| Grading Company | Action | New Grade | Date |
|---|---|---|---|
| TD Cowen | maintain | Hold | 2026-01-22 |
| Truist Securities | maintain | Buy | 2026-01-08 |
| UBS | maintain | Buy | 2026-01-08 |
| Morgan Stanley | maintain | Overweight | 2025-12-02 |
| TD Cowen | downgrade | Hold | 2025-11-03 |
| Truist Securities | maintain | Buy | 2025-10-29 |
| Baird | upgrade | Outperform | 2025-10-29 |
| Stifel | maintain | Buy | 2025-10-29 |
| JP Morgan | maintain | Overweight | 2025-10-29 |
| UBS | maintain | Buy | 2025-10-29 |
Which company has the best grades?
Danaher generally receives stronger recommendations, including multiple “Buy” and “Overweight” grades versus IQVIA’s mix of “Buy,” “Hold,” and fewer “Outperform” notes. This suggests Danaher is viewed more favorably, potentially influencing investors toward greater confidence and risk tolerance.
Risks specific to each company
The following categories identify the critical pressure points and systemic threats facing both firms in the 2026 market environment:
1. Market & Competition
Danaher Corporation
- Operates in diversified medical segments with strong life sciences presence; faces intense innovation-driven competition.
IQVIA Holdings Inc.
- Focuses on advanced analytics and clinical research; competition from tech disruptors and evolving healthcare data demands.
2. Capital Structure & Debt
Danaher Corporation
- Low debt-to-equity (0.35) with strong interest coverage (17x); conservative leverage supports financial stability.
IQVIA Holdings Inc.
- High debt-to-equity (2.33) and moderate interest coverage (3.5x) increase financial risk and refinancing vulnerability.
3. Stock Volatility
Danaher Corporation
- Beta near 0.93 indicates lower volatility than market; more stable investment profile.
IQVIA Holdings Inc.
- Beta of 1.37 reflects higher sensitivity to market swings; riskier equity profile.
4. Regulatory & Legal
Danaher Corporation
- Compliance demands in diagnostics and environmental sectors; risks tied to product approvals and healthcare regulations.
IQVIA Holdings Inc.
- Subject to complex clinical trial regulations and data privacy laws; legal challenges from evolving healthcare compliance.
5. Supply Chain & Operations
Danaher Corporation
- Global manufacturing footprint; supply chain disruptions could impact production and delivery timelines.
IQVIA Holdings Inc.
- Relies on data centers and clinical sites worldwide; operational continuity risk from tech infrastructure and partner dependencies.
6. ESG & Climate Transition
Danaher Corporation
- Faces scrutiny on environmental impact of manufacturing and product lifecycle; active in sustainable innovations.
IQVIA Holdings Inc.
- ESG risks mainly related to data privacy, ethical use of patient information, and carbon footprint of tech operations.
7. Geopolitical Exposure
Danaher Corporation
- Exposure to global markets including Asia and Europe; geopolitical tensions could affect supply and sales.
IQVIA Holdings Inc.
- Significant international presence with clinical trials and data services; geopolitical instability could disrupt operations.
Which company shows a better risk-adjusted profile?
Danaher’s strongest risk is market competition amid innovation cycles, yet its conservative leverage and stable stock volatility enhance resilience. IQVIA’s dominant risk lies in elevated debt and regulatory complexities, amplified by higher stock volatility. Danaher’s safer balance sheet and lower beta signal a superior risk-adjusted profile in 2026.
Final Verdict: Which stock to choose?
Danaher Corporation’s superpower lies in its robust operational efficiency and strong liquidity, which support resilience amid market volatility. However, its declining profitability and value destruction signal a point of vigilance. It fits well in portfolios targeting steady industrial exposure with a tolerance for cyclical headwinds.
IQVIA Holdings Inc. commands a strategic moat with its accelerating return on invested capital and superior equity returns. Its recurring revenue model provides relative safety compared to Danaher’s cyclical risks, appealing to investors favoring growth with an eye on financial stability despite leverage concerns.
If you prioritize operational strength and liquidity in a mature industrial leader, Danaher is the compelling choice due to its solid balance sheet and cash flow quality. However, if you seek growth powered by improving profitability and strategic market positioning, IQVIA offers better stability and a more attractive growth trajectory, albeit at higher financial risk.
Disclaimer: Investment carries a risk of loss of initial capital. The past performance is not a reliable indicator of future results. Be sure to understand risks before making an investment decision.
Go Further
I encourage you to read the complete analyses of Danaher Corporation and IQVIA Holdings Inc. to enhance your investment decisions: