Home > Comparison > Healthcare > DHR vs IDXX
The strategic rivalry between Danaher Corporation and IDEXX Laboratories defines the current trajectory of the healthcare diagnostics sector. Danaher operates as a diversified industrial powerhouse spanning life sciences, diagnostics, and environmental solutions. In contrast, IDEXX focuses on high-margin veterinary and water quality diagnostics. This analysis pits Danaher’s scale and breadth against IDEXX’s niche specialization to identify which offers the superior risk-adjusted outlook for a diversified portfolio.
Table of contents
Companies Overview
Danaher Corporation and IDEXX Laboratories, Inc. are pivotal players in medical diagnostics and research, shaping healthcare innovation globally.
Danaher Corporation: Diverse Diagnostic Powerhouse
Danaher dominates the medical diagnostics sector with a broad portfolio spanning Life Sciences, Diagnostics, and Environmental & Applied Solutions. Its core revenue comes from advanced instruments, consumables, and software used in hospitals, research institutions, and industrial markets. In 2026, Danaher emphasizes innovation in gene and cell therapy technologies and bioprocess solutions as strategic growth pillars.
IDEXX Laboratories, Inc.: Veterinary and Water Testing Specialist
IDEXX leads in veterinary diagnostics and water quality testing, generating revenue through point-of-care instruments, rapid assay kits, and veterinary software. Its strategic focus for 2026 centers on expanding animal health diagnostics and enhancing water contamination detection technologies. IDEXX leverages a niche expertise targeting companion animals, livestock, and environmental markets worldwide.
Strategic Collision: Similarities & Divergences
Both companies excel in diagnostic innovation but diverge in market approach: Danaher offers a diversified, global product suite across multiple healthcare segments, while IDEXX pursues specialized veterinary and water testing markets. Their primary battleground lies in diagnostic accuracy and technology adoption. Danaher’s broad scale contrasts with IDEXX’s focused specialization, creating distinct investment profiles grounded in scope versus niche dominance.
Income Statement Comparison
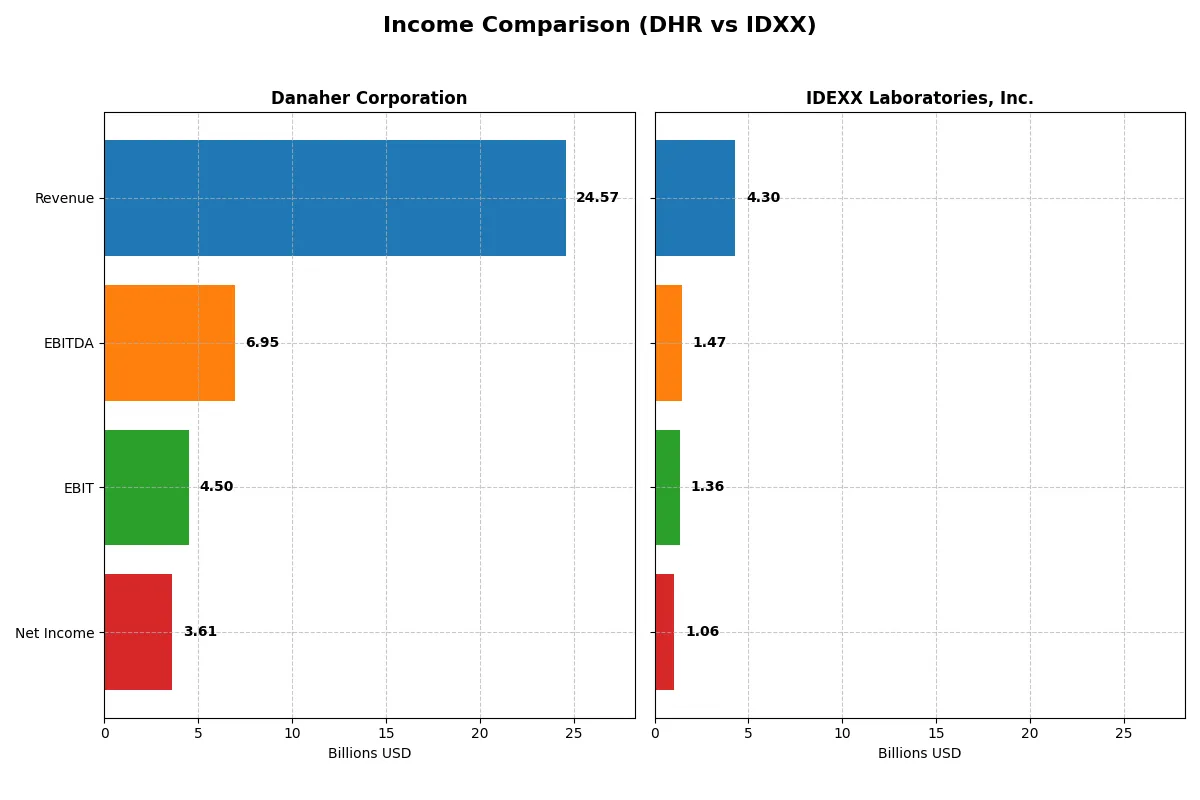
This data dissects the core profitability and scalability of both corporate engines to reveal who dominates the bottom line:
| Metric | Danaher Corporation (DHR) | IDEXX Laboratories, Inc. (IDXX) |
|---|---|---|
| Revenue | 24.6B | 4.3B |
| Cost of Revenue | 9.6B | 1.6B |
| Operating Expenses | 9.8B | 1.3B |
| Gross Profit | 15.0B | 2.7B |
| EBITDA | 6.9B | 1.5B |
| EBIT | 4.5B | 1.4B |
| Interest Expense | 265M | 38M |
| Net Income | 3.6B | 1.1B |
| EPS | 5.07 | 13.17 |
| Fiscal Year | 2025 | 2025 |
Income Statement Analysis: The Bottom-Line Duel
This income statement comparison reveals which company runs a more efficient and profitable corporate engine in 2025.
Danaher Corporation Analysis
Danaher’s revenue edged up slightly to $24.6B in 2025 but net income slid to $3.6B, marking a declining profit trend since 2021. Its gross margin remains strong at 60.9%, yet net margin dropped to 14.7%, signaling margin compression. Operating efficiency weakened, with EBIT falling 8.6% year-over-year, reflecting headwinds in cost control and profitability momentum.
IDEXX Laboratories, Inc. Analysis
IDEXX posted robust growth with 10.4% revenue expansion to $4.3B and net income rising 19.4% to $1.06B in 2025. Gross margin held firm at 61.8%, while net margin improved notably to 24.6%, doubling Danaher’s profitability rate. Operational leverage strengthened, as EBIT rose sharply, demonstrating effective cost management and accelerating earnings power.
Margin Strength vs. Growth Momentum
IDEXX outpaces Danaher both in revenue growth and margin expansion, showcasing a dynamic earnings trajectory. Danaher’s scale is impressive but marred by declining profitability and margin erosion. For investors, IDEXX’s profile offers superior operational efficiency and growth potential, making it the fundamentally stronger income statement performer in this comparison.
Financial Ratios Comparison
These vital ratios act as a diagnostic tool to expose the underlying fiscal health, valuation premiums, and capital efficiency of the companies analyzed below:
| Ratios | Danaher Corporation (DHR) | IDEXX Laboratories, Inc. (IDXX) |
|---|---|---|
| ROE | 6.9% | 66.0% |
| ROIC | 5.7% | 40.7% |
| P/E | 44.8 | 51.1 |
| P/B | 3.08 | 33.75 |
| Current Ratio | 1.87 | 1.23 |
| Quick Ratio | 1.51 | 0.90 |
| D/E | 0.35 | 0.05 |
| Debt-to-Assets | 22.1% | 2.2% |
| Interest Coverage | 19.4 | 35.5 |
| Asset Turnover | 0.29 | 1.28 |
| Fixed Asset Turnover | 4.44 | 5.76 |
| Payout Ratio | 24.3% | 0% |
| Dividend Yield | 0.54% | 0% |
| Fiscal Year | 2025 | 2025 |
Efficiency & Valuation Duel: The Vital Signs
Financial ratios serve as a company’s DNA, unveiling hidden risks and operational excellence that shape investor decisions.
Danaher Corporation
Danaher posts a modest ROE of 6.88% with a strong net margin of 14.71%, reflecting operational efficiency. However, its P/E ratio at 44.8 and P/B at 3.08 signal an expensive valuation. The company returns value via a small 0.54% dividend yield, balancing shareholder rewards with reinvestment in R&D (6.5% of revenue).
IDEXX Laboratories, Inc.
IDEXX shines with a robust ROE of 65.99% and a superior net margin of 24.62%, showcasing exceptional profitability. Its P/E of 51.15 and P/B at 33.75 mark a stretched valuation typical of high-growth firms. IDEXX does not pay dividends, instead plowing cash into growth and innovation, maintaining a low debt ratio of 0.05.
Premium Valuation vs. Operational Safety
Both companies show favorable overall ratios, but IDEXX’s higher ROE and margin come at a steep valuation premium. Danaher offers a more balanced risk profile with moderate profitability and shareholder dividends. Investors seeking growth may favor IDEXX; those valuing steadier operational metrics might prefer Danaher.
Which one offers the Superior Shareholder Reward?
I observe Danaher (DHR) pays a modest 0.54% dividend yield with a conservative 24% payout ratio, covering dividends comfortably through free cash flow (FCF). Danaher also executes steady buybacks, boosting total shareholder return sustainably. IDEXX (IDXX) skips dividends, reinvesting aggressively into R&D and growth, fueling superior profit margins and cash flow but trades at a rich 51x free cash flow multiple. Its limited buyback activity suggests focus on growth over immediate shareholder payback. For 2026, I favor Danaher’s balanced approach combining dividends and buybacks for durable, more predictable shareholder rewards compared to IDEXX’s high-growth, high-valuation risk profile.
Comparative Score Analysis: The Strategic Profile
The radar chart reveals the fundamental DNA and trade-offs of Danaher Corporation and IDEXX Laboratories, Inc., highlighting their distinct financial strengths and weaknesses:
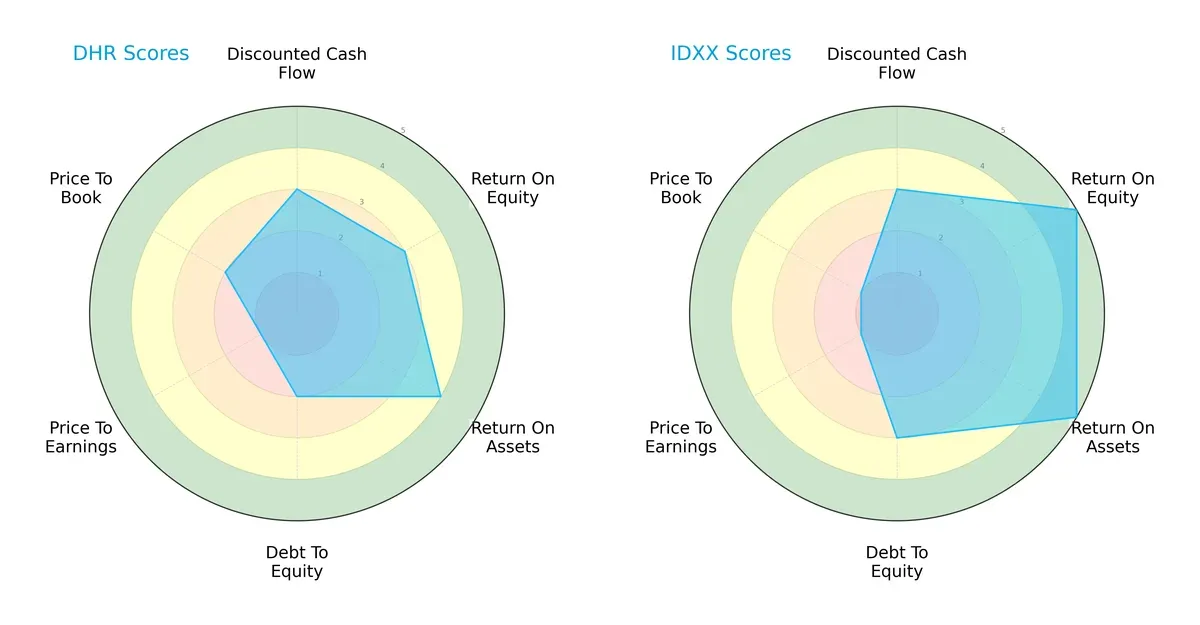
IDEXX stands out with superior ROE and ROA scores, reflecting efficient profit generation and asset utilization. Danaher shows a more favorable return on assets but struggles with higher debt and weaker valuation metrics. IDEXX’s profile is more balanced on profitability and leverage, while Danaher relies on asset efficiency but faces valuation headwinds.
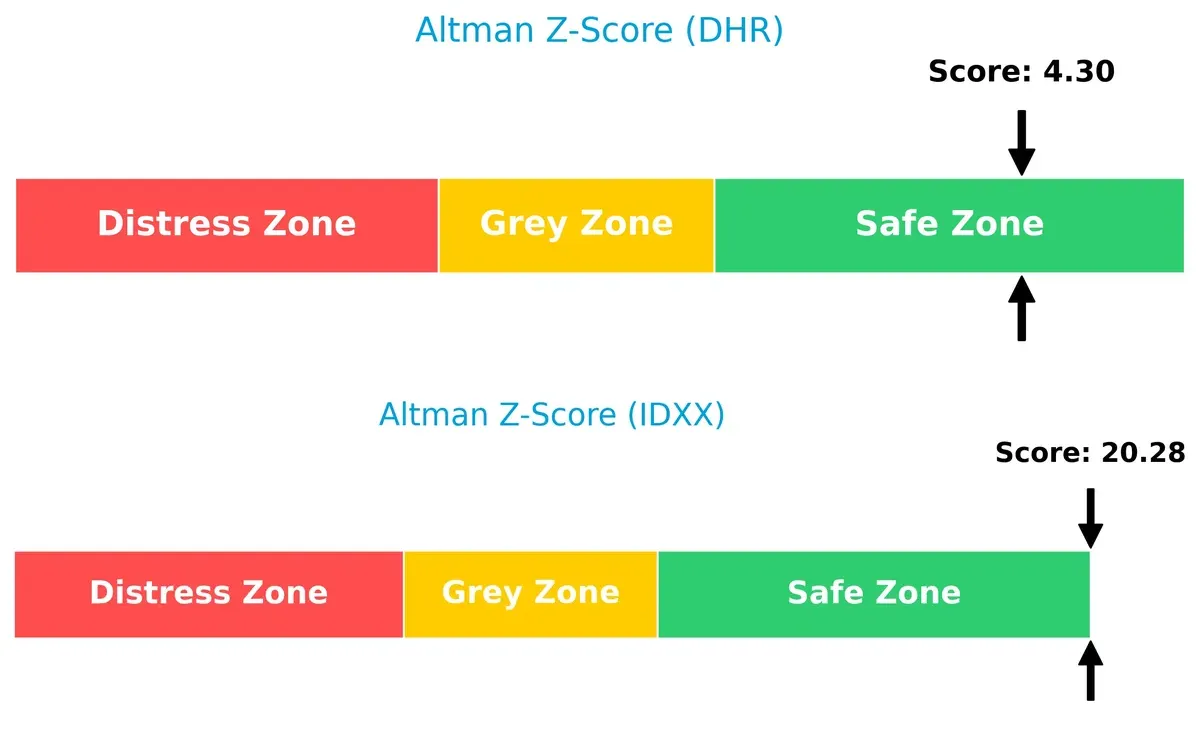
Bankruptcy Risk: Solvency Showdown
IDEXX’s Altman Z-Score far exceeds Danaher’s, signaling a stronger cushion against bankruptcy risk in this economic cycle:
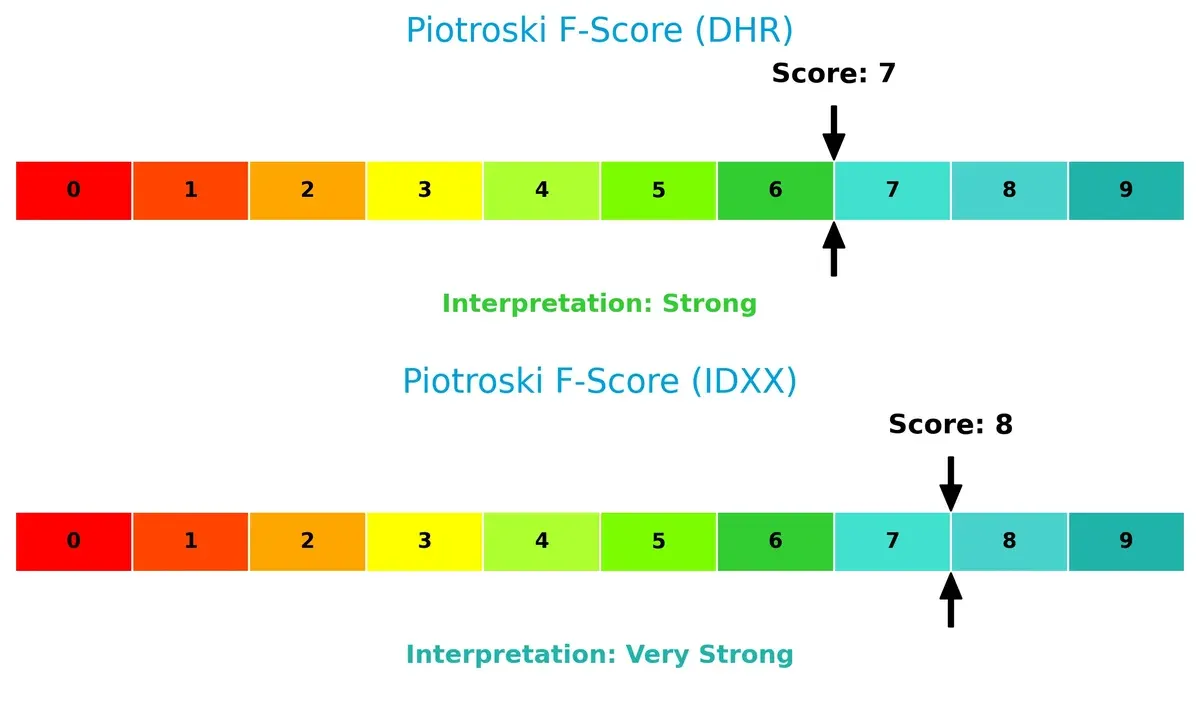
Financial Health: Quality of Operations
IDEXX’s Piotroski F-Score of 8 indicates very strong financial health, outperforming Danaher’s strong score of 7, which suggests slightly weaker internal financial controls and profitability:
How are the two companies positioned?
This section dissects Danaher and IDEXX’s operational DNA by comparing their revenue distribution and internal strengths and weaknesses. The goal is to confront their economic moats and identify which model offers the most resilient competitive advantage today.
Revenue Segmentation: The Strategic Mix
This visual comparison dissects how Danaher Corporation and IDEXX Laboratories diversify income streams and where their primary sector bets lie:
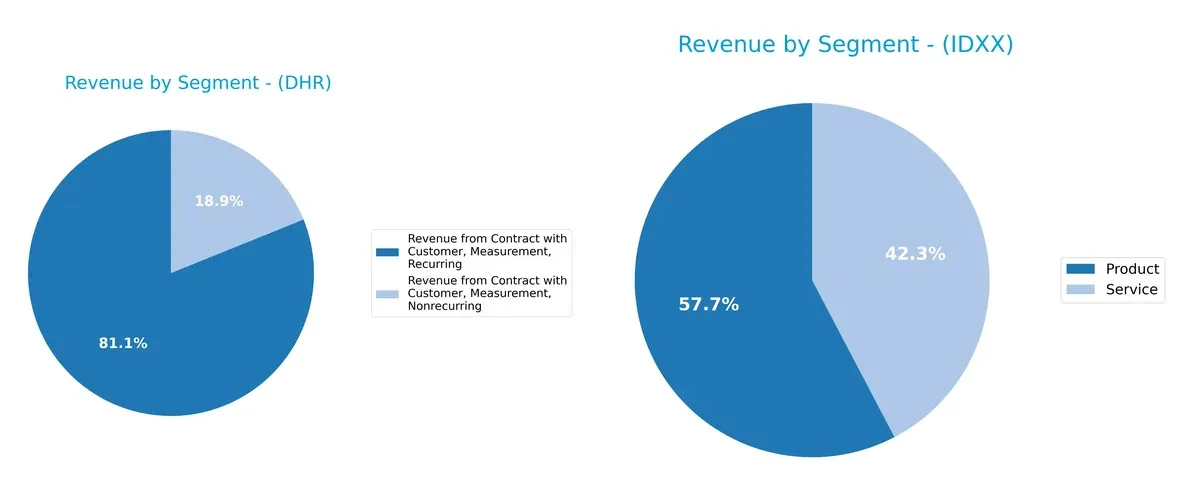
Danaher anchors its revenue in recurring measurement contracts totaling $19.4B in 2024, dwarfing its $4.5B nonrecurring segment. IDEXX displays a more balanced split, with $2.25B from products and $1.65B from services. Danaher’s concentration in recurring revenue signals strong ecosystem lock-in and stability. IDEXX’s diversification across product and service lines reduces concentration risk but offers less infrastructure dominance.
Strengths and Weaknesses Comparison
This table compares the Strengths and Weaknesses of Danaher Corporation and IDEXX Laboratories, Inc.:
Danaher Corporation Strengths
- Diversified revenue across Measurement, Dental, Diagnostics, and Life Sciences segments
- Favorable net margin at 14.7%
- Strong liquidity with current ratio 1.87 and quick ratio 1.51
- Low debt-to-assets ratio at 22.1% supports financial stability
- Global presence with significant revenue in North America, China, and developed markets
- Solid fixed asset turnover at 4.44 indicates efficient asset use
IDEXX Laboratories, Inc. Strengths
- High profitability with net margin 24.6% and ROE 66%
- Exceptional ROIC at 40.7%, well above WACC
- Very low debt-to-assets at 2.2%, minimal leverage risk
- Strong asset turnover at 1.28 and fixed asset turnover at 5.76
- Global footprint with dominant U.S. revenue and growing Asia Pacific and EMEA
- Recurring revenue from product and service streams supports resilience
Danaher Corporation Weaknesses
- ROE of 6.9% underperforms versus cost of capital
- Price-to-book 3.08 and PE 44.8 appear elevated
- Asset turnover low at 0.29, signaling underutilized assets
- Dividend yield low at 0.54%, less attractive for income investors
- Some revenue volatility in nonrecurring Measurement segment
- Moderate global exposure concentrated in developed markets
IDEXX Laboratories, Inc. Weaknesses
- High PE at 51.2 and very high PB at 33.75 indicate expensive valuation
- WACC at 11.5% exceeds ROIC, raising capital cost concerns
- Quick ratio 0.9 suggests weaker short-term liquidity
- No dividend yield may deter income-focused investors
- Smaller geographic diversification with heavy U.S. reliance
- Potential overvaluation risk given stretched multiples
Danaher exhibits balanced diversification and solid liquidity but faces challenges in asset efficiency and return on equity. IDEXX excels in profitability and capital efficiency but contends with elevated valuation multiples and limited liquidity buffers. Each company’s strengths and weaknesses reflect distinct strategic positions in their markets.
The Moat Duel: Analyzing Competitive Defensibility
A structural moat alone shields long-term profits from relentless competition and market disruption. Let’s dissect how Danaher and IDEXX secure their economic moats:
Danaher Corporation: Diversified Innovation Moat
Danaher’s moat stems from diversified life sciences and diagnostics innovation. Its historically high gross margins reflect strong product differentiation. However, declining ROIC since 2021 signals erosion risk if new markets or tech breakthroughs lag in 2026.
IDEXX Laboratories, Inc.: Specialized Diagnostic Network Moat
IDEXX leverages a specialized diagnostic network and veterinary software ecosystem. It commands superior EBIT and net margins, outperforming Danaher’s profitability. Despite a slight ROIC dip, IDEXX’s expanding companion animal market positions it well for growth and moat deepening.
Verdict: Diversified Innovation vs. Specialized Diagnostic Network
IDEXX holds a deeper moat, demonstrated by robust ROIC exceeding WACC by 29%, compared to Danaher’s value destruction. IDEXX’s focused niche and margin strength better defend market share against competitive threats in 2026.
Which stock offers better returns?
The stock prices of Danaher Corporation and IDEXX Laboratories, Inc. show contrasting trajectories over the past year, with significant shifts in momentum and trading patterns shaping their market profiles.
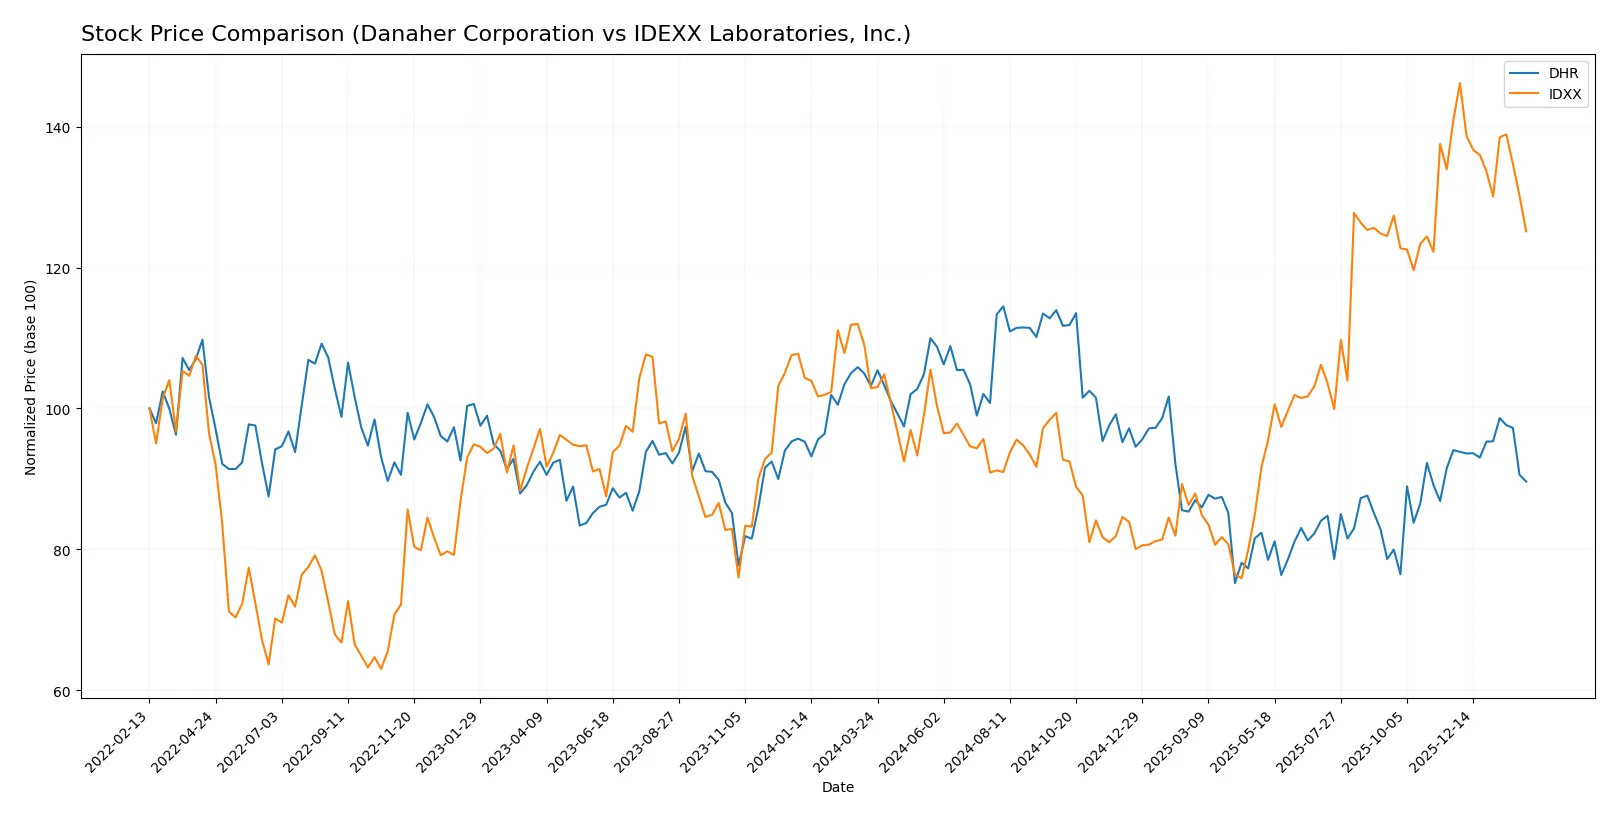
Trend Comparison
Danaher Corporation’s stock exhibits a bearish trend with a 13.15% decline over the past 12 months. The downtrend accelerated despite moderate volatility, marked by a high of 276.75 and a low of 181.77.
IDEXX Laboratories, Inc. recorded a bullish trend with a 21.68% gain over the same period. The uptrend decelerated amid high volatility, reaching a high of 752.88 and a low of 390.94.
IDEXX outperformed Danaher over the last year, delivering stronger market returns despite recent short-term weakness in both stocks.
Target Prices
Analysts maintain a bullish outlook on Danaher Corporation and IDEXX Laboratories, reflecting confidence in their growth trajectories.
| Company | Target Low | Target High | Consensus |
|---|---|---|---|
| Danaher Corporation | 220 | 270 | 252.33 |
| IDEXX Laboratories, Inc. | 730 | 830 | 789.29 |
Danaher’s consensus target of 252.33 suggests a 16.5% upside from its current 216.61 price. IDEXX’s target consensus at 789.29 implies a substantial 22.5% potential gain from 644.61.

Don’t Let Luck Decide Your Entry Point
Optimize your entry points with our advanced ProRealTime indicators. You’ll get efficient buy signals with precise price targets for maximum performance. Start outperforming now!
How do institutions grade them?
Danaher Corporation Grades
These are the latest institutional grades for Danaher Corporation:
| Grading Company | Action | New Grade | Date |
|---|---|---|---|
| JP Morgan | maintain | Overweight | 2026-01-29 |
| Jefferies | maintain | Buy | 2026-01-29 |
| TD Cowen | maintain | Buy | 2026-01-07 |
| Guggenheim | maintain | Buy | 2026-01-05 |
| Wells Fargo | maintain | Equal Weight | 2025-12-15 |
| Wells Fargo | maintain | Equal Weight | 2025-10-23 |
| Barclays | maintain | Overweight | 2025-10-22 |
| TD Cowen | maintain | Buy | 2025-10-22 |
| Rothschild & Co | downgrade | Neutral | 2025-10-08 |
| Evercore ISI Group | maintain | Outperform | 2025-10-07 |
IDEXX Laboratories, Inc. Grades
These are the latest institutional grades for IDEXX Laboratories, Inc.:
| Grading Company | Action | New Grade | Date |
|---|---|---|---|
| Barclays | maintain | Overweight | 2026-02-05 |
| BTIG | maintain | Buy | 2026-02-03 |
| UBS | maintain | Neutral | 2026-02-03 |
| UBS | maintain | Neutral | 2025-11-04 |
| JP Morgan | maintain | Overweight | 2025-11-04 |
| BTIG | maintain | Buy | 2025-11-04 |
| Morgan Stanley | maintain | Overweight | 2025-11-04 |
| Stifel | upgrade | Buy | 2025-10-31 |
| Morgan Stanley | maintain | Overweight | 2025-08-15 |
| Piper Sandler | maintain | Neutral | 2025-08-11 |
Which company has the best grades?
IDEXX Laboratories holds slightly stronger grades overall, with multiple firms maintaining or upgrading to Buy and Overweight ratings. Danaher shows solid Buy and Overweight grades but includes a recent downgrade, implying more mixed sentiment. This divergence could influence investor confidence and portfolio positioning.
Risks specific to each company
The following categories identify critical pressure points and systemic threats facing Danaher Corporation and IDEXX Laboratories in the 2026 market environment:
1. Market & Competition
Danaher Corporation
- Competes broadly in diversified medical diagnostics and life sciences; faces pressure from innovation and integrated solutions providers.
IDEXX Laboratories, Inc.
- Focuses on veterinary and water testing niches; competition intensifies with specialized diagnostic firms and emerging biotech startups.
2. Capital Structure & Debt
Danaher Corporation
- Maintains moderate leverage (D/E 0.35), strong interest coverage (16.97), signaling financial stability.
IDEXX Laboratories, Inc.
- Very low leverage (D/E 0.05), excellent interest coverage (35.61), indicating conservative capital structure and low financial risk.
3. Stock Volatility
Danaher Corporation
- Beta near 1 (0.958), implying stock price moves broadly in line with the market; lower volatility.
IDEXX Laboratories, Inc.
- Beta high (1.66), stock shows greater volatility, increasing risk for investors sensitive to market swings.
4. Regulatory & Legal
Danaher Corporation
- Operates globally with exposure to complex healthcare regulations across multiple segments, increasing compliance risks.
IDEXX Laboratories, Inc.
- Regulatory risk concentrated in veterinary and water testing sectors, with emerging scrutiny on diagnostic standards and animal health policies.
5. Supply Chain & Operations
Danaher Corporation
- Complex global supply chains across life sciences and diagnostics; vulnerable to disruptions affecting manufacturing and logistics.
IDEXX Laboratories, Inc.
- Smaller scale supply chain focused on veterinary and water testing products; potentially less diversified, increasing operational risk in case of disruption.
6. ESG & Climate Transition
Danaher Corporation
- Faces pressure to improve environmental footprint across manufacturing and water treatment; ESG initiatives increasingly material to investors.
IDEXX Laboratories, Inc.
- ESG focus on sustainable animal health products and water quality testing; climate transition risks moderate but growing in importance.
7. Geopolitical Exposure
Danaher Corporation
- Global footprint exposes it to geopolitical tensions, trade policies, and currency risks in multiple regions.
IDEXX Laboratories, Inc.
- Primarily US-based with international sales; less exposed but vulnerable to export regulations and trade barriers in key markets.
Which company shows a better risk-adjusted profile?
IDEXX Laboratories exhibits a superior risk-adjusted profile mainly due to its stronger financial health, higher profitability metrics, and very strong Piotroski score. Danaher’s broader diversification and moderate leverage provide resilience but entail higher complexity and regulatory exposure. IDEXX’s elevated stock volatility and valuation multiples remain caution points. The most impactful risk for Danaher is its regulatory and operational complexity amid global market pressures. For IDEXX, the main concern lies in its higher stock volatility and stretched valuation. IDEXX’s exceptionally high Altman Z-score and Piotroski score confirm robust financial strength, justifying its better risk-adjusted stance despite market price fluctuations.
Final Verdict: Which stock to choose?
Danaher Corporation’s superpower lies in its robust operational efficiency and resilient balance sheet. Despite its solid current ratio and manageable debt, its declining profitability and value destruction signal a point of vigilance. It fits portfolios targeting steady industrial exposure with a tolerance for cyclical downturns.
IDEXX Laboratories commands a strategic moat through its high return on invested capital and recurring revenue streams in veterinary diagnostics. Its safety profile surpasses Danaher’s, supported by strong profitability and conservative leverage. It suits investors pursuing growth at a reasonable price with a focus on innovation-led stability.
If you prioritize operational resilience and industrial diversification, Danaher appears compelling despite current profitability challenges. However, if you seek superior profitability and a defensible moat in a high-growth niche, IDEXX offers better stability and value creation, commanding a premium for its growth profile.
Disclaimer: Investment carries a risk of loss of initial capital. The past performance is not a reliable indicator of future results. Be sure to understand risks before making an investment decision.
Go Further
I encourage you to read the complete analyses of Danaher Corporation and IDEXX Laboratories, Inc. to enhance your investment decisions: