Home > Comparison > Technology > WDC vs QBTS
The strategic rivalry between Western Digital Corporation and D-Wave Quantum Inc. shapes the evolution of the computer hardware sector. Western Digital operates as a capital-intensive data storage solutions provider, while D-Wave pioneers quantum computing systems and software. This contrast highlights a battle between established industrial scale and cutting-edge technological innovation. This analysis will clarify which trajectory offers superior risk-adjusted returns for a diversified portfolio navigating the technology landscape.
Table of contents
Companies Overview
Western Digital Corporation and D-Wave Quantum Inc. stand at the forefront of the evolving computer hardware landscape.
Western Digital Corporation: Data Storage Powerhouse
Western Digital dominates the data storage market with a diverse portfolio of HDDs, SSDs, and flash memory products. Its revenue stems from selling storage solutions to PCs, data centers, and consumer electronics globally. In 2026, the company focuses on expanding enterprise storage and tiered data solutions, reinforcing its competitive edge in high-capacity and performance-driven storage technologies.
D-Wave Quantum Inc.: Quantum Computing Innovator
D-Wave Quantum leads in quantum computing systems and services, offering advanced quantum hardware and cloud-accessible platforms. Its revenues come from selling quantum computers, software suites, and professional onboarding services worldwide. The company’s 2026 strategy emphasizes broadening application reach in AI, cybersecurity, and financial modeling through hybrid and cloud-based quantum solutions.
Strategic Collision: Similarities & Divergences
Western Digital and D-Wave pursue distinct tech frontiers: traditional data storage versus emerging quantum computing. Western Digital champions a hardware-centric storage ecosystem, while D-Wave promotes an open, service-oriented quantum platform. Their primary battleground overlaps in enterprise technology adoption. Investors face contrasting profiles: Western Digital offers scale and established cash flow; D-Wave carries growth potential amid quantum computing’s nascent stage.
Income Statement Comparison
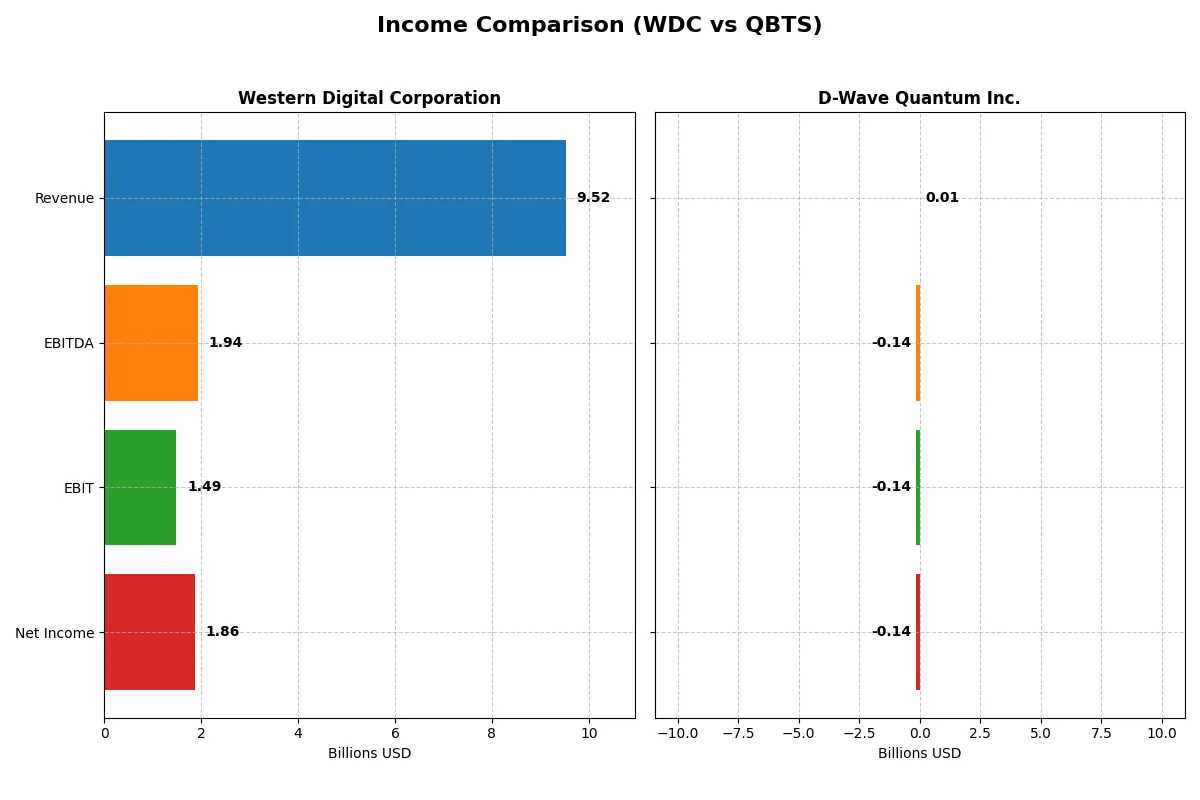
This data dissects the core profitability and scalability of both corporate engines to reveal who dominates the bottom line:
| Metric | Western Digital Corporation (WDC) | D-Wave Quantum Inc. (QBTS) |
|---|---|---|
| Revenue | 9.52B | 8.83M |
| Cost of Revenue | 5.83B | 3.26M |
| Operating Expenses | 1.36B | 82.79M |
| Gross Profit | 3.69B | 5.56M |
| EBITDA | 1.94B | -138.05M |
| EBIT | 1.49B | -140.0M |
| Interest Expense | 357M | 3.90M |
| Net Income | 1.86B | -143.88M |
| EPS | 5.31 | -0.75 |
| Fiscal Year | 2025 | 2024 |
Income Statement Analysis: The Bottom-Line Duel
This income statement comparison reveals which company operates a more efficient and profitable business engine amid their distinct market challenges.
Western Digital Corporation Analysis
Western Digital’s revenue declined overall from 17B in 2021 to 9.5B in 2025 but surged 51% from 2024 to 2025. Net income swung from losses in 2023-24 to a robust 1.86B in 2025. Gross margins improved to 38.8% in 2025, while net margins reached a healthy 19.6%, signaling strong recent profitability and operational momentum.
D-Wave Quantum Inc. Analysis
D-Wave’s revenue steadily increased from 5.2M in 2020 to 8.8M in 2024, a 71% rise over five years but flat growth last year. Despite a solid 63% gross margin in 2024, the company posted heavy operating losses, with net margins deep in the red at -1630%. Losses widened recently, reflecting ongoing investment and limited near-term profitability.
Margin Power vs. Revenue Scale
Western Digital combines scale with improving profitability, reversing prior losses to deliver strong positive margins and earnings growth. D-Wave shows promising top-line growth and gross margin strength but suffers from steep net losses and negative margins. For investors prioritizing earnings efficiency and margin recovery, Western Digital’s profile proves more compelling.
Financial Ratios Comparison
These vital ratios act as a diagnostic tool to expose the underlying fiscal health, valuation premiums, and capital efficiency of the companies compared:
| Ratios | Western Digital Corporation (WDC) | D-Wave Quantum Inc. (QBTS) |
|---|---|---|
| ROE | 35.0% (2025) | -229.7% (2024) |
| ROIC | 21.5% (2025) | -45.0% (2024) |
| P/E | 11.8 (2025) | -11.2 (2024) |
| P/B | 4.14 (2025) | 25.8 (2024) |
| Current Ratio | 1.08 (2025) | 6.14 (2024) |
| Quick Ratio | 0.84 (2025) | 6.08 (2024) |
| D/E (Debt-to-Equity) | 0.96 (2025) | 0.61 (2024) |
| Debt-to-Assets | 36.3% (2025) | 19.2% (2024) |
| Interest Coverage | 6.54 (2025) | -19.8 (2024) |
| Asset Turnover | 0.68 (2025) | 0.04 (2024) |
| Fixed Asset Turnover | 4.06 (2025) | 0.77 (2024) |
| Payout Ratio | 2.36% (2025) | 0% (2024) |
| Dividend Yield | 0.20% (2025) | 0% (2024) |
| Fiscal Year | 2025 | 2024 |
Efficiency & Valuation Duel: The Vital Signs
Financial ratios act as the company’s DNA, revealing hidden risks and operational excellence behind headline numbers.
Western Digital Corporation
Western Digital displays strong profitability with a 35% ROE and a favorable 19.55% net margin, signaling efficient capital use. Its P/E of 11.8 marks the stock as reasonably priced, though a 4.14 P/B ratio appears stretched. The company returns value modestly with a 0.2% dividend yield, focusing on reinvestment in R&D at 10.4% of revenue.
D-Wave Quantum Inc.
D-Wave Quantum suffers from severe profitability issues, posting a negative 229.7% ROE and a -1630% net margin, indicating deep operational challenges. Its P/E is negative but flagged favorable due to the formula, while the P/B of 25.76 is sharply stretched. The firm offers no dividend, heavily investing in R&D at nearly 4x revenue, reflecting a growth-oriented but risky profile.
Premium Valuation vs. Operational Safety
Western Digital balances solid profitability and fair valuation, offering a more stable risk-reward tradeoff. D-Wave Quantum exhibits extreme losses and stretched valuation, posing significant risks but potential high growth. Investors with tolerance for volatility may favor D-Wave; those prioritizing safety and steady returns may lean toward Western Digital.
Which one offers the Superior Shareholder Reward?
Western Digital Corporation (WDC) offers a modest dividend yield of 0.20% with a very low payout ratio of 2.36%, indicating strong free cash flow coverage. WDC also pursues share buybacks, adding to total shareholder return. In contrast, D-Wave Quantum Inc. (QBTS) pays no dividends and burns cash with negative margins, relying entirely on reinvestment for growth. QBTS’s lack of distributions and high valuation multiples reflect high risk and speculative positioning. Historically in tech hardware, steady dividends with buybacks like WDC’s model provide more sustainable long-term value. I see WDC as the superior shareholder reward in 2026 due to its balanced yield, buybacks, and cash flow strength.
Comparative Score Analysis: The Strategic Profile
The radar chart reveals the fundamental DNA and trade-offs of Western Digital Corporation and D-Wave Quantum Inc., highlighting their strategic financial strengths and weaknesses:
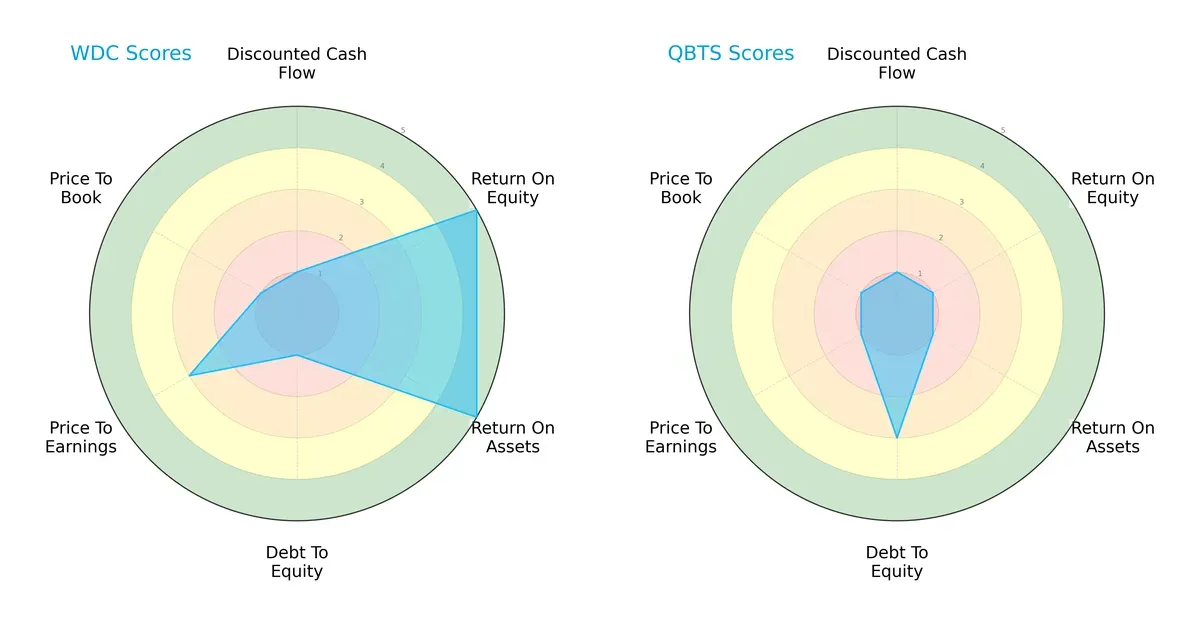
Western Digital exhibits a balanced profile with strong ROE and ROA scores (5 each), signaling efficient profit generation and asset utilization. However, its low debt-to-equity (1) and price-to-book (1) scores indicate financial leverage concerns and possible undervaluation risks. D-Wave Quantum relies on moderate debt management (3) but scores very low across profitability and valuation metrics, reflecting a heavy reliance on capital structure rather than operational efficiency.
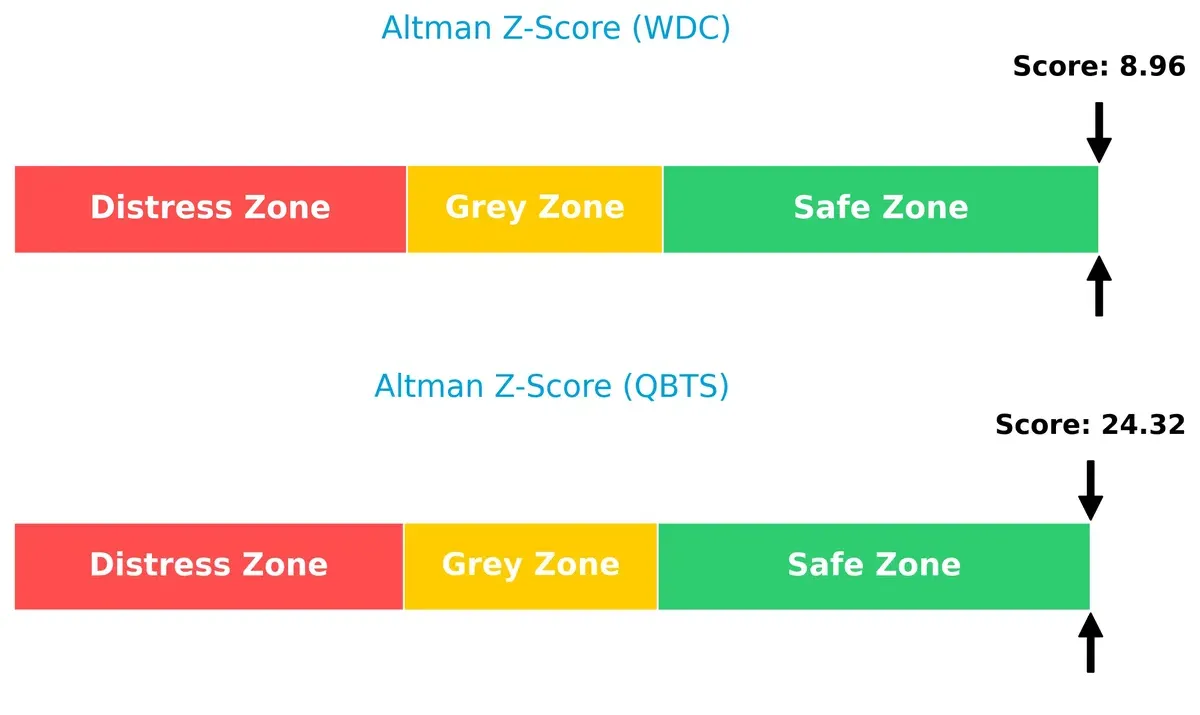
Bankruptcy Risk: Solvency Showdown
Western Digital’s Altman Z-Score of 8.96 versus D-Wave Quantum’s 24.32 places both firms safely above distress levels, but D-Wave Quantum’s score signals exceptional solvency and low bankruptcy risk in this cycle:
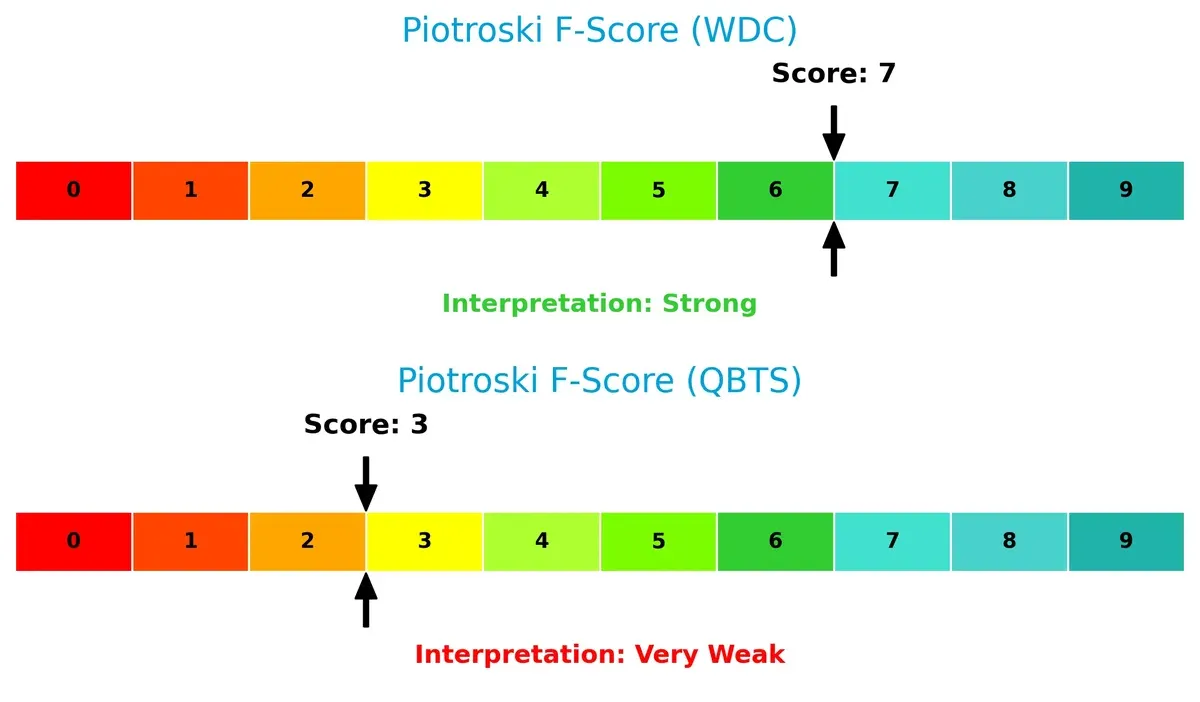
Financial Health: Quality of Operations
Western Digital’s Piotroski F-Score of 7 indicates strong financial health, while D-Wave Quantum’s score of 3 raises red flags about operational quality and internal metrics, suggesting caution:
How are the two companies positioned?
This section dissects the operational DNA of Western Digital and D-Wave Quantum by comparing their revenue distribution and internal dynamics. The goal is to confront their economic moats and identify which model offers the most resilient advantage today.
Revenue Segmentation: The Strategic Mix
This comparison dissects how Western Digital Corporation and D-Wave Quantum Inc. diversify their revenue streams and where their primary sector bets lie:
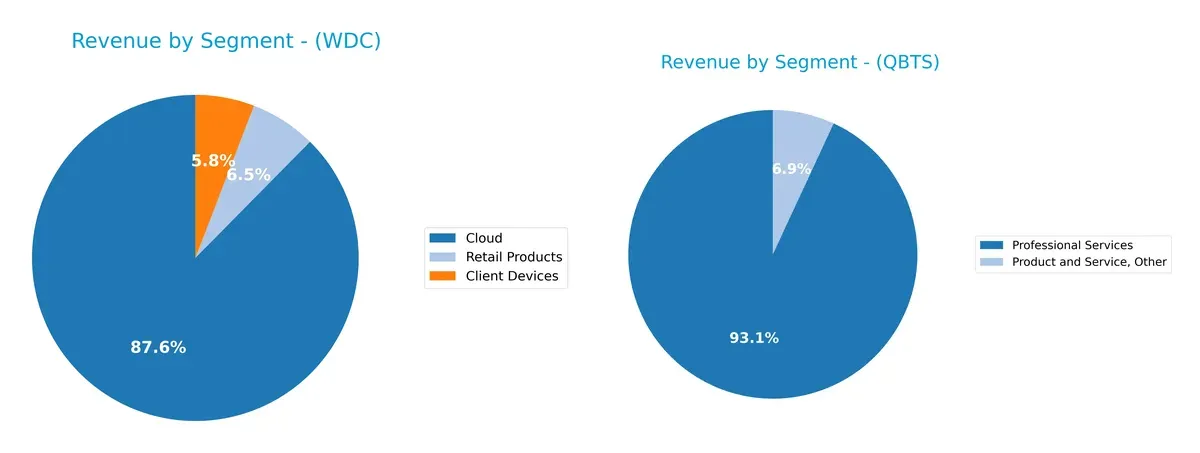
Western Digital dwarfs D-Wave with a broad mix, anchoring $8.3B in Cloud, $556M in Client Devices, and $623M in Retail Products for 2025. D-Wave relies heavily on Professional Services, generating $1.9M versus only $144K from other products. Western Digital’s diversification reflects infrastructure dominance, reducing concentration risk. Meanwhile, D-Wave’s narrow focus intensifies risk but targets specialized quantum service niches.
Strengths and Weaknesses Comparison
This table compares the Strengths and Weaknesses of Western Digital Corporation (WDC) and D-Wave Quantum Inc. (QBTS):
WDC Strengths
- Strong profitability with 19.55% net margin and 35.04% ROE
- Favorable ROIC of 21.53% above WACC
- Diverse revenue from Cloud, Client Devices, and Retail segments
- Significant global presence across Americas, Asia, and EMEA
- Favorable fixed asset turnover at 4.06
QBTS Strengths
- Favorable quick ratio of 6.08 indicates strong short-term liquidity
- Lower debt to assets ratio at 19.2% signals conservative leverage
- Growing professional services revenue stream
- Presence in multiple geographic markets including U.S., Germany, and Japan
- Positive P/E ratio despite negative earnings
WDC Weaknesses
- WACC at 12.21% outpaces ROIC, signaling capital cost challenges
- Unfavorable P/B ratio at 4.14 suggests valuation concerns
- Neutral current and quick ratios indicate tight liquidity
- Low dividend yield of 0.2% limits income appeal
- Moderate debt-to-equity ratio near 1.0 poses financial risk
QBTS Weaknesses
- Severely negative net margin (-1630%) and ROE (-230%) reflect unprofitability
- Negative ROIC (-45%) below WACC
- Unfavorable current ratio at 6.14 may mask inefficiency
- Very low asset turnover (0.04) and fixed asset turnover (0.77)
- Negative interest coverage ratio (-35.92) signals distress
- High P/B ratio at 25.76 implies overvaluation risk
- Zero dividend yield offers no income
Western Digital’s strengths lie in its robust profitability, diversified revenue streams, and global footprint, though it faces capital cost and valuation pressures. D-Wave Quantum shows liquidity and low leverage strengths but struggles with profitability, asset utilization, and financial health, challenging its path to sustainable growth.
The Moat Duel: Analyzing Competitive Defensibility
A structural moat is the only thing protecting long-term profits from the erosion of competition. Let’s examine how Western Digital and D-Wave Quantum defend their turf:
Western Digital Corporation: Cost Advantage Moat
Western Digital leverages scale and manufacturing efficiency to maintain a cost advantage. Its stable 15.6% EBIT margin and rising ROIC confirm deep profitability. Expansion in data center SSDs could deepen this moat in 2026.
D-Wave Quantum Inc.: Intangible Assets Moat
D-Wave’s moat stems from cutting-edge quantum technology and software ecosystem, unlike Western Digital’s cost edge. Despite negative margins, its growing ROIC trend hints at emerging value. Quantum computing adoption could disrupt markets ahead.
Cost Leadership vs. Quantum Innovation: The Moat Battle
Western Digital boasts a wider, more proven moat with strong value creation and margin stability. D-Wave shows promise but currently sheds value, making Western Digital better equipped to defend its market share in the near term.
Which stock offers better returns?
The past year shows starkly contrasting trajectories for Western Digital Corporation and D-Wave Quantum Inc., with WDC accelerating sharply and QBTS losing recent momentum.
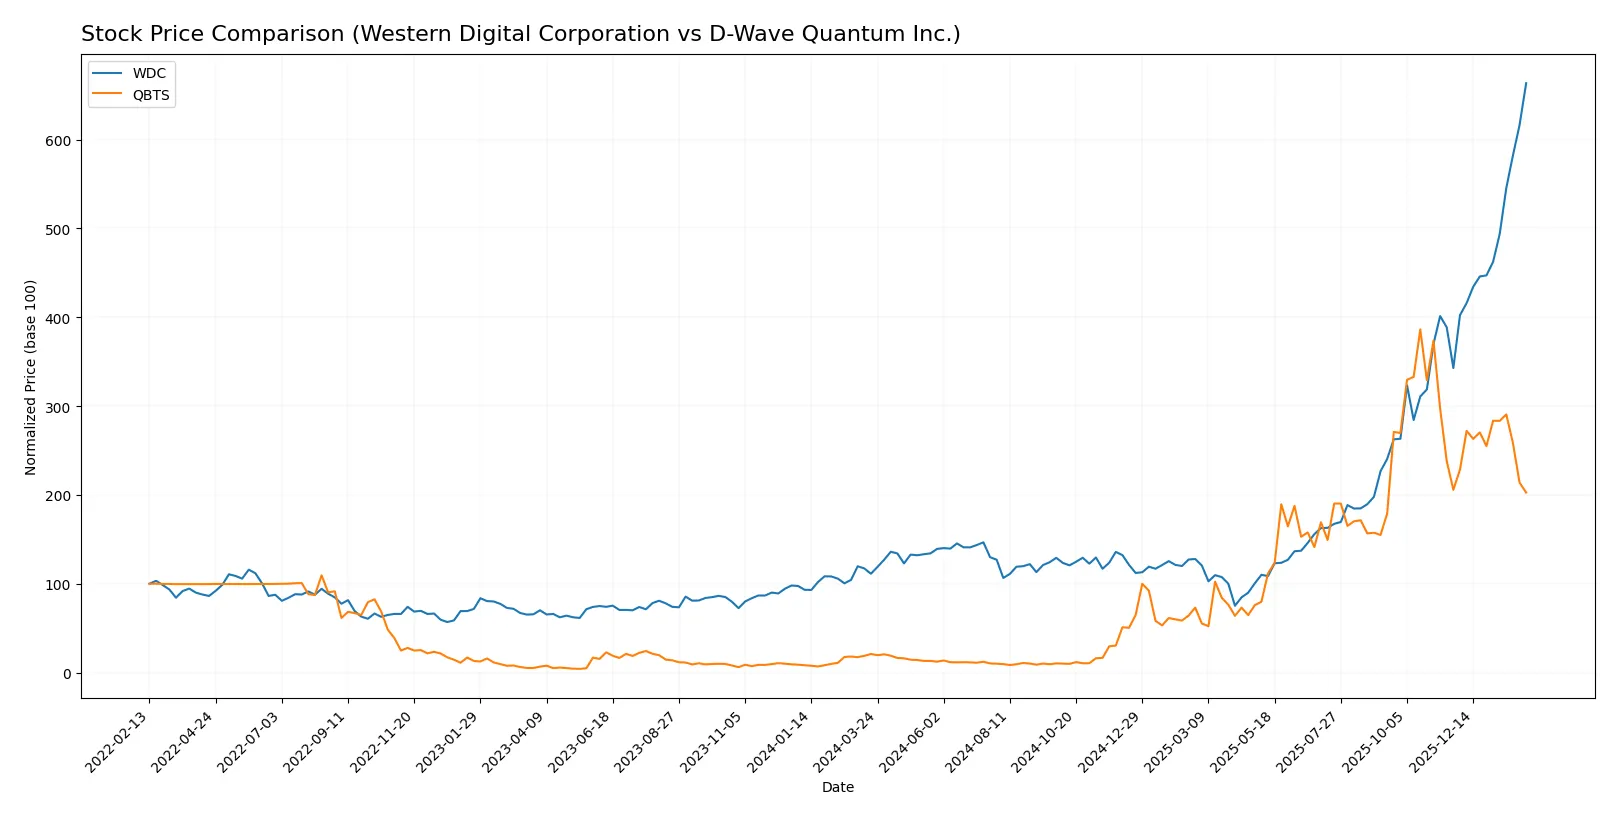
Trend Comparison
Western Digital Corporation’s stock surged 496.3% over the past 12 months, exhibiting a bullish trend with accelerating gains and significant volatility, hitting a high of 269.41 and a low of 30.54.
D-Wave Quantum Inc.’s stock rose 866.83% overall during the year, indicating a bullish trend but with decelerating momentum recently; its price fluctuated between 0.84 and 38.33, showing much lower volatility.
Comparing the two, QBTS posted the highest annual return but showed recent weakness, while WDC maintained accelerating growth and stronger buyer dominance.
Target Prices
Analysts present a cautiously optimistic consensus on target prices for Western Digital Corporation and D-Wave Quantum Inc.
| Company | Target Low | Target High | Consensus |
|---|---|---|---|
| Western Digital Corporation | 205 | 340 | 285.92 |
| D-Wave Quantum Inc. | 35 | 46 | 41 |
Western Digital’s consensus target of 286 exceeds its current price of 269, suggesting moderate upside. D-Wave’s target at 41 doubles its present 20, indicating strong growth expectations despite recent volatility.

Don’t Let Luck Decide Your Entry Point
Optimize your entry points with our advanced ProRealTime indicators. You’ll get efficient buy signals with precise price targets for maximum performance. Start outperforming now!
How do institutions grade them?
Western Digital Corporation Grades
The following table summarizes recent institutional grades for Western Digital Corporation:
| Grading Company | Action | New Grade | Date |
|---|---|---|---|
| Citigroup | Maintain | Buy | 2026-02-02 |
| Barclays | Maintain | Overweight | 2026-02-02 |
| Cantor Fitzgerald | Maintain | Overweight | 2026-01-30 |
| Wells Fargo | Maintain | Overweight | 2026-01-30 |
| Goldman Sachs | Maintain | Neutral | 2026-01-30 |
| Morgan Stanley | Maintain | Overweight | 2026-01-30 |
| TD Cowen | Maintain | Buy | 2026-01-30 |
| Wedbush | Maintain | Outperform | 2026-01-30 |
| Mizuho | Maintain | Outperform | 2026-01-27 |
| Morgan Stanley | Maintain | Overweight | 2026-01-22 |
D-Wave Quantum Inc. Grades
The following table summarizes recent institutional grades for D-Wave Quantum Inc.:
| Grading Company | Action | New Grade | Date |
|---|---|---|---|
| Needham | Maintain | Buy | 2026-01-29 |
| Rosenblatt | Maintain | Buy | 2026-01-28 |
| Benchmark | Maintain | Buy | 2026-01-23 |
| Needham | Maintain | Buy | 2026-01-22 |
| Rosenblatt | Maintain | Buy | 2026-01-08 |
| Rosenblatt | Maintain | Buy | 2026-01-07 |
| Benchmark | Maintain | Buy | 2025-11-10 |
| Rosenblatt | Maintain | Buy | 2025-11-07 |
| Canaccord Genuity | Maintain | Buy | 2025-11-07 |
| Cantor Fitzgerald | Maintain | Overweight | 2025-11-07 |
Which company has the best grades?
Western Digital shows a mix of Buy, Overweight, and Outperform ratings, indicating moderate optimism. D-Wave Quantum predominantly receives Buy ratings, suggesting stronger consensus enthusiasm. These grade differences may influence investor confidence and perceived risk.
Risks specific to each company
The following categories identify the critical pressure points and systemic threats facing both firms in the 2026 market environment:
1. Market & Competition
Western Digital Corporation
- Established leader in data storage with broad product range faces intense competition from SSD innovators and cloud storage providers.
D-Wave Quantum Inc.
- Niche quantum computing market with high growth potential but intense technological uncertainty and competition from larger tech firms.
2. Capital Structure & Debt
Western Digital Corporation
- Moderate debt-to-assets at 36%, interest coverage of 4.17x signals manageable leverage but watch for rising borrowing costs.
D-Wave Quantum Inc.
- Lower debt ratio at 19%, but negative interest coverage (-35.92) indicates cash burn and difficulty servicing debt.
3. Stock Volatility
Western Digital Corporation
- Beta of 1.84 shows above-market volatility; price range wide but company size buffers shocks.
D-Wave Quantum Inc.
- Beta 1.57 reflects high volatility; smaller market cap and speculative nature increase price swings risk.
4. Regulatory & Legal
Western Digital Corporation
- Operates globally with exposure to data privacy and antitrust regulations; historical sector scrutiny.
D-Wave Quantum Inc.
- Emerging tech sector faces evolving regulatory frameworks, especially around quantum encryption and export controls.
5. Supply Chain & Operations
Western Digital Corporation
- Complex global supply chains vulnerable to chip shortages and geopolitical tensions impacting hardware production.
D-Wave Quantum Inc.
- Smaller scale operations but dependent on specialized materials and advanced manufacturing tech with limited suppliers.
6. ESG & Climate Transition
Western Digital Corporation
- Large manufacturing footprint requires significant ESG compliance; pressure to reduce energy intensity in data centers.
D-Wave Quantum Inc.
- Quantum computing’s lower energy use offers ESG edge; however, sustainability practices are less mature than incumbents.
7. Geopolitical Exposure
Western Digital Corporation
- Extensive international sales and manufacturing expose WDC to US-China tensions and trade restrictions.
D-Wave Quantum Inc.
- Based in Canada with global clients; less exposed to direct geopolitical risks but sensitive to US export controls on quantum tech.
Which company shows a better risk-adjusted profile?
Western Digital’s key risk is its exposure to intense market competition and geopolitical tensions that could squeeze margins. D-Wave Quantum faces severe financial distress risks, reflected in negative profitability and weak interest coverage, stemming from its early-stage market and high cash burn. Despite WDC’s moderate leverage and volatility, its robust ROIC (21.5%) versus WACC (12.2%) signals value creation. Conversely, QBTS’s negative returns and unfavorable financial ratios highlight a fragile balance sheet. I see Western Digital offering a distinctly better risk-adjusted profile, reinforced by its strong Altman Z-Score of 8.96 versus QBTS’s 24.3 but with vastly superior profitability and operational scale.
Final Verdict: Which stock to choose?
Western Digital Corporation’s superpower lies in its robust value creation and operational efficiency. It consistently generates returns well above its cost of capital, signaling a strong economic moat. A point of vigilance remains its modest liquidity ratios, which could challenge short-term flexibility. This stock suits portfolios aiming for steady, value-driven growth with moderate risk tolerance.
D-Wave Quantum Inc. offers a strategic moat rooted in pioneering quantum computing technology, potentially disrupting multiple sectors. Its financials show early-stage volatility and value erosion, yet it maintains a strong liquidity position relative to Western Digital. This makes it a fit for investors with a higher risk appetite, targeting speculative growth and technological innovation exposure.
If you prioritize proven value creation and operational stability, Western Digital outshines as the compelling choice due to its sustainable competitive advantage and improving profitability. However, if you seek exposure to frontier technology with potential high-reward upside, D-Wave Quantum offers superior thematic growth prospects, albeit with greater financial uncertainty and risk.
Disclaimer: Investment carries a risk of loss of initial capital. The past performance is not a reliable indicator of future results. Be sure to understand risks before making an investment decision.
Go Further
I encourage you to read the complete analyses of Western Digital Corporation and D-Wave Quantum Inc. to enhance your investment decisions: