Home > Comparison > Technology > SMCI vs QBTS
The strategic rivalry between Super Micro Computer, Inc. and D-Wave Quantum Inc. shapes the evolving landscape of the Technology sector. Super Micro operates as a capital-intensive leader in high-performance server hardware, while D-Wave focuses on cutting-edge quantum computing solutions with a leaner operational model. This analysis pits traditional infrastructure against pioneering innovation to identify which trajectory delivers superior risk-adjusted returns for a diversified portfolio in 2026.
Table of contents
Companies Overview
Super Micro Computer and D-Wave Quantum each hold unique roles in the evolving computer hardware landscape. Their contrasting approaches reflect distinct technological frontiers driving growth.
Super Micro Computer, Inc.: Modular Performance Leader
Super Micro Computer dominates as a developer and manufacturer of high-performance server and storage solutions. It generates revenue by selling modular, open-architecture servers and software management tools to enterprise data centers, cloud, AI, and 5G markets. In 2026, its strategic focus remains on expanding application-optimized systems and enhancing customer support services worldwide.
D-Wave Quantum Inc.: Pioneer of Quantum Computing
D-Wave Quantum leads in commercial quantum computing systems and services. Its revenue stems from advanced quantum computers like Advantage, cloud-based access platforms, and professional onboarding services. The company concentrates on broadening quantum adoption across AI, materials science, and financial modeling sectors, pushing innovation in 2026 with open-source tools and hybrid solvers.
Strategic Collision: Similarities & Divergences
Super Micro’s open modular architecture contrasts with D-Wave’s cutting-edge quantum ecosystem. Both compete in technology infrastructure but target vastly different market frontiers—traditional high-performance computing versus quantum innovation. Their investment profiles diverge sharply: Super Micro offers scale and stability, while D-Wave presents higher risk with transformative potential.
Income Statement Comparison
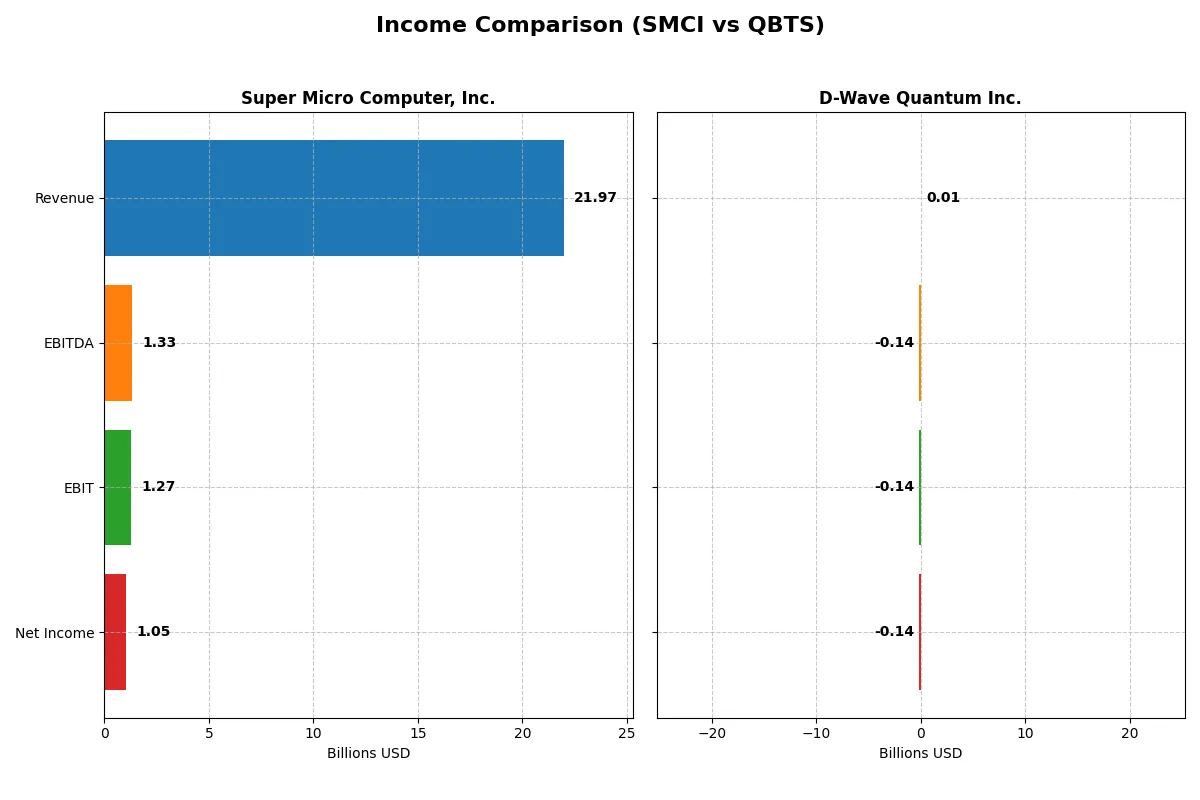
This data dissects the core profitability and scalability of both corporate engines to reveal who dominates the bottom line:
| Metric | Super Micro Computer, Inc. (SMCI) | D-Wave Quantum Inc. (QBTS) |
|---|---|---|
| Revenue | 21.97B | 8.83M |
| Cost of Revenue | 19.54B | 3.26M |
| Operating Expenses | 1.18B | 82.79M |
| Gross Profit | 2.43B | 5.56M |
| EBITDA | 1.33B | -138.05M |
| EBIT | 1.27B | -139.98M |
| Interest Expense | 59.57M | 3.90M |
| Net Income | 1.05B | -143.88M |
| EPS | 1.77 | -0.75 |
| Fiscal Year | 2025 | 2024 |
Income Statement Analysis: The Bottom-Line Duel
This income statement comparison reveals how two distinct corporate engines translate revenue into profit and operational efficiency.
Super Micro Computer, Inc. Analysis
Super Micro’s revenue surged from 3.6B in 2021 to 21.9B in 2025, with net income expanding from 112M to 1.05B. Gross margin holds steady around 11%, while net margin remains modest near 4.8%. The latest year shows strong revenue growth (+47%) but a slight dip in net margin, signaling operational scale gains offset by margin pressure.
D-Wave Quantum Inc. Analysis
D-Wave’s revenue grew moderately from 5.2M in 2020 to 8.8M in 2024, but net income stays deeply negative, widening to -144M in 2024. Gross margin is robust at 63%, yet EBIT and net margins are heavily negative, reflecting high R&D and operating expenses. The latest year shows flat revenue growth with worsening bottom-line losses and deteriorating earnings per share.
Margin Efficiency vs. Growth Trajectory
Super Micro delivers clear fundamental strength through accelerating revenue and improving net income, sustaining positive margins despite rapid growth. Conversely, D-Wave exhibits strong gross margins but struggles with high costs driving persistent losses and negative net margins. For investors prioritizing profitability and margin sustainability, Super Micro’s profile currently stands as the more attractive and financially sound option.
Financial Ratios Comparison
These vital ratios act as a diagnostic tool to expose the underlying fiscal health, valuation premiums, and capital efficiency of the companies compared below:
| Ratios | Super Micro Computer, Inc. (SMCI) | D-Wave Quantum Inc. (QBTS) |
|---|---|---|
| ROE | 16.6% | -229.7% |
| ROIC | 9.3% | -45.0% |
| P/E | 27.7 | -11.2 |
| P/B | 4.62 | 25.76 |
| Current Ratio | 5.25 | 6.14 |
| Quick Ratio | 3.25 | 6.08 |
| D/E | 0.76 | 0.61 |
| Debt-to-Assets | 34.1% | 19.2% |
| Interest Coverage | 21.0 | -19.8 |
| Asset Turnover | 1.57 | 0.044 |
| Fixed Asset Turnover | 27.53 | 0.77 |
| Payout Ratio | 0 | 0 |
| Dividend Yield | 0 | 0 |
| Fiscal Year | 2025 | 2024 |
Efficiency & Valuation Duel: The Vital Signs
Financial ratios serve as a company’s DNA, uncovering hidden risks and revealing operational strengths beneath the surface.
Super Micro Computer, Inc.
Super Micro Computer demonstrates solid profitability with a 16.6% ROE, signaling efficient equity use. However, its net margin is modest at 4.77%, and valuation ratios like a 27.7 P/E and 4.62 P/B suggest the stock is stretched. The company pays no dividend, instead reinvesting in R&D to fuel growth.
D-Wave Quantum Inc.
D-Wave Quantum suffers from deeply negative returns, including a -229.7% ROE and a -1629.99% net margin, highlighting significant operational challenges. Its valuation appears distorted, with a negative P/E but a very high 25.8 P/B ratio, indicating overvaluation risks. No dividends are paid, reflecting ongoing heavy investment in research and development.
Operational Strength vs. Risky Innovation
Super Micro Computer balances moderate profitability with a stretched valuation, reflecting cautious investor optimism. D-Wave Quantum’s ratios reveal high risk and weak returns despite aggressive R&D spending. Investors seeking operational stability may prefer Super Micro, while those favoring speculative growth face considerable risk with D-Wave.
Which one offers the Superior Shareholder Reward?
I see both Super Micro Computer, Inc. (SMCI) and D-Wave Quantum Inc. (QBTS) pay no dividends, focusing entirely on reinvestment and buybacks. SMCI boasts robust free cash flow (2.58/share in 2025) and a solid buyback capacity, sustaining a 0% payout ratio but with strong cash generation. QBTS, by contrast, posts deep losses with negative margins and free cash flow, reflecting heavy R&D and growth investments but no buybacks. SMCI’s cash-rich, leverage-light position supports sustainable shareholder value creation. QBTS’s speculative reinvestment risks remain high with unproven profitability. For 2026 investors, SMCI offers superior total return potential through disciplined capital allocation and buybacks, while QBTS remains a high-risk growth play without immediate shareholder rewards.
Comparative Score Analysis: The Strategic Profile
The radar chart reveals the fundamental DNA and trade-offs of Super Micro Computer, Inc. and D-Wave Quantum Inc., exposing their financial strengths and weaknesses:
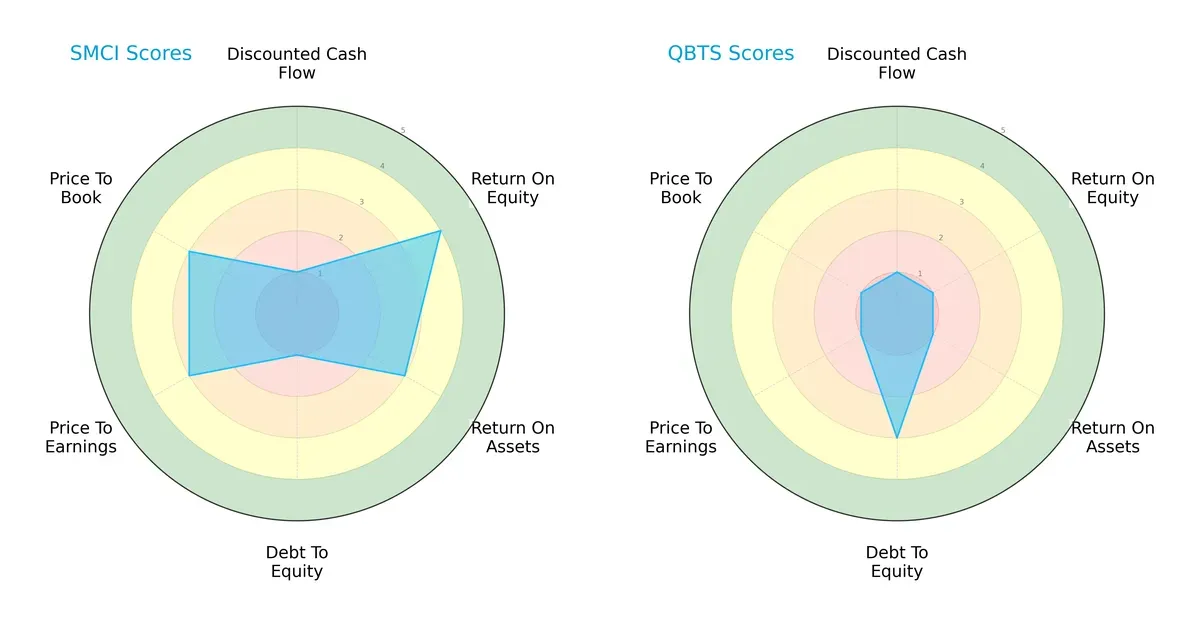
Super Micro Computer, Inc. boasts a more balanced profile with favorable ROE (4) and moderate ROA (3), but it faces very unfavorable debt management (1) and DCF scores (1). Conversely, D-Wave Quantum relies heavily on moderate debt-to-equity (3) while lagging significantly in profitability and valuation metrics, scoring very unfavorable (1) across ROE, ROA, P/E, and P/B. SMCI’s profile suggests operational efficiency tempered by financial risk, whereas QBTS shows vulnerability in core profitability despite better leverage.
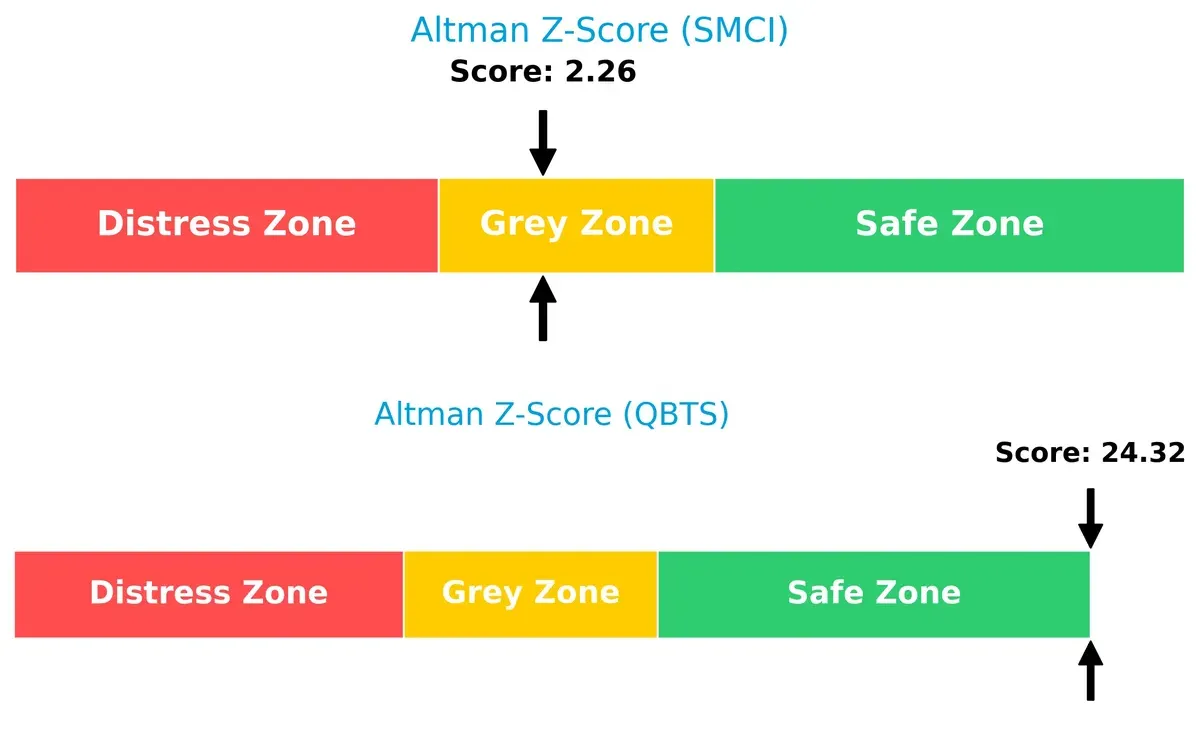
Bankruptcy Risk: Solvency Showdown
Super Micro Computer’s Altman Z-Score sits in the grey zone at 2.26, indicating moderate bankruptcy risk. D-Wave Quantum’s score of 24.32 places it firmly in the safe zone, implying strong solvency and survival potential in this cycle:
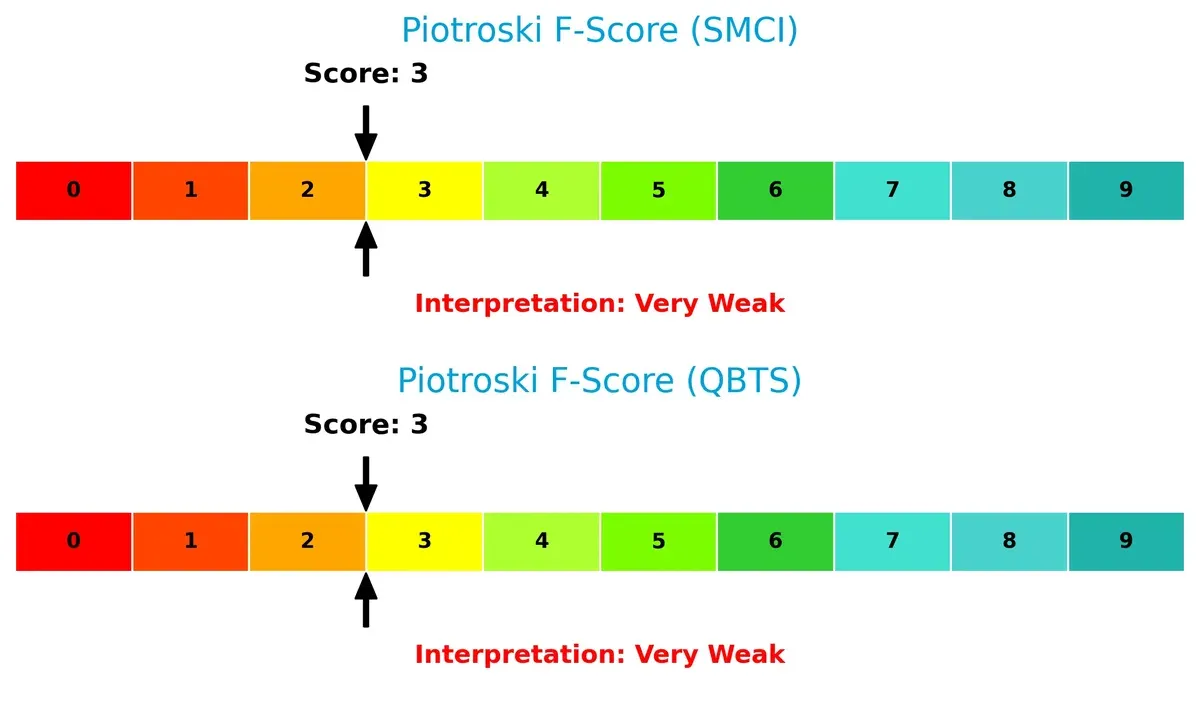
Financial Health: Quality of Operations
Both companies share a very weak Piotroski F-Score of 3, signaling concerns in profitability, liquidity, or operational efficiency. Neither company currently demonstrates peak financial health, highlighting red flags in their internal fundamentals:
How are the two companies positioned?
This section dissects the operational DNA of SMCI and QBTS by comparing their revenue distribution and internal dynamics. The goal is to confront their economic moats and identify the most resilient competitive advantage.
Revenue Segmentation: The Strategic Mix
This comparison dissects how Super Micro Computer, Inc. and D-Wave Quantum Inc. diversify income streams and where their primary sector bets lie:
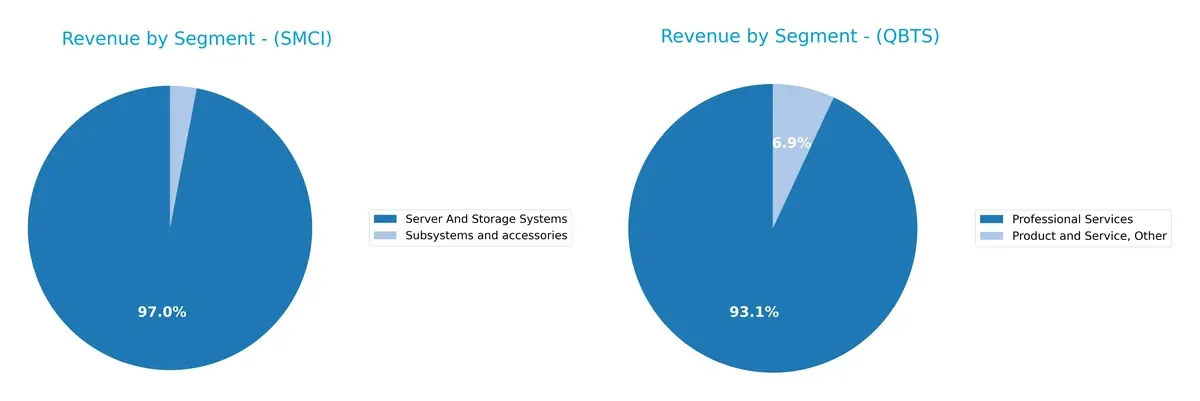
Super Micro Computer, Inc. anchors its revenue heavily in Server And Storage Systems, hitting $21.3B in 2025, dwarfing its $660M Subsystems segment. This concentration signals infrastructure dominance with some diversification. D-Wave Quantum Inc., however, pivots primarily on Professional Services ($1.9M in 2024), with minimal Product revenue ($144K), indicating a narrow focus and higher concentration risk in niche, service-based quantum computing.
Strengths and Weaknesses Comparison
This table compares the Strengths and Weaknesses of Super Micro Computer, Inc. (SMCI) and D-Wave Quantum Inc. (QBTS):
SMCI Strengths
- High revenue in Server and Storage Systems segment
- Strong presence in the US and Asia markets
- Favorable ROE and asset turnover ratios
- Quick ratio indicates good short-term liquidity
QBTS Strengths
- Favorable P/E ratio suggests market optimism
- Low debt-to-assets ratio signals conservative leverage
- Quick ratio shows strong liquidity position
SMCI Weaknesses
- Unfavorable net margin and valuation multiples (P/E, P/B)
- High current ratio flagged as unfavorable
- No dividend yield
- Neutral ROIC vs. WACC ratio
QBTS Weaknesses
- Deep negative profitability metrics (net margin, ROE, ROIC)
- Unfavorable interest coverage ratio suggests financial stress
- Low asset and fixed asset turnover ratios
- High P/B ratio and no dividend yield
SMCI’s strengths lie in robust revenue diversification and solid operational efficiency, but valuation and margin pressures present risks. QBTS struggles with profitability and operational efficiency despite good liquidity and conservative debt levels, complicating its financial outlook.
The Moat Duel: Analyzing Competitive Defensibility
A structural moat is the only reliable shield protecting long-term profits from relentless competition erosion. Let’s dissect how these two tech firms defend their turf:
Super Micro Computer, Inc. (SMCI): Modular Efficiency with Open Architecture
SMCI’s moat stems from its cost advantage and modular design, enabling tailored server solutions that maintain stable margins despite hardware commoditization. Its 6.6% ROIC growth signals improving capital efficiency; expansion into AI and edge computing will deepen this edge in 2026.
D-Wave Quantum Inc. (QBTS): Quantum Innovation with Network Effects
QBTS relies on intangible assets—proprietary quantum technology and a developer community—that create strong network effects unlike SMCI’s cost moat. Despite massive losses, its soaring ROIC trend suggests growing operational leverage; broader quantum adoption could disrupt multiple industries soon.
Cost Advantage vs. Quantum Network Effects: Who Holds the Stronger Moat?
Both firms currently shed value versus their cost of capital, yet each shows promising ROIC improvement. SMCI’s cost efficiency offers a wider moat in mature markets, while QBTS’s quantum network effect represents a deeper moat with higher disruption potential. I see SMCI better positioned to defend share today; QBTS’s moat may widen if it converts innovation into sustainable profits.
Which stock offers better returns?
The past year reveals stark contrasts: Super Micro Computer, Inc. (SMCI) faces a steep decline, while D-Wave Quantum Inc. (QBTS) shows extraordinary growth followed by recent moderation.
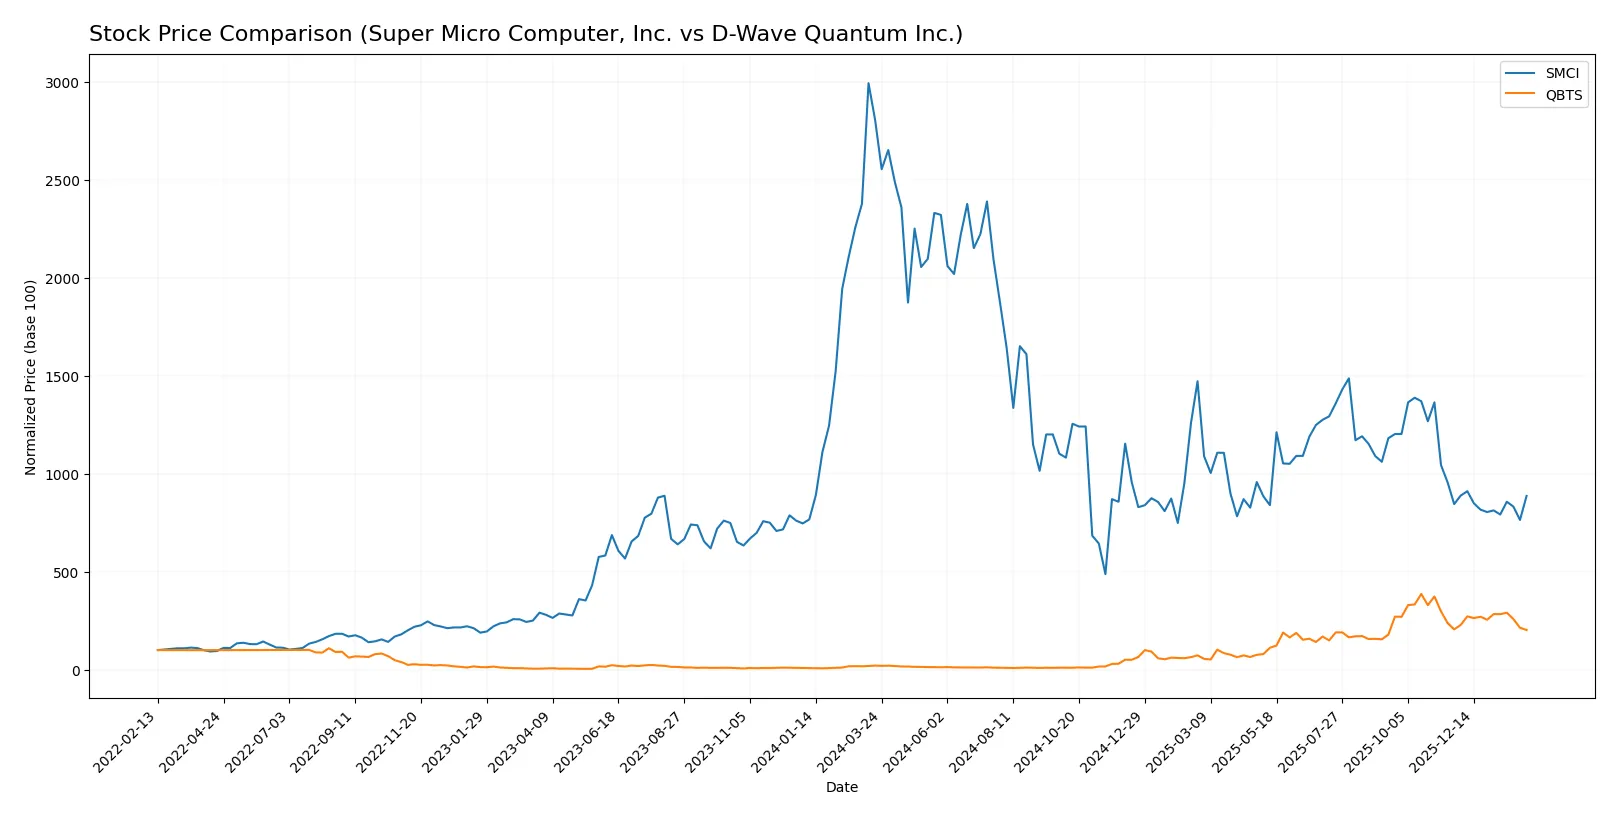
Trend Comparison
SMCI’s stock plunged 68.41% over the past year, marking a bearish trend with accelerating decline. Volatility is high, with prices ranging from $18.58 to $106.88.
QBTS recorded an 866.83% gain over the same period, a bullish trend with decelerating momentum. Price volatility is moderate, fluctuating between $0.84 and $38.33.
Comparing both, QBTS delivered the highest market performance, vastly outperforming SMCI despite recent slight downward pressure.
Target Prices
Analysts present a mixed but optimistic target consensus for these technology hardware companies.
| Company | Target Low | Target High | Consensus |
|---|---|---|---|
| Super Micro Computer, Inc. | 26 | 64 | 47.13 |
| D-Wave Quantum Inc. | 35 | 46 | 41 |
Super Micro’s consensus target of 47.13 sits well above its current price of 33.76, signaling potential upside. D-Wave’s target consensus at 41 also suggests significant appreciation from its 20.11 price, reflecting bullish analyst expectations.

Don’t Let Luck Decide Your Entry Point
Optimize your entry points with our advanced ProRealTime indicators. You’ll get efficient buy signals with precise price targets for maximum performance. Start outperforming now!
How do institutions grade them?
Super Micro Computer, Inc. Grades
The following table summarizes recent grade actions by major financial institutions for Super Micro Computer, Inc.:
| Grading Company | Action | New Grade | Date |
|---|---|---|---|
| Barclays | Maintain | Equal Weight | 2024-10-02 |
| Loop Capital | Maintain | Buy | 2024-09-23 |
| JP Morgan | Downgrade | Neutral | 2024-09-06 |
| Barclays | Downgrade | Equal Weight | 2024-09-04 |
| Barclays | Maintain | Overweight | 2024-08-28 |
| Wells Fargo | Maintain | Equal Weight | 2024-08-28 |
| CFRA | Downgrade | Hold | 2024-08-28 |
| Goldman Sachs | Maintain | Neutral | 2024-08-08 |
| Wells Fargo | Maintain | Equal Weight | 2024-08-07 |
| Rosenblatt | Maintain | Buy | 2024-08-07 |
D-Wave Quantum Inc. Grades
Below are the latest institutional grades for D-Wave Quantum Inc. from reputable firms:
| Grading Company | Action | New Grade | Date |
|---|---|---|---|
| Needham | Maintain | Buy | 2026-01-29 |
| Rosenblatt | Maintain | Buy | 2026-01-28 |
| Benchmark | Maintain | Buy | 2026-01-23 |
| Needham | Maintain | Buy | 2026-01-22 |
| Rosenblatt | Maintain | Buy | 2026-01-08 |
| Rosenblatt | Maintain | Buy | 2026-01-07 |
| Benchmark | Maintain | Buy | 2025-11-10 |
| Rosenblatt | Maintain | Buy | 2025-11-07 |
| Canaccord Genuity | Maintain | Buy | 2025-11-07 |
| Cantor Fitzgerald | Maintain | Overweight | 2025-11-07 |
Which company has the best grades?
D-Wave Quantum Inc. consistently receives strong Buy and Overweight grades from multiple firms. Super Micro Computer, Inc. has a more mixed profile with downgrades and mostly Neutral to Equal Weight ratings. This contrast suggests D-Wave enjoys more bullish institutional sentiment, which could influence investor confidence and valuation dynamics differently.
Risks specific to each company
The following categories identify the critical pressure points and systemic threats facing both firms in the 2026 market environment:
1. Market & Competition
Super Micro Computer, Inc. (SMCI)
- Faces intense competition in modular server hardware with pressure on margins.
D-Wave Quantum Inc. (QBTS)
- Operates in emerging quantum computing, facing technology adoption and competitive uncertainty.
2. Capital Structure & Debt
Super Micro Computer, Inc. (SMCI)
- Moderate leverage with debt-to-assets at 34%, interest coverage strong at 21x.
D-Wave Quantum Inc. (QBTS)
- Lower leverage at 19%, but negative interest coverage signals difficulty servicing debt.
3. Stock Volatility
Super Micro Computer, Inc. (SMCI)
- Beta of 1.52 indicates above-market volatility, price range between $27.6-$66.4.
D-Wave Quantum Inc. (QBTS)
- Slightly higher beta at 1.57, with a wide price range $4.45-$46.75, reflecting speculative swings.
4. Regulatory & Legal
Super Micro Computer, Inc. (SMCI)
- US-based with exposure to evolving data security and export controls.
D-Wave Quantum Inc. (QBTS)
- Canadian-based, quantum tech faces potential export restrictions and emerging regulatory scrutiny.
5. Supply Chain & Operations
Super Micro Computer, Inc. (SMCI)
- Established global supply chain but exposed to semiconductor shortages and geopolitical risks.
D-Wave Quantum Inc. (QBTS)
- Smaller scale operations with higher dependency on specialized components and technology partners.
6. ESG & Climate Transition
Super Micro Computer, Inc. (SMCI)
- Moderate ESG focus; energy-efficient server solutions align with market demand.
D-Wave Quantum Inc. (QBTS)
- Quantum tech promises low-energy computing but lacks mature ESG frameworks.
7. Geopolitical Exposure
Super Micro Computer, Inc. (SMCI)
- Significant US-China trade tensions may disrupt component sourcing.
D-Wave Quantum Inc. (QBTS)
- Canadian base offers some insulation but still subject to US and global tech export policies.
Which company shows a better risk-adjusted profile?
Super Micro’s most impactful risk is market competition compressing margins, but it benefits from robust debt coverage and operational scale. D-Wave’s largest threat is severe negative profitability and interest coverage, signaling financial distress despite lower leverage. Super Micro’s diversified supply chain and stronger financial metrics suggest a better risk-adjusted profile in 2026. The stark contrast in interest coverage—21x versus negative 36x—justifies heightened concern over D-Wave’s solvency risk.
Final Verdict: Which stock to choose?
Super Micro Computer, Inc. (SMCI) excels as a cash-efficient operator with a rising profitability trend despite current value erosion. Its strong liquidity and operational discipline make it a standout in cyclical environments. A point of vigilance is its stretched valuation and mixed margin performance. SMCI suits portfolios targeting aggressive growth tempered by financial pragmatism.
D-Wave Quantum Inc. (QBTS) holds a strategic moat in cutting-edge quantum technology, offering exposure to a potentially transformative industry. Its abundant liquidity cushions volatility, but persistent losses and value destruction signal elevated risk. Relative to SMCI, QBTS presents a speculative profile, fitting investors inclined toward GARP with a tolerance for innovation-driven instability.
If you prioritize operational resilience and improving profitability in established markets, SMCI is the compelling choice due to its efficient capital use and liquidity strength. However, if you seek exposure to emerging technology with long-term growth potential, QBTS offers superior innovation upside despite its current financial challenges. Both demand caution; your investment thesis must align with your risk appetite and time horizon.
Disclaimer: Investment carries a risk of loss of initial capital. The past performance is not a reliable indicator of future results. Be sure to understand risks before making an investment decision.
Go Further
I encourage you to read the complete analyses of Super Micro Computer, Inc. and D-Wave Quantum Inc. to enhance your investment decisions: