Home > Comparison > Technology > STX vs QBTS
The strategic rivalry between Seagate Technology Holdings plc and D-Wave Quantum Inc. shapes the future of computer hardware innovation. Seagate operates as a capital-intensive leader in mass data storage solutions, while D-Wave pioneers quantum computing systems with a high-tech, service-oriented model. This analysis probes their contrasting growth trajectories and investment potential. I will determine which company presents a superior risk-adjusted opportunity for a diversified portfolio in the evolving technology sector.
Table of contents
Companies Overview
Seagate Technology Holdings plc and D-Wave Quantum Inc. are pivotal players shaping the future of computer hardware markets.
Seagate Technology Holdings plc: Data Storage Powerhouse
Seagate dominates as a leader in mass capacity storage products. Its revenue stems primarily from enterprise HDDs, SSDs, and external storage solutions sold to OEMs and retailers. In 2026, Seagate’s strategic focus emphasizes expanding its Lyve edge-to-cloud platform, aiming to strengthen its foothold in scalable, high-volume data storage solutions worldwide.
D-Wave Quantum Inc.: Quantum Computing Pioneer
D-Wave stands out as an innovator in quantum computing systems and services. It generates revenue through advanced quantum hardware, cloud access, and professional onboarding services. The company’s 2026 strategy revolves around democratizing quantum computing via its Leap cloud platform, targeting sectors like AI, drug discovery, and financial modeling with open-source software and hybrid solutions.
Strategic Collision: Similarities & Divergences
Seagate and D-Wave both operate in technology hardware but follow divergent philosophies—Seagate builds on proven mass storage infrastructure, while D-Wave pioneers an open-access quantum ecosystem. They compete indirectly for technology leadership, with Seagate focusing on traditional data storage and D-Wave pushing quantum innovation. Their investment profiles differ sharply, reflecting Seagate’s scale and stability against D-Wave’s high-growth, early-stage opportunity.
Income Statement Comparison
This data dissects the core profitability and scalability of both corporate engines to reveal who dominates the bottom line:
| Metric | Seagate Technology Holdings plc (STX) | D-Wave Quantum Inc. (QBTS) |
|---|---|---|
| Revenue | 9.1B | 8.8M |
| Cost of Revenue | 5.9B | 3.3M |
| Operating Expenses | 1.3B | 82.8M |
| Gross Profit | 3.2B | 5.6M |
| EBITDA | 2.1B | -138.1M |
| EBIT | 1.8B | -140.0M |
| Interest Expense | 321M | 3.9M |
| Net Income | 1.5B | -143.9M |
| EPS | 6.93 | -0.75 |
| Fiscal Year | 2025 | 2024 |
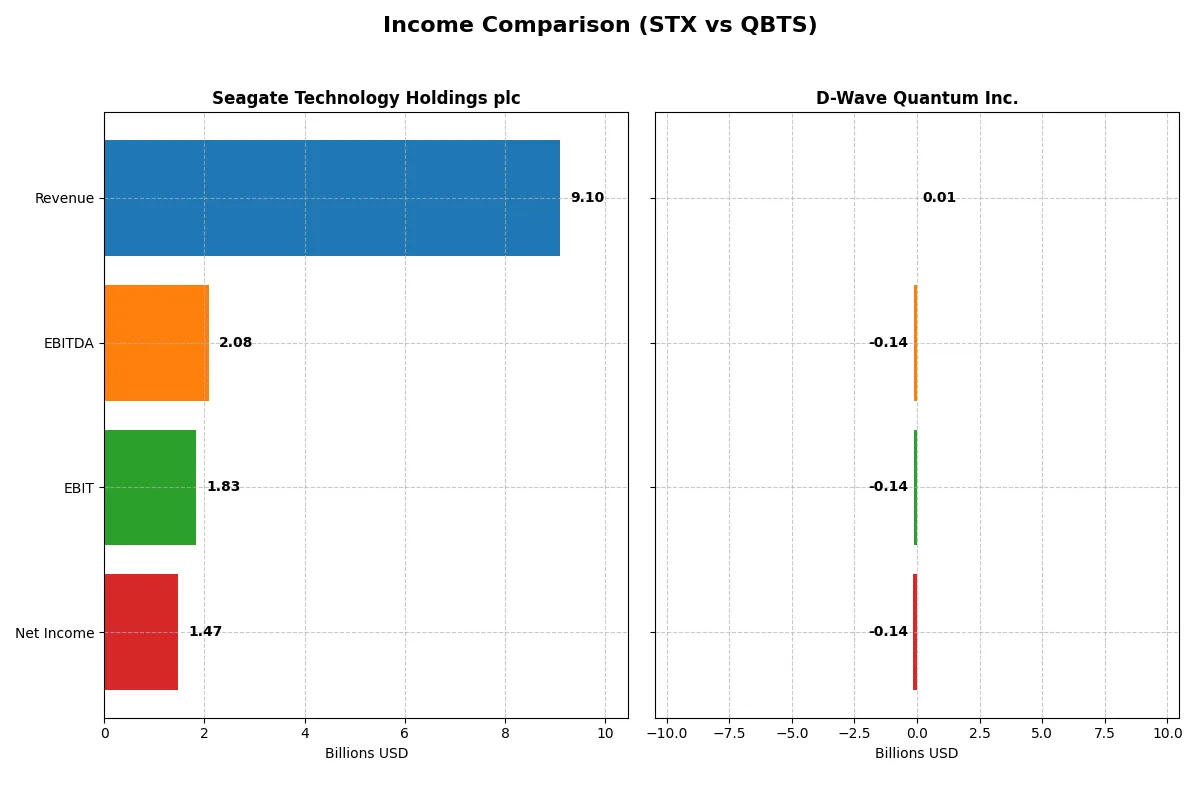
Income Statement Analysis: The Bottom-Line Duel
This income statement comparison reveals the true efficiency and profitability of Seagate Technology Holdings plc and D-Wave Quantum Inc.’s corporate engines.
Seagate Technology Holdings plc Analysis
Seagate’s revenue shows volatility but surged 39% from 2024 to 2025, reaching $9.1B. Net income climbed robustly to $1.47B, reflecting a strong recovery from losses in 2023. Gross margin stands healthy at 35.2%, and net margin improved to 16.2%, signaling disciplined cost control and rising profitability. The 2025 figures highlight powerful momentum and operational efficiency gains.
D-Wave Quantum Inc. Analysis
D-Wave’s revenue grows modestly, reaching $8.8M in 2024, up less than 1% year-over-year. Despite a favorable gross margin of 63%, the company incurs heavy operating losses, with net income at -$144M and a negative net margin near -1630%. High interest expenses and operating costs erode profitability. The 2024 results reflect ongoing challenges in scaling revenue while managing elevated expenses.
Margin Power vs. Revenue Scale
Seagate demonstrates strong profitability and improving margins alongside significant revenue growth, marking it as the fundamental leader. D-Wave shows promising gross margins but suffers from persistent net losses and weak margin control. Investors seeking operational efficiency and bottom-line strength may find Seagate’s profile more compelling given its clear path to profitability.
Financial Ratios Comparison
These vital ratios act as a diagnostic tool to expose the underlying fiscal health, valuation premiums, and capital efficiency of the companies compared:
| Ratios | Seagate Technology Holdings plc (STX) | D-Wave Quantum Inc. (QBTS) |
|---|---|---|
| ROE | -3.24% | -2.30% |
| ROIC | 33.76% | -45.01% |
| P/E | 20.41 | -11.22 |
| P/B | -66.19 | 25.76 |
| Current Ratio | 1.38 | 6.14 |
| Quick Ratio | 0.84 | 6.08 |
| D/E | -11.86 | 0.61 |
| Debt-to-Assets | 67.0% | 19.2% |
| Interest Coverage | 5.89 | -19.82 |
| Asset Turnover | 1.13 | 0.04 |
| Fixed Asset Turnover | 5.49 | 0.77 |
| Payout ratio | 40.8% | 0% |
| Dividend yield | 2.00% | 0% |
| Fiscal Year | 2025 | 2024 |
Efficiency & Valuation Duel: The Vital Signs
Financial ratios serve as a company’s DNA, exposing hidden risks and highlighting operational strengths that shape investment decisions.
Seagate Technology Holdings plc
Seagate posts a mixed profitability picture with a favorable 16.15% net margin but an unfavorable -324.28% ROE, indicating shareholder returns are under pressure. The P/E ratio at 20.41 suggests a neutral valuation, neither cheap nor stretched. It supports a 2% dividend yield, signaling steady cash returns alongside reinvestment in operations.
D-Wave Quantum Inc.
D-Wave suffers from deeply negative profitability with a -1629.99% net margin and a -229.67% ROE, reflecting operational struggles. Despite a negative P/E, its valuation appears favorable, driven by low earnings. The company pays no dividends, instead allocating significant resources to R&D and growth, consistent with its early-stage profile.
Operational Strength vs. Growth Risk
Seagate balances moderate valuation with strong operational metrics and dividend returns, offering a risk-mitigated profile. D-Wave’s unfavorable ratios highlight high growth risk and operational inefficiencies. Investors seeking steady income and efficiency may prefer Seagate, while those targeting speculative growth might lean toward D-Wave.
Which one offers the Superior Shareholder Reward?
I compare Seagate Technology Holdings plc (STX) and D-Wave Quantum Inc. (QBTS) on shareholder returns. STX pays a solid 2.0% dividend yield with a 41% payout ratio, well covered by free cash flow at 76%. Its share buybacks are modest but consistent, supporting total shareholder return. QBTS pays no dividends, reflecting its deep investment in R&D and growth as a quantum computing pioneer. Its buyback activity is negligible, signaling focus on reinvestment rather than distributions. Historically, STX’s balanced distribution model offers more sustainable returns in a mature sector. QBTS’s lack of yield and negative operating margins expose investors to higher risk. I conclude STX provides a superior total return profile for 2026 investors seeking both income and capital appreciation.
Comparative Score Analysis: The Strategic Profile
The radar chart reveals the fundamental DNA and trade-offs of Seagate Technology Holdings plc and D-Wave Quantum Inc.:
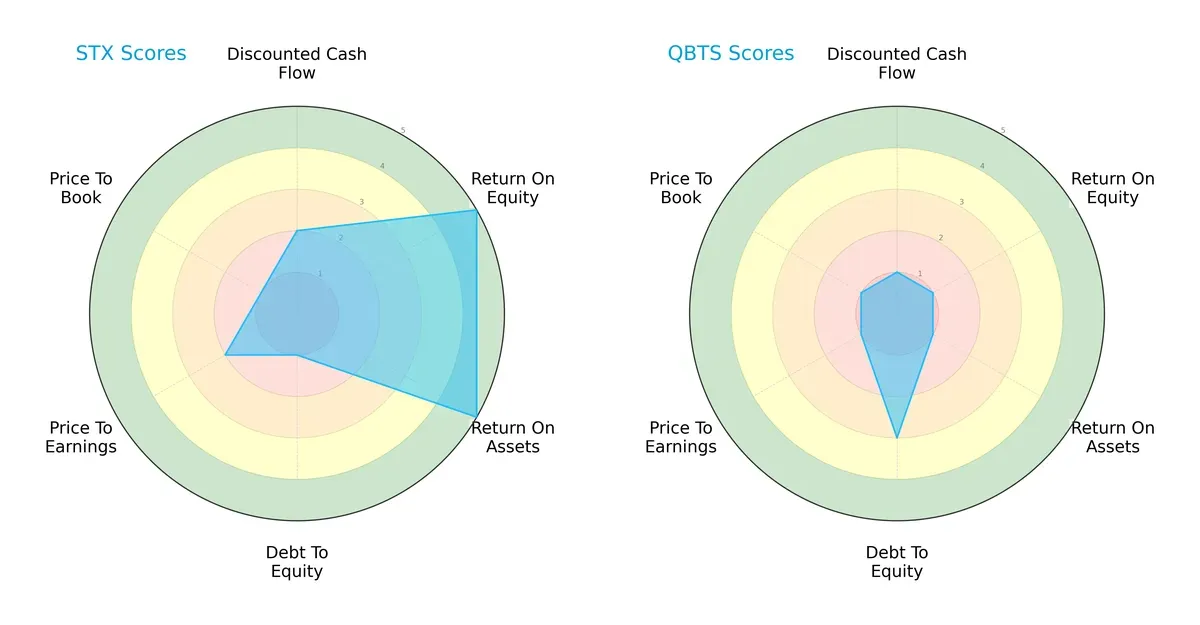
Seagate Technology (STX) shows strength in ROE and ROA with top scores of 5, signaling efficient profit and asset use. However, it carries heavy financial risk, evidenced by a poor debt-to-equity score of 1. D-Wave Quantum (QBTS) displays weak operational efficiency with scores of 1 across ROE, ROA, and DCF, but maintains moderate leverage at 3. STX offers a more balanced profile, relying on operational excellence but burdened by debt. QBTS depends largely on manageable debt but lacks profitability and valuation strength.
Bankruptcy Risk: Solvency Showdown
Seagate and D-Wave both reside comfortably in the safe zone, indicating low bankruptcy risk in this cycle:
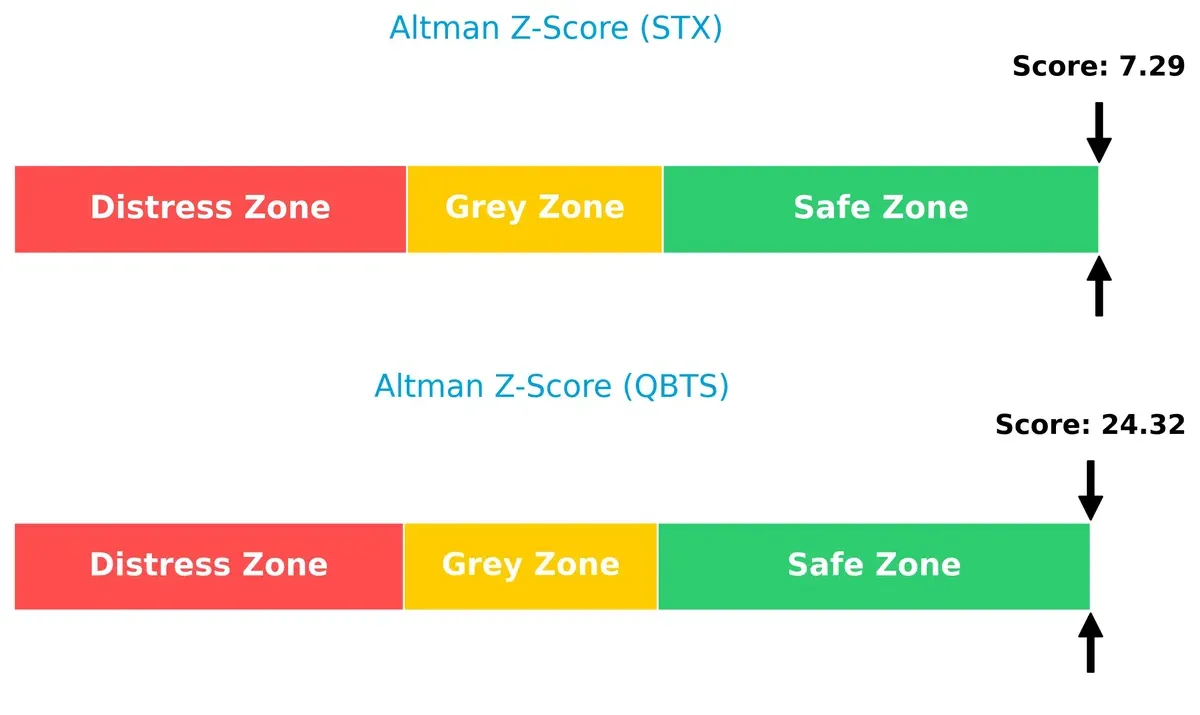
D-Wave’s Altman Z-Score of 24.3 far exceeds Seagate’s 7.3, reflecting superior solvency and lower default probability. Historically, such a high Z-score is rare and signals exceptional financial stability. Seagate’s score, while safe, suggests moderate risk compared to QBTS.
Financial Health: Quality of Operations
Seagate demonstrates robust financial health with a Piotroski F-Score of 7, while D-Wave’s 3 signals internal weaknesses and red flags:
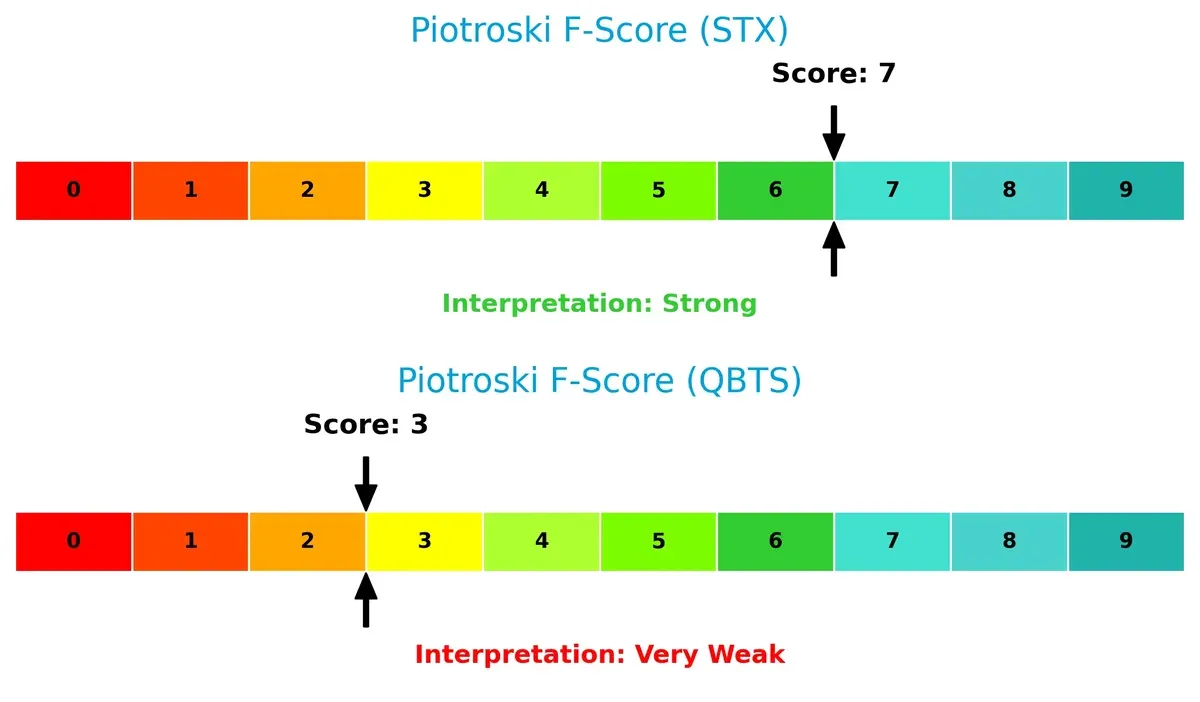
Seagate’s high score indicates strong profitability, liquidity, and operational efficiency, consistent with firms that sustain growth through market cycles. D-Wave’s low score warns of weak fundamentals and potential financial distress, undermining its investment appeal despite a strong solvency position.
How are the two companies positioned?
This section dissects the operational DNA of Seagate Technology Holdings plc and D-Wave Quantum Inc. by comparing their revenue distribution and internal dynamics. The objective is to confront their economic moats and identify which business model offers the most resilient competitive advantage today.
Revenue Segmentation: The Strategic Mix
This comparison dissects how Seagate Technology Holdings plc and D-Wave Quantum Inc. diversify their income streams and where their primary sector bets lie:
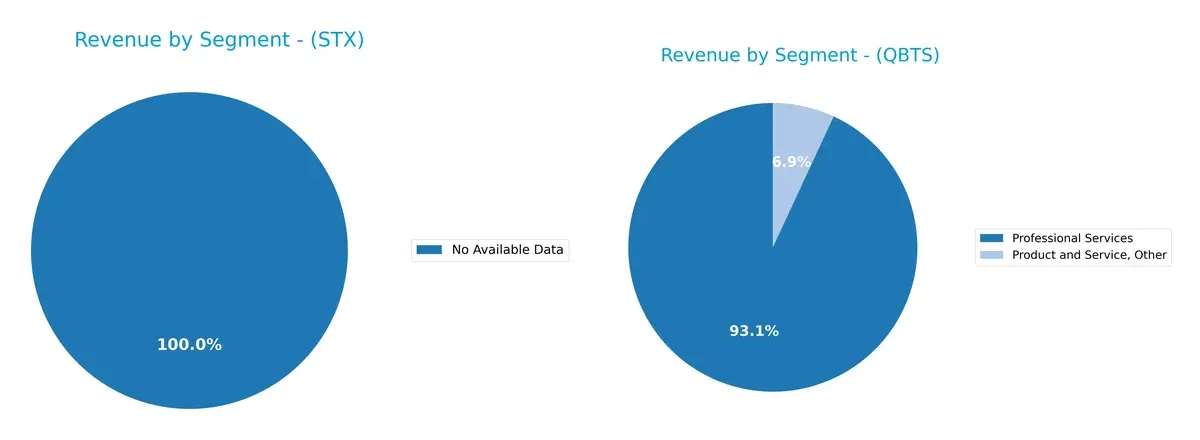
Seagate Technology lacks available revenue segmentation data, limiting direct comparison. D-Wave Quantum pivots heavily on Professional Services, which dwarfs its Product and Service, Other segment—from $1.48M in 2022 to $3.82M in 2023. This concentration anchors D-Wave’s strategy on high-value service contracts, exposing it to sector-specific risks but potentially reinforcing ecosystem lock-in through specialized consulting and support.
Strengths and Weaknesses Comparison
This table compares the strengths and weaknesses of Seagate Technology Holdings plc (STX) and D-Wave Quantum Inc. (QBTS):
STX Strengths
- Favorable net margin of 16.15%
- High ROIC at 33.76% above WACC
- Strong global presence with significant US and Singapore revenues
- Favorable dividend yield of 2.0%
- Solid asset turnover ratios
- Favorable interest coverage at 5.71
QBTS Strengths
- Favorable quick ratio of 6.08 indicating liquidity
- Low debt-to-assets ratio at 19.2%
- Positive PE status despite negative margin
- Growing professional services revenue
- Presence in multiple geographic markets including US, Germany, Japan, Canada
STX Weaknesses
- Negative ROE at -324.28% signals equity inefficiency
- High debt-to-assets ratio of 66.97% increases financial risk
- WACC at 11.21% exceeds ROE, unfavorable cost of capital
- Neutral current and quick ratios suggest liquidity constraints
- Negative PB ratio possibly reflecting valuation challenges
QBTS Weaknesses
- Extremely negative net margin at -1629.99%
- Negative ROE and ROIC show poor profitability and capital returns
- Negative interest coverage indicates high risk of debt servicing issues
- Low asset and fixed asset turnover ratios demonstrate operational inefficiency
- Zero dividend yield and unfavorable PB ratio raise valuation concerns
STX’s strengths lie in profitability and global footprint but face financial leverage and equity return challenges. QBTS shows liquidity and low leverage strengths but suffers from severe profitability and operational efficiency weaknesses. These profiles highlight contrasting strategic priorities for financial and operational improvement.
The Moat Duel: Analyzing Competitive Defensibility
A structural moat is the only reliable shield protecting long-term profits from relentless competitive erosion:
Seagate Technology Holdings plc: Durable Cost and Scale Advantage
Seagate’s moat stems from cost leadership and scale in data storage manufacturing. Its strong ROIC above WACC confirms efficient capital use and margin stability. Expansion into cloud-edge platforms deepens this moat in 2026.
D-Wave Quantum Inc.: Emerging Intangible Asset Moat
D-Wave’s moat lies in proprietary quantum computing technology and software ecosystems. Unlike Seagate’s mature scale advantage, it currently burns cash with negative ROIC but shows improving profitability trends. Quantum adoption could disrupt markets if scalability improves.
Scale Mastery vs. Quantum Innovation: A Moat Showdown
Seagate’s wider moat benefits from proven cost efficiency and steady returns, unlike D-Wave’s nascent intangible moat with negative value creation. Seagate is better positioned to defend market share amid competition and technological shifts in 2026.
Which stock offers better returns?
Over the past year, both Seagate Technology Holdings plc and D-Wave Quantum Inc. showed strong price movements, with contrasting trend dynamics and trading volumes shaping their market performance.
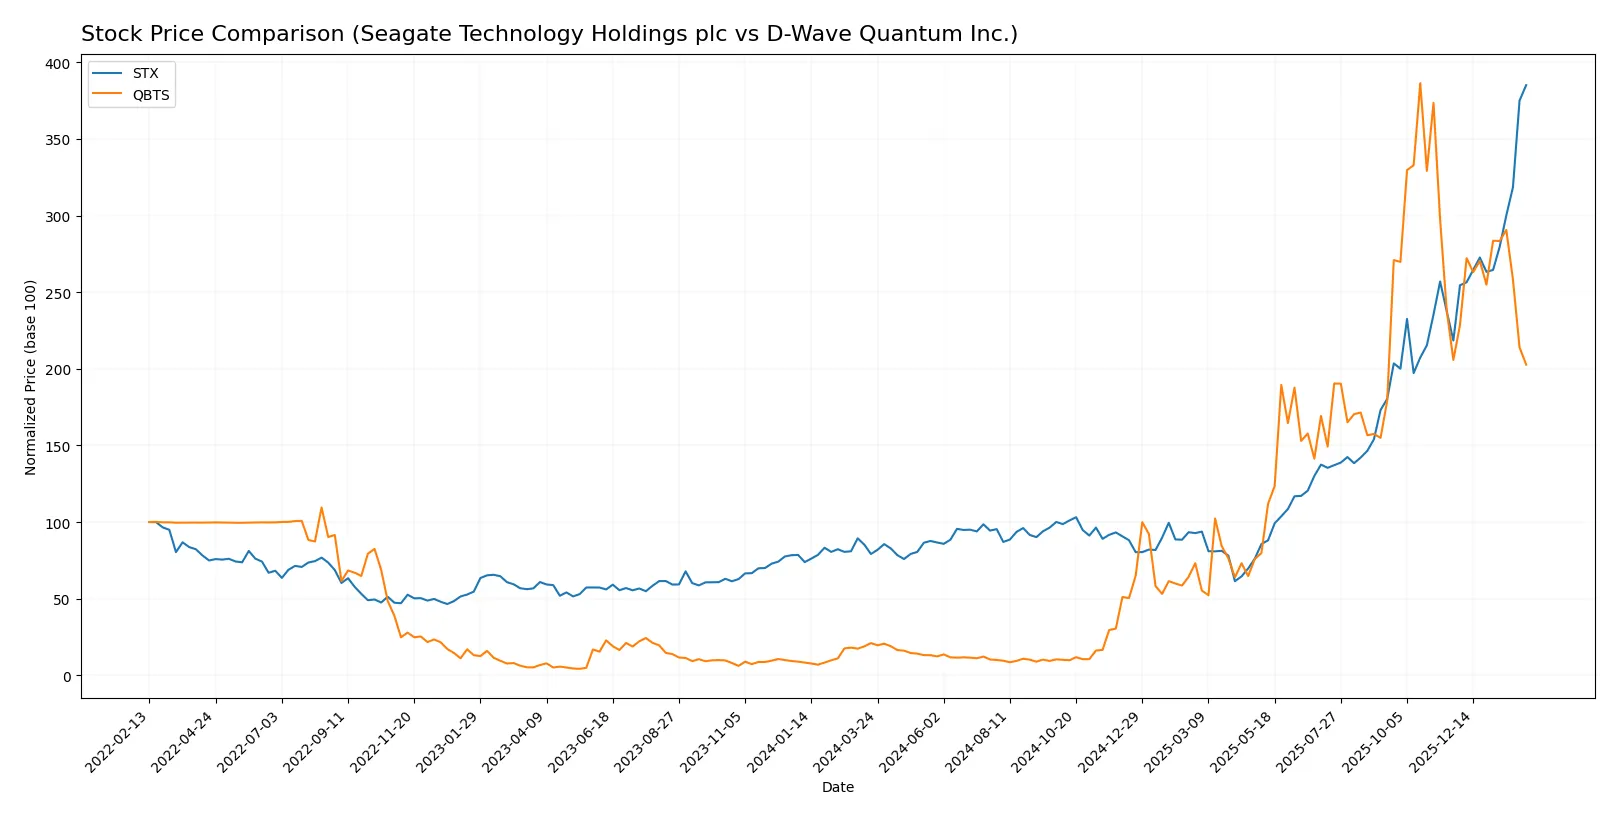
Trend Comparison
Seagate Technology (STX) posted a bullish trend with a 387% price increase over 12 months. The trend accelerates, marked by volatility (std dev 78.67) and a high of 418.63.
D-Wave Quantum (QBTS) also exhibited a bullish trend with an 867% rise over the same period. However, its trend decelerated, volatility remained low (std dev 10.43), and it peaked at 38.33.
Comparing both, QBTS delivered the highest overall market performance despite recent slight weakness, while STX’s accelerating trend shows stronger momentum.
Target Prices
Analysts present a mixed but generally optimistic target price consensus for Seagate Technology and D-Wave Quantum.
| Company | Target Low | Target High | Consensus |
|---|---|---|---|
| Seagate Technology Holdings plc | 270 | 505 | 407.2 |
| D-Wave Quantum Inc. | 35 | 46 | 41 |
Seagate’s consensus target sits just below its current price of $418.63, suggesting moderate upside potential with some caution. D-Wave’s target consensus more than doubles its current price of $20.11, indicating strong growth expectations but higher risk.

Don’t Let Luck Decide Your Entry Point
Optimize your entry points with our advanced ProRealTime indicators. You’ll get efficient buy signals with precise price targets for maximum performance. Start outperforming now!
How do institutions grade them?
This section compares recent grades assigned to Seagate Technology Holdings plc and D-Wave Quantum Inc.:
Seagate Technology Holdings plc Grades
The table below summarizes recent institutional grades for Seagate Technology Holdings plc:
| Grading Company | Action | New Grade | Date |
|---|---|---|---|
| Cantor Fitzgerald | Maintain | Overweight | 2026-02-04 |
| Citigroup | Maintain | Buy | 2026-01-29 |
| Baird | Maintain | Outperform | 2026-01-29 |
| Rosenblatt | Maintain | Buy | 2026-01-28 |
| UBS | Maintain | Neutral | 2026-01-28 |
| Barclays | Maintain | Equal Weight | 2026-01-28 |
| Mizuho | Maintain | Outperform | 2026-01-28 |
| Goldman Sachs | Maintain | Buy | 2026-01-28 |
| Wells Fargo | Maintain | Equal Weight | 2026-01-28 |
| Cantor Fitzgerald | Maintain | Overweight | 2026-01-28 |
D-Wave Quantum Inc. Grades
The table below summarizes recent institutional grades for D-Wave Quantum Inc.:
| Grading Company | Action | New Grade | Date |
|---|---|---|---|
| Needham | Maintain | Buy | 2026-01-29 |
| Rosenblatt | Maintain | Buy | 2026-01-28 |
| Benchmark | Maintain | Buy | 2026-01-23 |
| Needham | Maintain | Buy | 2026-01-22 |
| Rosenblatt | Maintain | Buy | 2026-01-08 |
| Rosenblatt | Maintain | Buy | 2026-01-07 |
| Benchmark | Maintain | Buy | 2025-11-10 |
| Rosenblatt | Maintain | Buy | 2025-11-07 |
| Canaccord Genuity | Maintain | Buy | 2025-11-07 |
| Cantor Fitzgerald | Maintain | Overweight | 2025-11-07 |
Which company has the best grades?
Seagate Technology shows a mix of Buy, Outperform, Overweight, and Neutral grades, indicating moderate institutional confidence. D-Wave consistently earns Buy ratings with some Overweight, reflecting stronger consensus optimism. Investors may view D-Wave’s uniform Buy ratings as a signal of higher growth expectations, while Seagate’s varied grades suggest more cautious outlooks.
Risks specific to each company
The following categories identify the critical pressure points and systemic threats facing both firms in the 2026 market environment:
1. Market & Competition
Seagate Technology Holdings plc
- Established player in mature data storage markets with steady demand but intense competition from SSD and cloud providers.
D-Wave Quantum Inc.
- Emerging quantum computing firm facing nascent market adoption and fierce competition from larger tech companies investing in quantum research.
2. Capital Structure & Debt
Seagate Technology Holdings plc
- High debt-to-assets ratio (67%) poses leverage risk despite favorable interest coverage of 5.7x.
D-Wave Quantum Inc.
- Lower debt-to-assets (19%) reduces leverage risk but negative interest coverage signals operational losses and financial strain.
3. Stock Volatility
Seagate Technology Holdings plc
- Beta of 1.635 suggests above-market volatility typical for tech hardware, but with a broad price range indicating cyclical swings.
D-Wave Quantum Inc.
- Beta of 1.569 reflects high volatility, compounded by wide trading range and limited market capitalization of $7.4B.
4. Regulatory & Legal
Seagate Technology Holdings plc
- Subject to data privacy and export control regulations across multiple jurisdictions, with moderate legal risk.
D-Wave Quantum Inc.
- Faces emerging regulatory scrutiny around quantum encryption and export controls, heightening compliance complexity.
5. Supply Chain & Operations
Seagate Technology Holdings plc
- Global supply chain exposed to semiconductor shortages but benefits from scale and diversified manufacturing footprint.
D-Wave Quantum Inc.
- Dependent on highly specialized quantum hardware components with limited supplier options, increasing operational risk.
6. ESG & Climate Transition
Seagate Technology Holdings plc
- Established ESG programs mitigate risks; however, energy-intensive manufacturing challenges climate targets.
D-Wave Quantum Inc.
- Quantum computing’s potential for energy efficiency gains is promising but early-stage, with unclear ESG impact metrics.
7. Geopolitical Exposure
Seagate Technology Holdings plc
- Operations span U.S., Europe, and Asia, subject to trade tensions and tariffs impacting component costs.
D-Wave Quantum Inc.
- Based in Canada with U.S. market exposure; geopolitical risk includes technology transfer restrictions and international collaboration limits.
Which company shows a better risk-adjusted profile?
Seagate’s most impactful risk is its high leverage amid cyclical market pressures. D-Wave’s greatest risk stems from operational losses and immature market adoption. Despite volatility, Seagate’s strong profitability and asset efficiency give it a superior risk-adjusted profile. Meanwhile, D-Wave’s weak margins and financial instability highlight significant risk. Notably, Seagate’s Altman Z-score of 7.3 signals solid financial health, contrasting with D-Wave’s very weak Piotroski score of 3, underscoring its fragile fundamentals.
Final Verdict: Which stock to choose?
Seagate Technology Holdings plc (STX) excels as a cash-generating powerhouse with a robust and expanding economic moat. Its ability to deliver strong returns on invested capital signals operational excellence and efficient capital allocation. A point of vigilance remains its elevated debt-to-assets ratio, which could pressure financial flexibility. STX suits portfolios focused on steady income and value growth.
D-Wave Quantum Inc. (QBTS) offers a niche strategic moat grounded in pioneering quantum computing technology, promising long-term disruption potential. Its balance sheet shows prudent leverage and ample liquidity, presenting a safer profile than STX in terms of solvency. QBTS appeals to investors with a high tolerance for risk, targeting speculative growth and innovation-driven upside.
If you prioritize resilient cash flow and proven value creation, Seagate Technology outshines with its sustainable moat and financial strength. However, if you seek exposure to emerging technologies and are comfortable with volatility, D-Wave Quantum offers superior speculative growth potential despite its weaker profitability. Both present distinct scenarios tailored to different investor appetites.
Disclaimer: Investment carries a risk of loss of initial capital. The past performance is not a reliable indicator of future results. Be sure to understand risks before making an investment decision.
Go Further
I encourage you to read the complete analyses of Seagate Technology Holdings plc and D-Wave Quantum Inc. to enhance your investment decisions: