Quantum computing is rapidly evolving, reshaping the technology landscape with groundbreaking innovations. D-Wave Quantum Inc. (QBTS) and Quantum Computing, Inc. (QUBT) stand out as key players in this competitive industry, both specializing in computer hardware but with distinct approaches to software and quantum systems. This article will analyze their strategies, market positions, and growth potential to help you identify the most compelling investment opportunity.

Table of contents
Companies Overview
I will begin the comparison between D-Wave Quantum Inc. and Quantum Computing, Inc. by providing an overview of these two companies and their main differences.
D-Wave Quantum Inc. Overview
D-Wave Quantum Inc. develops and delivers quantum computing systems, software, and services globally. Its offerings include a fifth-generation quantum computer, open-source programming tools, and cloud-based access to quantum resources. The company serves diverse industries such as manufacturing, financial services, and life sciences, positioning itself as a leader in applied quantum solutions. It is headquartered in Burnaby, Canada, with a market cap near 9.7B USD.
Quantum Computing, Inc. Overview
Quantum Computing, Inc. focuses on providing software tools and applications for quantum computers, including a quantum application accelerator and multiple quantum processing units. Serving commercial and government clients from its base in Virginia, the company emphasizes enabling quantum-ready applications on conventional and quantum hardware. It operates with a smaller scale of 41 employees and holds a market cap of approximately 1.5B USD.
Key similarities and differences
Both companies operate within the computer hardware industry and develop quantum computing technologies, targeting commercial and government sectors. D-Wave’s business model integrates hardware, software, and cloud services with a broad industry application, while Quantum Computing, Inc. concentrates on quantum software tools and accelerators with multi-platform compatibility. The scale and market capitalization of D-Wave significantly exceed those of Quantum Computing, reflecting differing market positions and operational scopes.
Income Statement Comparison
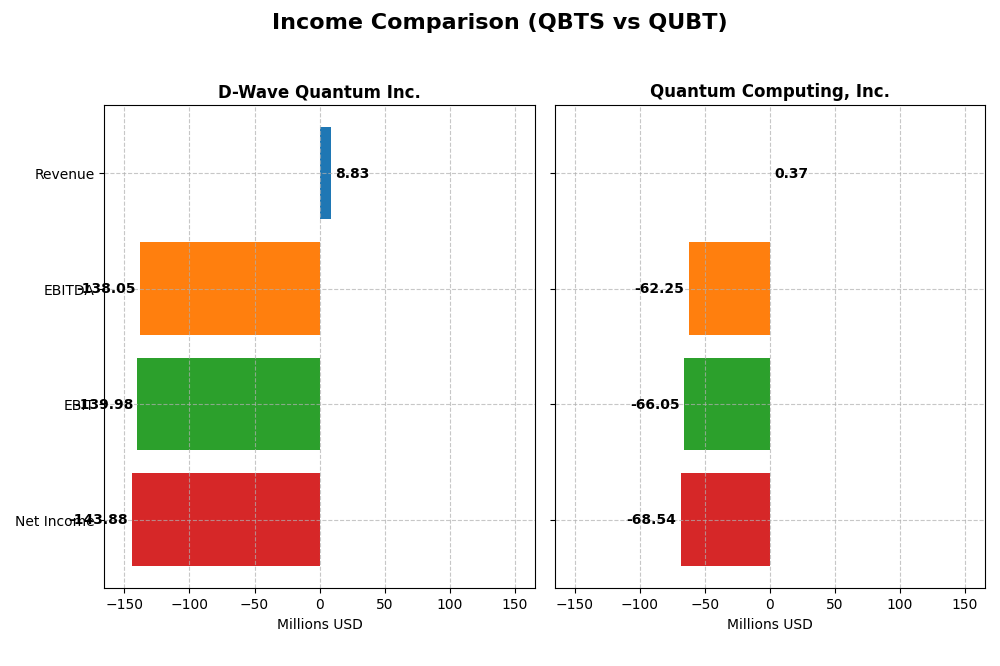
This table compares key income statement metrics for D-Wave Quantum Inc. and Quantum Computing, Inc. for the fiscal year 2024, providing a snapshot of their financial performance.
| Metric | D-Wave Quantum Inc. | Quantum Computing, Inc. |
|---|---|---|
| Market Cap | 9.75B | 1.50B |
| Revenue | 8.83M | 373K |
| EBITDA | -138.1M | -62.2M |
| EBIT | -140.0M | -66.0M |
| Net Income | -143.9M | -68.5M |
| EPS | -0.75 | -0.73 |
| Fiscal Year | 2024 | 2024 |
Income Statement Interpretations
D-Wave Quantum Inc.
D-Wave Quantum Inc. showed steady revenue growth from $5.16M in 2020 to $8.83M in 2024, a 71.07% increase over the period. Despite gross margin stability around 63%, net income remained deeply negative, worsening to -$144M in 2024. The latest year saw a slight revenue rise of 0.79% but significant declines in EBIT and net margin, reflecting increased expenses and losses.
Quantum Computing, Inc.
Quantum Computing, Inc.’s revenue remained minimal, reaching only $0.37M in 2024, with a flat trend over the period. Gross profit stayed negative throughout, with margins severely unfavorable. Net income deteriorated to -$68.5M in 2024. The most recent year showed modest revenue growth of 4.19% but sharp declines in EBIT and net margin, indicating rising operating losses and interest expenses.
Which one has the stronger fundamentals?
Both companies exhibit unfavorable income statement fundamentals, with persistent net losses and negative margins. D-Wave Quantum has stronger top-line growth and a positive gross margin, while Quantum Computing faces deeper margin erosion and lower revenue scale. However, both suffer from high interest expenses and declining profitability, suggesting significant financial challenges for investors to consider.
Financial Ratios Comparison
This table presents a side-by-side comparison of key financial ratios for D-Wave Quantum Inc. and Quantum Computing, Inc. for the fiscal year 2024, providing a snapshot of their financial performance and health.
| Ratios | D-Wave Quantum Inc. (QBTS) | Quantum Computing, Inc. (QUBT) |
|---|---|---|
| ROE | -2.30 | -0.64 |
| ROIC | -0.45 | -0.17 |
| P/E | -11.22 | -22.67 |
| P/B | 25.76 | 14.48 |
| Current Ratio | 6.14 | 17.36 |
| Quick Ratio | 6.08 | 17.36 |
| D/E | 0.61 | 0.01 |
| Debt-to-Assets | 0.19 | 0.01 |
| Interest Coverage | -19.82 | -10.39 |
| Asset Turnover | 0.04 | 0.0024 |
| Fixed Asset Turnover | 0.77 | 0.038 |
| Payout ratio | 0 | -0.0031 |
| Dividend yield | 0 | 0.014% |
Interpretation of the Ratios
D-Wave Quantum Inc.
D-Wave Quantum Inc. shows mostly unfavorable financial ratios for 2024, including negative net margin (-1630%) and return on equity (-230%), signaling weak profitability and efficiency. The company has a high price-to-book ratio (25.76) and a strong current ratio (6.14) deemed unfavorable. It does not pay dividends, likely reflecting a reinvestment or growth strategy given ongoing losses and cash flow challenges.
Quantum Computing, Inc.
Quantum Computing, Inc. also exhibits predominantly unfavorable ratios in 2024, with a highly negative net margin (-18376%) and return on equity (-64%), pointing to operational difficulties. The current ratio is very high (17.36), flagged as unfavorable, while debt levels remain low and favorable. Like D-Wave, it pays no dividends, consistent with likely reinvestment and development priorities amid losses.
Which one has the best ratios?
Both companies face significant profitability and operational challenges, with over 70% of their ratios rated unfavorable. Quantum Computing, Inc. shows slightly more favorable leverage and liquidity metrics but also a more negative net margin. Overall, neither company presents a clearly superior ratio profile, as both remain financially strained in 2024.
Strategic Positioning
This section compares the strategic positioning of D-Wave Quantum Inc. and Quantum Computing, Inc., including Market position, Key segments, and disruption:
D-Wave Quantum Inc.
- Larger market cap at 9.7B with strong NYSE listing; faces moderate competitive pressure.
- Focuses on quantum systems, software, and services; serves manufacturing, finance, life sciences sectors.
- Develops integrated quantum computing hardware and cloud services; exposure to evolving quantum tech.
Quantum Computing, Inc.
- Smaller market cap at 1.5B, listed on NASDAQ Capital Market; higher beta indicates more volatility.
- Provides quantum software tools and multiple quantum processing units; targets commercial and government clients.
- Concentrates on quantum application acceleration software and processor access; reliant on third-party quantum hardware.
D-Wave Quantum Inc. vs Quantum Computing, Inc. Positioning
D-Wave presents a diversified portfolio across hardware, software, and services with broad industry applications, while Quantum Computing, Inc. concentrates on software tools and quantum processing access mainly for commercial and government sectors. D-Wave’s larger scale contrasts with Quantum Computing’s narrower focus and smaller workforce.
Which has the best competitive advantage?
Both companies show slightly unfavorable MOAT evaluations due to ROIC below WACC but with growing profitability trends. Neither currently demonstrates a strong competitive advantage, though improving ROIC indicates potential future value creation.
Stock Comparison
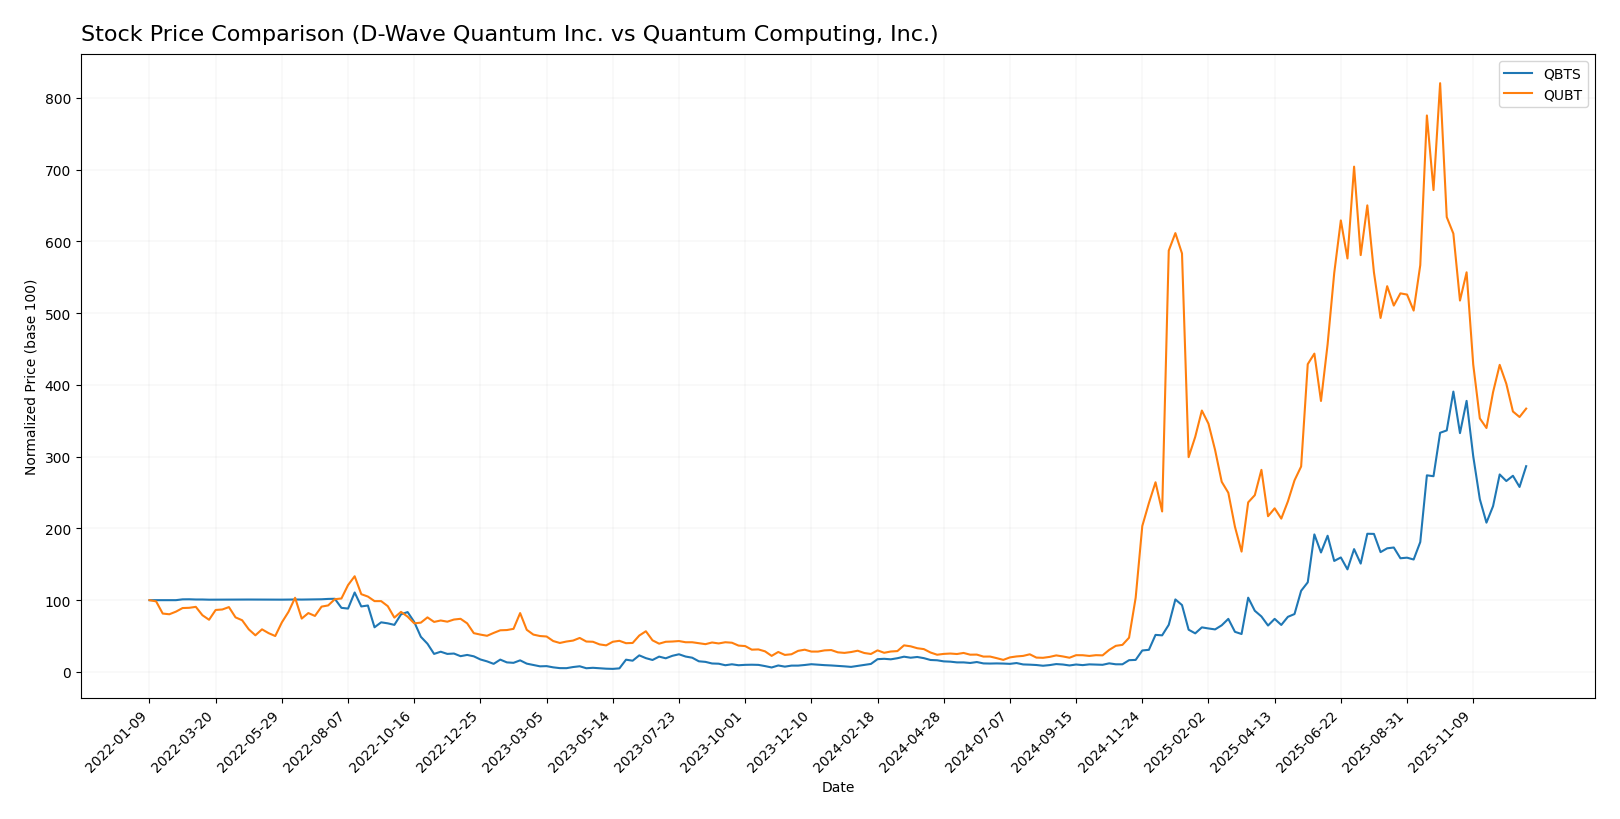
The stock prices of D-Wave Quantum Inc. (QBTS) and Quantum Computing, Inc. (QUBT) exhibited significant bullish trends over the past 12 months, with both showing strong price appreciation followed by recent declines in trading momentum.
Trend Analysis
D-Wave Quantum Inc. (QBTS) posted a 2480.73% price increase over the past year, representing a bullish trend with decelerating momentum. The stock reached a high of 38.33 and a low of 0.84, with recent months showing a 26.61% decline.
Quantum Computing, Inc. (QUBT) gained 1369.18% over the same period, also bullish with deceleration. Its price ranged from 0.5 to 24.62, but it experienced a sharper recent drop of 39.93%.
Comparing the two, QBTS delivered the highest market performance over the past year, significantly outperforming QUBT despite recent downward pressure.
Target Prices
Here is the target price consensus from verified analysts for the two quantum computing companies.
| Company | Target High | Target Low | Consensus |
|---|---|---|---|
| D-Wave Quantum Inc. | 46 | 26 | 38.88 |
| Quantum Computing, Inc. | 40 | 10 | 19.5 |
Analysts expect D-Wave Quantum’s stock to rise significantly above its current price of 28.12 USD, while Quantum Computing, Inc. shows more moderate upside potential from its current 11.01 USD trading level.
Analyst Opinions Comparison
This section compares analysts’ ratings and grades for D-Wave Quantum Inc. (QBTS) and Quantum Computing, Inc. (QUBT):
Rating Comparison
QBTS Rating
- Rating: C- indicating a very favorable overall rating despite weaknesses.
- Discounted Cash Flow Score: 1, very unfavorable, suggesting overvaluation concerns.
- ROE Score: 1, very unfavorable, reflecting low profit efficiency from equity.
- ROA Score: 1, very unfavorable, indicating poor asset utilization.
- Debt To Equity Score: 4, favorable, indicating moderate financial risk.
- Overall Score: 1, very unfavorable, highlighting significant financial challenges.
QUBT Rating
- Rating: C+ with a very favorable overall rating, slightly higher than QBTS.
- Discounted Cash Flow Score: 2, moderate, showing better valuation prospects.
- ROE Score: 1, very unfavorable, same low efficiency in profit generation.
- ROA Score: 1, very unfavorable, similarly weak asset utilization.
- Debt To Equity Score: 5, very favorable, showing stronger balance sheet health.
- Overall Score: 2, moderate, suggesting relatively better financial health.
Which one is the best rated?
Based strictly on the provided data, QUBT has a higher rating (C+) and better scores in discounted cash flow, debt-to-equity, and overall financial health compared to QBTS, which holds a C- rating with generally very unfavorable scores.
Scores Comparison
Here is a comparison of the Altman Z-Score and Piotroski Score for both companies:
D-Wave Quantum Inc. Scores
- Altman Z-Score: 28.11, indicating a strong safe zone.
- Piotroski Score: 4, reflecting an average financial strength.
Quantum Computing, Inc. Scores
- Altman Z-Score: 50.17, indicating a strong safe zone.
- Piotroski Score: 4, reflecting an average financial strength.
Which company has the best scores?
Both companies are firmly in the safe zone for bankruptcy risk according to their Altman Z-Scores, with Quantum Computing, Inc. showing a higher score. Both have identical average Piotroski Scores of 4, indicating similar financial strength.
Grades Comparison
The latest available grades for D-Wave Quantum Inc. and Quantum Computing, Inc. are as follows:
D-Wave Quantum Inc. Grades
The table below summarizes recent grades from established grading companies for D-Wave Quantum Inc.:
| Grading Company | Action | New Grade | Date |
|---|---|---|---|
| Benchmark | Maintain | Buy | 2025-11-10 |
| Rosenblatt | Maintain | Buy | 2025-11-07 |
| Canaccord Genuity | Maintain | Buy | 2025-11-07 |
| Cantor Fitzgerald | Maintain | Overweight | 2025-11-07 |
| B. Riley Securities | Maintain | Buy | 2025-09-22 |
| Piper Sandler | Maintain | Overweight | 2025-08-08 |
| Benchmark | Maintain | Buy | 2025-08-04 |
| B. Riley Securities | Maintain | Buy | 2025-07-23 |
| B. Riley Securities | Maintain | Buy | 2025-06-18 |
| Benchmark | Maintain | Buy | 2025-06-18 |
Overall, D-Wave Quantum Inc. consistently receives Buy or Overweight grades, indicating a stable positive outlook from multiple analysts.
Quantum Computing, Inc. Grades
The recent grades from verifiable grading companies for Quantum Computing, Inc. are shown below:
| Grading Company | Action | New Grade | Date |
|---|---|---|---|
| Ascendiant Capital | Maintain | Buy | 2025-12-22 |
| Cantor Fitzgerald | Maintain | Neutral | 2025-12-18 |
| Lake Street | Maintain | Buy | 2025-11-17 |
| Ascendiant Capital | Maintain | Buy | 2025-10-03 |
| Ascendiant Capital | Maintain | Buy | 2025-06-06 |
| Ascendiant Capital | Maintain | Buy | 2025-04-28 |
| Ascendiant Capital | Maintain | Buy | 2024-11-13 |
| Ascendiant Capital | Maintain | Buy | 2023-11-24 |
Quantum Computing, Inc. mostly holds Buy ratings, with one Neutral from Cantor Fitzgerald, reflecting a generally positive but slightly more cautious sentiment.
Which company has the best grades?
D-Wave Quantum Inc. has a stronger consensus with multiple Buy and Overweight grades from several firms, whereas Quantum Computing, Inc. shows mainly Buy grades with a single Neutral. This suggests D-Wave’s outlook is more uniformly positive, potentially giving investors clearer confidence signals.
Strengths and Weaknesses
Below is a comparative overview of the key strengths and weaknesses for D-Wave Quantum Inc. (QBTS) and Quantum Computing, Inc. (QUBT), based on the most recent financial and operational data.
| Criterion | D-Wave Quantum Inc. (QBTS) | Quantum Computing, Inc. (QUBT) |
|---|---|---|
| Diversification | Moderate: Revenues mainly from Professional Services (1.94M USD in 2024), limited product sales (144K USD) | Low: Single segment revenue from Services Member (346K USD) |
| Profitability | Negative margins and returns; ROIC at -45%, net margin deeply negative; slight improvement trend | Negative profitability; ROIC at -17%, very low net margin; improving ROIC trend but still value destroying |
| Innovation | Leading in quantum computing services with growing ROIC trend indicating potential | Similar innovation stage but smaller scale; growing ROIC trend suggests improving efficiency |
| Global presence | Established presence with professional services focus, but limited scale | Smaller footprint, less diversified market reach |
| Market Share | Niche in quantum computing services, scaling revenues | Smaller market share, concentrated revenue stream |
Key takeaways: Both companies are currently value destroyers with negative profitability, though their ROIC trends are improving. D-Wave Quantum Inc. shows stronger revenue diversification and scale, while Quantum Computing, Inc. operates on a smaller scale with narrower focus. Investors should be cautious and monitor profitability improvements before committing capital.
Risk Analysis
Below is a comparative table summarizing the key risks for D-Wave Quantum Inc. (QBTS) and Quantum Computing, Inc. (QUBT) based on the latest 2024 financial data and market conditions:
| Metric | D-Wave Quantum Inc. (QBTS) | Quantum Computing, Inc. (QUBT) |
|---|---|---|
| Market Risk | Beta 1.56; high volatility in quantum tech sector | Beta 3.80; very high volatility, smaller market cap |
| Debt level | Debt/Equity 0.61; moderate leverage | Debt/Equity 0.01; very low leverage, strong balance sheet |
| Regulatory Risk | Moderate; quantum computing evolving, potential export controls | Moderate; US-based, subject to government contracts and compliance |
| Operational Risk | Medium; 216 employees, scaling quantum hardware and software | High; only 41 employees, dependency on software development |
| Environmental Risk | Low; technology sector, limited physical footprint | Low; primarily software and quantum services |
| Geopolitical Risk | Medium; Canadian base with US operations, cross-border tech tensions | Medium; US-based but exposed to international supply chain risks |
The most impactful risks involve market volatility and operational challenges. QUBT shows much higher market risk with a beta of 3.8 and a smaller market cap (1.5B) compared to QBTS (9.7B), indicating higher price fluctuations and uncertainty. Both companies have unfavorable profitability metrics and weak earnings, highlighting financial vulnerability. QBTS carries moderate debt but benefits from a larger scale, while QUBT’s minimal debt reduces financial risk but its small size and operational capacity pose execution risks. Regulatory and geopolitical uncertainties in quantum technology remain significant but manageable.
Which Stock to Choose?
D-Wave Quantum Inc. (QBTS) shows a mixed financial picture with a slight revenue growth of 0.79% in 2024 but significant net margin and profitability challenges. Its financial ratios reveal mostly unfavorable metrics, including a negative return on equity of -229.67% and a net margin of -1629.99%, though it maintains a strong current ratio of 6.14 and low debt levels. The company is rated C- with a very favorable overall rating, but its global income and ratio evaluations remain unfavorable.
Quantum Computing, Inc. (QUBT) exhibits modest revenue growth of 4.19% in 2024 but also suffers from weak profitability and financial ratios, including a net margin of -18375.87% and a return on equity of -63.89%. The company maintains a very high current ratio of 17.36 and minimal debt, with a C+ rating reflecting a moderate overall score. Despite these strengths, most income and ratio metrics are unfavorable, indicating ongoing financial challenges.
Investors focused on growth and willing to tolerate higher financial risk might find QBTS’s improving ROIC trend and stronger rating more appealing, while those prioritizing balance sheet safety and lower debt exposure may view QUBT’s very favorable debt-to-equity metrics as a positive factor. Both companies currently display unfavorable global income and ratio evaluations, suggesting cautious interpretation of their financial health.
Disclaimer: Investment carries a risk of loss of initial capital. The past performance is not a reliable indicator of future results. Be sure to understand risks before making an investment decision.
Go Further
I encourage you to read the complete analyses of D-Wave Quantum Inc. and Quantum Computing, Inc. to enhance your investment decisions: