NetApp, Inc. and D-Wave Quantum Inc. are two prominent players in the technology sector, both specializing in computer hardware but focusing on distinct innovations. NetApp leads in cloud-led data management and storage solutions, while D-Wave pioneers quantum computing systems with applications in AI and complex problem-solving. This article compares their market positions and innovation strategies to help investors identify the most promising opportunity in this evolving tech landscape.

Table of contents
Companies Overview
I will begin the comparison between NetApp and D-Wave Quantum by providing an overview of these two companies and their main differences.
NetApp Overview
NetApp, Inc. specializes in cloud-led and data-centric services for managing and sharing data across on-premises, private, and public clouds globally. Operating primarily in Hybrid Cloud and Public Cloud segments, NetApp offers intelligent data management software and storage infrastructure solutions. The company serves diverse industries including energy, financial services, government, healthcare, and telecommunications, leveraging a direct sales force and partner ecosystem. It is headquartered in San Jose, California, with a market capitalization of 21.4B USD.
D-Wave Quantum Overview
D-Wave Quantum Inc. develops and delivers quantum computing systems, software, and services worldwide. Its offerings include advanced quantum computers, onboarding services, open-source programming tools, and cloud-based access to live quantum machines. D-Wave’s solutions focus on AI, materials science, drug discovery, scheduling, cybersecurity, and financial modeling. Based in Burnaby, Canada, the company serves manufacturing, logistics, financial services, and life sciences sectors, with a market capitalization of approximately 10B USD.
Key similarities and differences
Both companies operate within the technology sector and computer hardware industry but focus on different niches. NetApp concentrates on data management and cloud storage solutions, supporting a broad range of industries with mature infrastructure products. In contrast, D-Wave Quantum is dedicated to pioneering quantum computing technology and related software, targeting advanced applications in AI and scientific research. NetApp is significantly larger in scale and workforce compared to the smaller, specialized D-Wave Quantum.
Income Statement Comparison
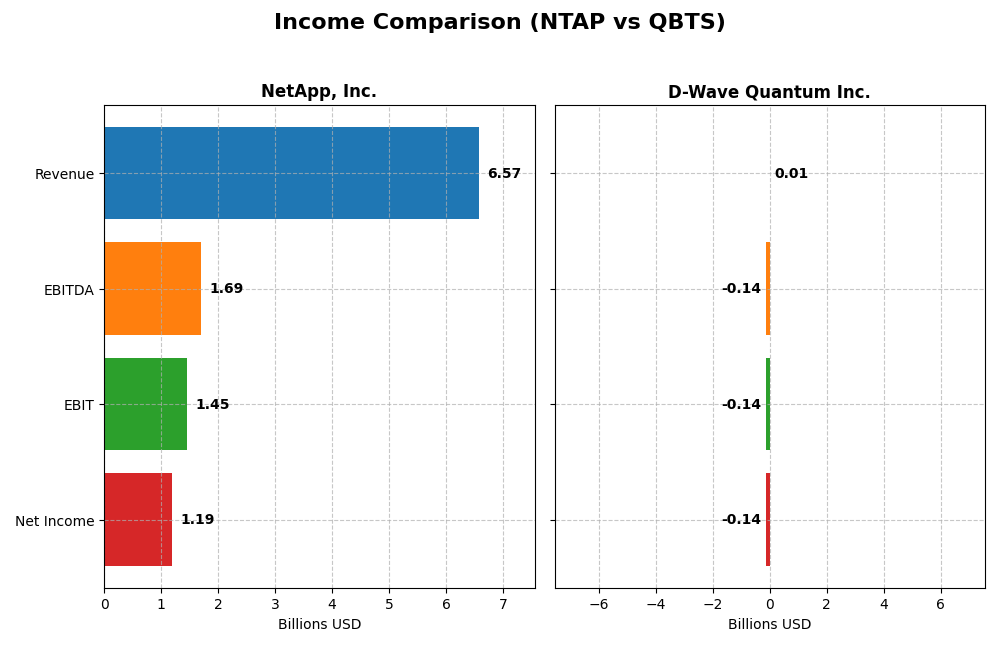
The table below presents a side-by-side comparison of key income statement metrics for NetApp, Inc. and D-Wave Quantum Inc. for their most recent fiscal years.
| Metric | NetApp, Inc. (NTAP) | D-Wave Quantum Inc. (QBTS) |
|---|---|---|
| Market Cap | 21.4B | 10.0B |
| Revenue | 6.57B | 8.83M |
| EBITDA | 1.69B | -138.1M |
| EBIT | 1.45B | -140.0M |
| Net Income | 1.19B | -143.9M |
| EPS | 5.81 | -0.75 |
| Fiscal Year | 2025 | 2024 |
Income Statement Interpretations
NetApp, Inc.
NetApp’s revenue steadily increased from $5.74B in 2021 to $6.57B in 2025, reflecting a 14.42% growth over the period. Net income rose sharply by 62.47%, reaching $1.19B in 2025. Margins improved consistently, with gross margin at 70.19% and net margin at 18.05%. The latest year showed moderate revenue growth of 4.85%, with favorable margin expansion and EPS growth of 22.46%.
D-Wave Quantum Inc.
D-Wave Quantum’s revenue grew from $5.16M in 2020 to $8.83M in 2024, a 71.07% increase. However, net income remained negative, worsening from -$22M to -$144M, reflecting a 554.98% decline. Gross margin was favorable at 63.02%, but EBIT and net margins were deeply negative. The most recent year showed marginal revenue growth of 0.79%, alongside significant declines in EBIT and net margin.
Which one has the stronger fundamentals?
NetApp exhibits stronger fundamentals with consistent revenue and net income growth, improved profitability, and favorable margin trends. In contrast, D-Wave Quantum, despite revenue growth, suffers persistent and worsening losses with unfavorable EBIT and net margins. The overall income statement evaluations favor NetApp’s stability and profitability over D-Wave Quantum’s ongoing negative earnings.
Financial Ratios Comparison
The table below presents the most recent key financial ratios for NetApp, Inc. and D-Wave Quantum Inc. as of their respective fiscal years 2025 and 2024, offering a snapshot of their profitability, liquidity, leverage, and market valuation metrics.
| Ratios | NetApp, Inc. (NTAP) FY 2025 | D-Wave Quantum Inc. (QBTS) FY 2024 |
|---|---|---|
| ROE | 114.0% | -229.7% |
| ROIC | 16.5% | -45.0% |
| P/E | 15.4 | -11.2 |
| P/B | 17.6 | 25.8 |
| Current Ratio | 1.26 | 6.14 |
| Quick Ratio | 1.22 | 6.08 |
| D/E | 3.36 | 0.61 |
| Debt-to-Assets | 32.3% | 19.2% |
| Interest Coverage | 20.9 | -19.8 |
| Asset Turnover | 0.61 | 0.04 |
| Fixed Asset Turnover | 8.17 | 0.77 |
| Payout Ratio | 35.8% | 0% |
| Dividend Yield | 2.32% | 0% |
Interpretation of the Ratios
NetApp, Inc.
NetApp shows a generally strong ratio profile with favorable net margin at 18.05% and a very high return on equity of 114.04%, indicating efficient use of shareholder capital. However, the price-to-book ratio at 17.6 and debt-to-equity of 3.36 are less favorable, suggesting valuation and leverage concerns. The company pays dividends with a 2.32% yield, supported by sustainable payout and free cash flow coverage.
D-Wave Quantum Inc.
D-Wave Quantum’s ratios are mostly weak, with negative net margin (-1629.99%) and very poor returns on equity (-229.67%) and invested capital (-45.01%), reflecting ongoing losses. Its extremely high EV-to-sales ratio (167.02) and high SG&A expenses relative to revenue signal operational inefficiencies. The company does not pay dividends, prioritizing reinvestment and growth in quantum computing technology.
Which one has the best ratios?
NetApp, Inc. clearly presents the more favorable financial ratios, with solid profitability, strong returns, and manageable leverage despite some valuation concerns. D-Wave Quantum struggles with consistent losses, weak returns, and unfavorable operational metrics. Overall, NetApp’s ratios suggest better financial stability and shareholder returns compared to D-Wave’s unfavorable profile.
Strategic Positioning
This section compares the strategic positioning of NetApp and D-Wave Quantum, focusing on market position, key segments, and exposure to technological disruption:
NetApp, Inc.
- Established mid-cap player facing competitive pressure in cloud and data management markets.
- Primary segments: Hybrid Cloud ($5.9B) and Public Cloud ($665M), driven by data management software and cloud services.
- Exposure to disruption is moderate, providing cloud-led software and storage solutions in a competitive tech industry.
D-Wave Quantum Inc.
- Smaller market cap, niche player in emerging quantum computing hardware and software.
- Focus on quantum computing systems, software, and professional services targeting AI and scientific applications.
- High exposure due to operating in quantum computing, an evolving technology with uncertain commercial adoption.
NetApp vs D-Wave Quantum Positioning
NetApp’s approach is diversified across hybrid and public cloud data services, leveraging scale and mature products. D-Wave Quantum concentrates on quantum computing innovation, a niche but potentially transformative sector with significant technological uncertainty and smaller scale.
Which has the best competitive advantage?
NetApp demonstrates a very favorable moat with ROIC exceeding WACC by over 7%, indicating durable value creation. D-Wave Quantum’s moat is slightly unfavorable despite growing ROIC, reflecting ongoing value destruction and higher investment risk.
Stock Comparison
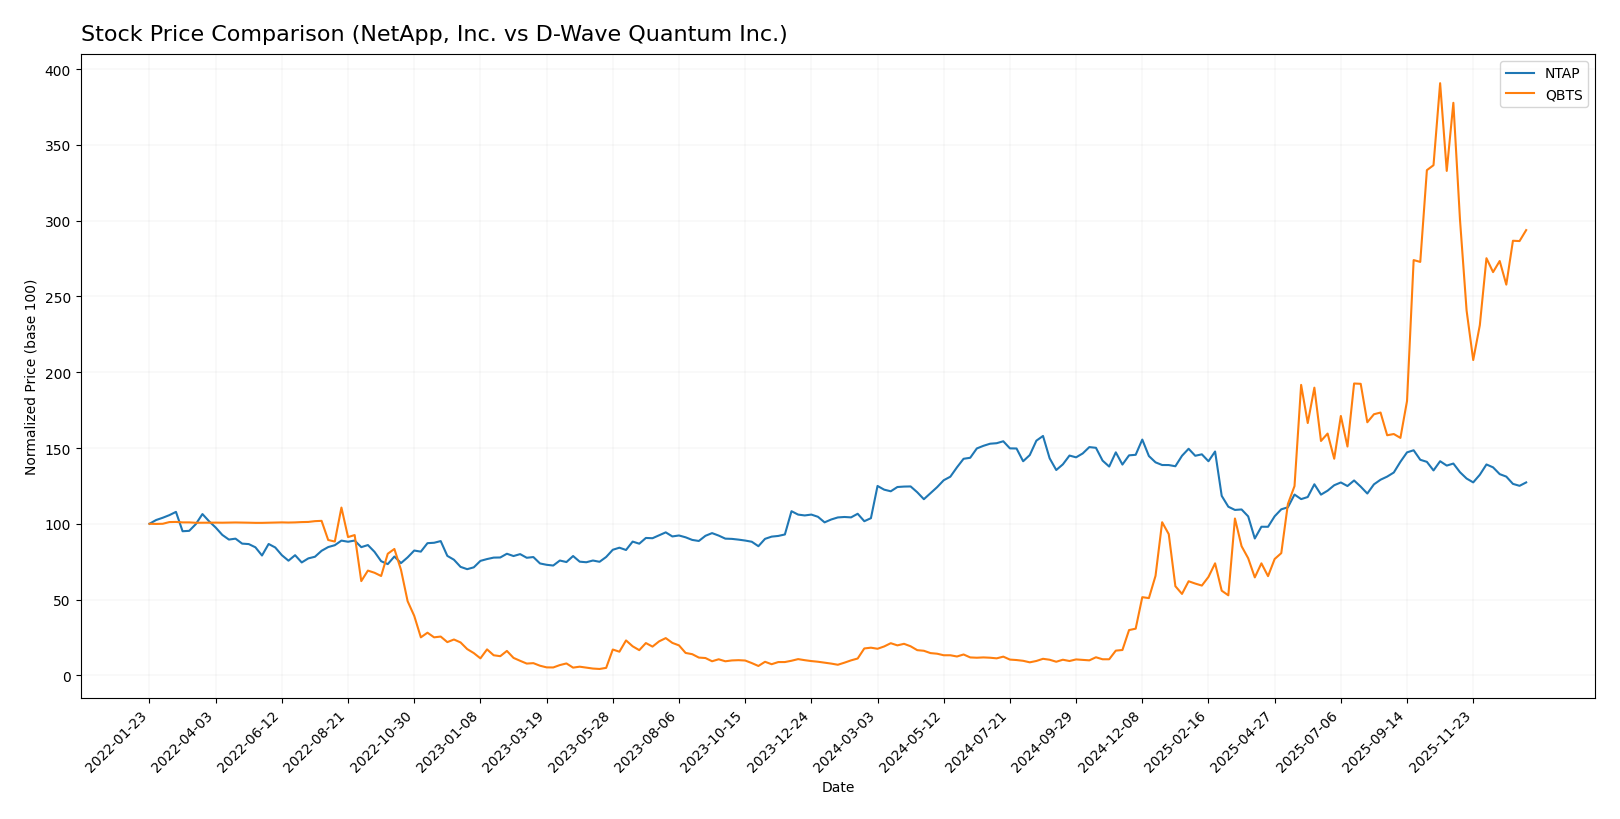
The past year has seen significant price appreciation for both NetApp, Inc. and D-Wave Quantum Inc., with both stocks exhibiting a bullish trend overall despite recent downward pressure in the last quarter.
Trend Analysis
NetApp, Inc. experienced a 22.75% price increase over the past 12 months, indicating a bullish trend with decelerating momentum. The stock ranged between 76.1 and 133.12, showing notable volatility with a standard deviation of 12.21.
D-Wave Quantum Inc. showed a substantial 1510.06% gain over the same period, also bullish with decelerating acceleration. The stock traded between 0.84 and 38.33, with a volatility standard deviation of 10.33.
Comparing the two, D-Wave Quantum Inc. delivered a significantly higher market performance than NetApp, Inc., reflecting stronger overall price appreciation despite both stocks facing recent declines.
Target Prices
The target price consensus for NetApp, Inc. and D-Wave Quantum Inc. reflects moderate optimism from analysts.
| Company | Target High | Target Low | Consensus |
|---|---|---|---|
| NetApp, Inc. | 137 | 115 | 125.17 |
| D-Wave Quantum Inc. | 46 | 26 | 38.88 |
Analysts expect NetApp’s stock to appreciate from its current price of $107.28 toward a consensus target of $125.17, indicating a potential upside. D-Wave Quantum’s consensus target of $38.88 is also above its current price of $28.84, suggesting growth expectations.
Analyst Opinions Comparison
This section compares analysts’ ratings and grades for NetApp, Inc. (NTAP) and D-Wave Quantum Inc. (QBTS):
Rating Comparison
NTAP Rating
- Rated B+ with an overall moderate score of 3, indicating a balanced financial standing.
- Discounted Cash Flow Score: 4, favorable outlook on valuation based on future cash flows.
- Return on Equity Score: 5, very favorable, showing strong profit generation from equity.
- Return on Assets Score: 5, very favorable, demonstrating effective asset utilization.
- Debt To Equity Score: 1, very unfavorable, indicating high financial leverage risk.
QBTS Rating
- Rated C- with a very unfavorable overall score of 1, reflecting weak financials.
- Discounted Cash Flow Score: 1, very unfavorable, suggesting poor valuation prospects.
- Return on Equity Score: 1, very unfavorable, indicating weak profitability.
- Return on Assets Score: 1, very unfavorable, reflecting inefficient asset use.
- Debt To Equity Score: 4, favorable, showing lower financial risk from debt.
Which one is the best rated?
Based strictly on the provided data, NTAP is better rated overall with higher scores in valuation, profitability, and asset use despite its weak debt position. QBTS shows generally unfavorable ratings except for a stronger debt-to-equity score.
Scores Comparison
Here is a comparison of the Altman Z-Score and Piotroski Score for both companies:
NetApp, Inc. Scores
- Altman Z-Score: 2.86, in the grey zone, moderate bankruptcy risk.
- Piotroski Score: 7, strong financial strength indicating good value.
D-Wave Quantum Inc. Scores
- Altman Z-Score: 28.11, in the safe zone, low bankruptcy risk.
- Piotroski Score: 4, average financial strength with moderate value.
Which company has the best scores?
D-Wave Quantum Inc. has a significantly higher Altman Z-Score indicating lower bankruptcy risk, but NetApp, Inc. shows a stronger Piotroski Score reflecting better financial strength. Scores favor different risk and value aspects.
Grades Comparison
Here is a comparison of the latest grades assigned to NetApp, Inc. and D-Wave Quantum Inc. by recognized grading companies:
NetApp, Inc. Grades
The table below lists recent grades given by established financial institutions for NetApp, Inc.:
| Grading Company | Action | New Grade | Date |
|---|---|---|---|
| Barclays | Maintain | Overweight | 2025-11-26 |
| Wells Fargo | Maintain | Equal Weight | 2025-11-26 |
| Northland Capital Markets | Upgrade | Outperform | 2025-11-26 |
| B of A Securities | Maintain | Neutral | 2025-11-26 |
| UBS | Maintain | Neutral | 2025-11-26 |
| Citigroup | Maintain | Neutral | 2025-11-12 |
| Citigroup | Maintain | Neutral | 2025-10-16 |
| Argus Research | Maintain | Buy | 2025-08-29 |
| UBS | Maintain | Neutral | 2025-08-28 |
| Barclays | Maintain | Overweight | 2025-08-28 |
NetApp’s grades reflect a generally neutral to moderately positive outlook, with several firms maintaining Overweight or Buy ratings and one notable upgrade to Outperform.
D-Wave Quantum Inc. Grades
Here is a summary of the recent grades assigned to D-Wave Quantum Inc. by reputable grading firms:
| Grading Company | Action | New Grade | Date |
|---|---|---|---|
| Rosenblatt | Maintain | Buy | 2026-01-08 |
| Rosenblatt | Maintain | Buy | 2026-01-07 |
| Benchmark | Maintain | Buy | 2025-11-10 |
| Rosenblatt | Maintain | Buy | 2025-11-07 |
| Canaccord Genuity | Maintain | Buy | 2025-11-07 |
| Cantor Fitzgerald | Maintain | Overweight | 2025-11-07 |
| B. Riley Securities | Maintain | Buy | 2025-09-22 |
| Piper Sandler | Maintain | Overweight | 2025-08-08 |
| Benchmark | Maintain | Buy | 2025-08-04 |
| B. Riley Securities | Maintain | Buy | 2025-07-23 |
Grades for D-Wave Quantum Inc. consistently show strong Buy and Overweight ratings, indicating a positive consensus among analysts.
Which company has the best grades?
D-Wave Quantum Inc. has received consistently stronger grades compared to NetApp, Inc., with multiple Buy and Overweight ratings versus NetApp’s predominantly Neutral and Hold consensus. This suggests higher analyst confidence in D-Wave’s growth prospects, which may influence investor sentiment toward higher potential returns but possibly increased risk exposure.
Strengths and Weaknesses
Below is a comparison of key strengths and weaknesses of NetApp, Inc. (NTAP) and D-Wave Quantum Inc. (QBTS) based on the most recent financial and operational data.
| Criterion | NetApp, Inc. (NTAP) | D-Wave Quantum Inc. (QBTS) |
|---|---|---|
| Diversification | Strong focus on Hybrid Cloud and Public Cloud segments with steady growth in hybrid cloud revenue (5.9B in 2025). | Limited revenue sources, mainly Professional Services (1.9M in 2024) and minimal product sales. |
| Profitability | High profitability with net margin at 18.05% and ROIC of 16.49%, creating value efficiently. | Negative profitability, net margin at -1630%, ROIC at -45%, indicating value destruction. |
| Innovation | Consistent investment in cloud solutions and software maintenance, maintaining competitive edge. | Focus on quantum computing innovation but with high costs and negative returns so far. |
| Global presence | Established global footprint with diversified cloud services and large enterprise client base. | Emerging global presence but still limited scale and market adoption. |
| Market Share | Significant market share in storage and cloud infrastructure markets. | Niche player in quantum computing with limited market penetration. |
NetApp shows strong diversification and profitability, driven by its hybrid cloud services and efficient capital use, signaling a durable competitive advantage. Conversely, D-Wave Quantum, while innovative, struggles with negative profitability and limited revenue diversification, posing higher risks for investors.
Risk Analysis
Below is a comparison of key risks for NetApp, Inc. (NTAP) and D-Wave Quantum Inc. (QBTS) based on the most recent data:
| Metric | NetApp, Inc. (NTAP) | D-Wave Quantum Inc. (QBTS) |
|---|---|---|
| Market Risk | Beta 1.37, moderate volatility | Beta 1.56, higher volatility |
| Debt level | DE ratio 3.36, unfavorable (high leverage) | DE ratio 0.61, favorable (low leverage) |
| Regulatory Risk | Moderate, US tech sector regulations | Moderate, quantum tech emerging regulation |
| Operational Risk | Medium, large scale cloud services | High, early-stage tech and small size |
| Environmental Risk | Moderate, cloud infrastructure impact | Low, small operations footprint |
| Geopolitical Risk | Moderate, US-based with global exposure | Moderate, Canadian base with global clients |
The most impactful risks are operational and financial leverage for NetApp, given its high debt-to-equity ratio, which could pressure profitability if conditions worsen. For D-Wave, operational risk is highest due to its early-stage quantum technology and smaller scale, posing execution and market adoption challenges despite low debt. Investors should monitor leverage for NTAP and execution risks for QBTS closely.
Which Stock to Choose?
NetApp, Inc. (NTAP) shows favorable income evolution with steady revenue and net income growth, strong profitability, and manageable debt. Its financial ratios are slightly favorable overall, supported by a very favorable rating and a durable competitive advantage.
D-Wave Quantum Inc. (QBTS) exhibits unfavorable income trends, including negative net margin and declining profitability despite revenue growth. Its financial ratios are mostly unfavorable, with a very unfavorable rating, indicating ongoing value destruction despite improving profitability.
For investors focused on stability and quality, NTAP might appear more favorable due to its consistent value creation and strong financial metrics. Conversely, those with a higher risk tolerance and interest in emerging technologies could interpret QBTS’s rapid price appreciation and growth potential as appealing despite its financial challenges.
Disclaimer: Investment carries a risk of loss of initial capital. The past performance is not a reliable indicator of future results. Be sure to understand risks before making an investment decision.
Go Further
I encourage you to read the complete analyses of NetApp, Inc. and D-Wave Quantum Inc. to enhance your investment decisions: