HP Inc. and D-Wave Quantum Inc. operate within the computer hardware industry but represent distinctly different technological frontiers. HP Inc. is a well-established leader in personal computing and printing solutions, while D-Wave Quantum pioneers quantum computing systems and software. Their overlap in hardware innovation and future-facing strategies makes this comparison particularly relevant. Join me as we analyze which company presents a more compelling opportunity for investors in 2026.
Table of contents
Companies Overview
I will begin the comparison between HP Inc. and D-Wave Quantum Inc. by providing an overview of these two companies and their main differences.
HP Inc. Overview
HP Inc. is a well-established technology company founded in 1939 and headquartered in Palo Alto, California. It operates globally, providing personal computing devices, imaging, and printing products along with related technologies and services. HP serves a diverse customer base including individual consumers, small and medium businesses, and large enterprises across sectors such as government, health, and education.
D-Wave Quantum Inc. Overview
D-Wave Quantum Inc., based in Burnaby, Canada, specializes in quantum computing systems, software, and services. Founded more recently, it offers cutting-edge products like the Advantage quantum computer and cloud-based access through Leap. Its solutions support various industries including manufacturing, financial services, life sciences, and logistics, emphasizing applications in AI, drug discovery, cybersecurity, and financial modeling.
Key similarities and differences
Both companies operate in the technology sector with a focus on computer hardware, but their business models differ significantly. HP Inc. offers traditional personal computing and printing solutions targeting a broad market, while D-Wave focuses on advanced quantum computing technologies with specialized software and cloud services. HP is a long-established firm with a large workforce, whereas D-Wave is a smaller, newer company targeting niche, high-tech markets.
Income Statement Comparison
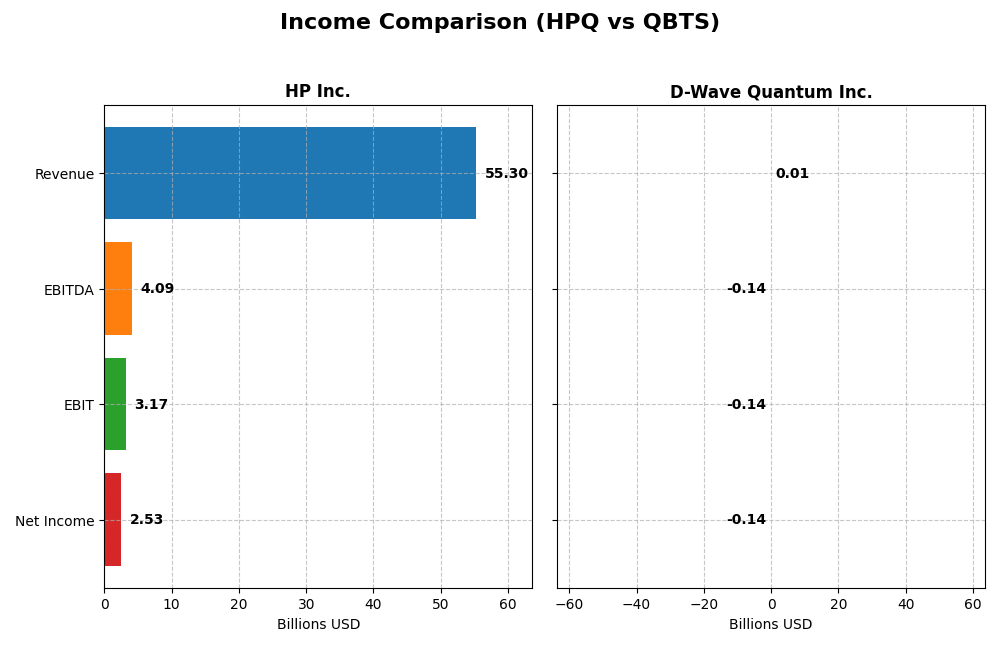
The table below compares the key income statement metrics for HP Inc. and D-Wave Quantum Inc. for their most recent fiscal years, providing a clear side-by-side financial snapshot.
| Metric | HP Inc. (2025) | D-Wave Quantum Inc. (2024) |
|---|---|---|
| Market Cap | 19.7B | 10.0B |
| Revenue | 55.3B | 8.8M |
| EBITDA | 4.1B | -138.1M |
| EBIT | 3.2B | -140.0M |
| Net Income | 2.5B | -144.0M |
| EPS | 2.67 | -0.75 |
| Fiscal Year | 2025 | 2024 |
Income Statement Interpretations
HP Inc.
HP Inc.’s revenue showed a declining trend over 2021-2025, dropping from $63.5B to $55.3B, with net income also decreasing from $6.5B to $2.5B. Margins have contracted, with gross margin at 20% and net margin at 4.6% in 2025. The latest year saw modest revenue growth of 3.2%, but profitability and margins weakened, reflecting margin pressure and lower earnings.
D-Wave Quantum Inc.
D-Wave Quantum experienced revenue growth overall, rising from $5.2M in 2020 to $8.8M in 2024, but net losses deepened, with net income falling from -$22M to -$144M. Gross margin was strong at 63%, yet EBIT and net margins remained heavily negative, exceeding -1500%. The most recent year showed slight revenue improvement but worsening EBIT and net margin, indicating ongoing operational challenges.
Which one has the stronger fundamentals?
Both companies face unfavorable income statement evaluations overall, but HP Inc. demonstrates a larger scale with positive net income and stable albeit declining margins. D-Wave Quantum shows favorable revenue growth and gross margins but suffers from significant losses and poor profitability ratios. HP Inc.’s fundamentals appear more stable in comparison, while D-Wave’s remain under pressure from sustained negative earnings.
Financial Ratios Comparison
The table below presents a side-by-side comparison of key financial ratios for HP Inc. and D-Wave Quantum Inc., reflecting the most recent fiscal year data available.
| Ratios | HP Inc. (2025) | D-Wave Quantum Inc. (2024) |
|---|---|---|
| ROE | -7.31% | -2.30% |
| ROIC | 24.97% | -45.01% |
| P/E | 10.35 | -11.22 |
| P/B | -75.65 | 25.76 |
| Current Ratio | 0.77 | 6.14 |
| Quick Ratio | 0.48 | 6.08 |
| D/E (Debt-to-Equity) | -31.45 | 0.61 |
| Debt-to-Assets | 26.05% | 19.20% |
| Interest Coverage | 7.16 | -19.82 |
| Asset Turnover | 1.32 | 0.04 |
| Fixed Asset Turnover | 13.23 | 0.77 |
| Payout ratio | 43.02% | 0 |
| Dividend yield | 4.16% | 0 |
Interpretation of the Ratios
HP Inc.
HP Inc. shows a majority of favorable ratios, with strong ROIC at 24.97% and a low WACC of 7.6%, indicating efficient capital use and moderate risk. However, its negative ROE (-730.92%) and low liquidity ratios (current ratio 0.77, quick ratio 0.48) raise concerns about profitability and short-term financial health. The company maintains a dividend yield of 4.16%, supported by consistent payouts and moderate payout ratios.
D-Wave Quantum Inc.
D-Wave Quantum’s ratios reveal significant weaknesses, including a highly negative net margin (-1629.99%) and ROIC (-45.01%), reflecting ongoing losses and inefficient capital deployment. The firm’s very high current ratio (6.14) contrasts with poor asset turnover, indicating underutilized assets. It does not pay dividends, consistent with its growth phase and reinvestment focus, prioritizing R&D and development over shareholder returns.
Which one has the best ratios?
HP Inc. demonstrates superior financial health with a predominantly favorable ratio profile and dividend yield, despite some liquidity challenges. In contrast, D-Wave Quantum exhibits mostly unfavorable ratios, reflecting operational losses and capital inefficiencies. Based on these evaluations, HP Inc. has the more robust and balanced financial ratios among the two companies.
Strategic Positioning
This section compares the strategic positioning of HP Inc. and D-Wave Quantum Inc., including market position, key segments, and exposure to technological disruption:
HP Inc.
- Large established market cap with moderate competitive pressure in computer hardware.
- Focused on Personal Systems, Printing, and Corporate Investments segments.
- Moderate exposure to technological disruption through Corporate Investments and innovation labs.
D-Wave Quantum Inc.
- Smaller market cap with higher beta, facing emerging quantum computing competition.
- Concentrated on quantum computing systems, software, and professional services.
- High exposure to technological disruption as a pioneer in quantum computing technology.
HP Inc. vs D-Wave Quantum Inc. Positioning
HP Inc. operates a diversified business model spanning personal computing and printing, while D-Wave Quantum Inc. concentrates on quantum computing technology and services. HP benefits from scale but faces mature market challenges; D-Wave targets a niche with growth potential yet smaller revenues.
Which has the best competitive advantage?
HP Inc. shows a slightly favorable moat with value creation despite declining profitability. D-Wave Quantum Inc. has a slightly unfavorable moat, shedding value but improving profitability. HP currently holds a more stable competitive advantage based on MOAT evaluation.
Stock Comparison
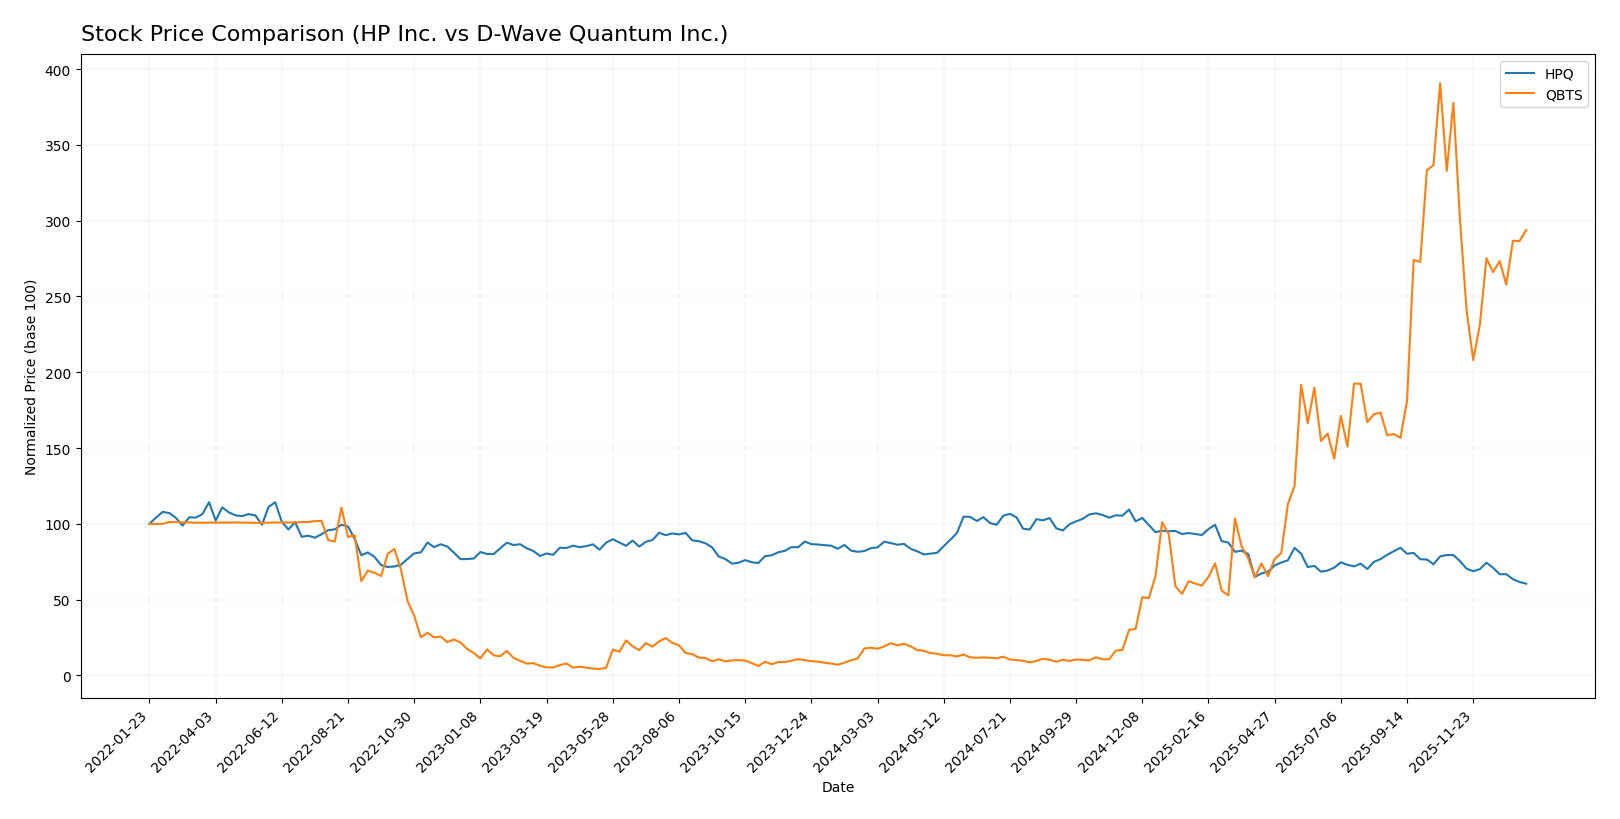
The stock price movements over the past 12 months reveal contrasting dynamics, with HP Inc. experiencing a significant downturn while D-Wave Quantum Inc. posted a remarkable surge before a recent pullback period.
Trend Analysis
HP Inc. (HPQ) showed a bearish trend over the past year with a -27.98% price change, accompanied by deceleration and moderate volatility (std deviation 4.65). The stock peaked at 38.13 and bottomed at 21.08.
D-Wave Quantum Inc. (QBTS) exhibited a strong bullish trend with a 1510.06% increase over the past year, though it also experienced deceleration and higher volatility (std deviation 10.33). Its price ranged from 0.84 to 38.33.
Comparing the two, QBTS delivered the highest market performance with a substantial positive return, whereas HPQ faced a marked decline over the same period.
Target Prices
Analysts present a clear consensus on target prices for HP Inc. and D-Wave Quantum Inc., indicating growth potential.
| Company | Target High | Target Low | Consensus |
|---|---|---|---|
| HP Inc. | 30 | 20 | 24.8 |
| D-Wave Quantum Inc. | 46 | 26 | 38.88 |
The consensus target for HP Inc. at 24.8 USD suggests a moderate upside from its current price of 21.08 USD. D-Wave Quantum’s target consensus of 38.88 USD indicates a significant potential increase above its current 28.84 USD price, reflecting bullish analyst expectations.
Analyst Opinions Comparison
This section compares analysts’ ratings and grades for HP Inc. and D-Wave Quantum Inc.:
Rating Comparison
HPQ Rating
- Rating: B- with a very favorable status, indicating relatively strong analyst confidence.
- Discounted Cash Flow Score: 4, favorable, suggesting good valuation prospects.
- ROE Score: 1, very unfavorable, showing weak profitability from equity.
- ROA Score: 4, favorable, reflecting efficient asset utilization.
- Debt To Equity Score: 1, very unfavorable, implying higher financial risk.
- Overall Score: 2, moderate, suggesting average overall financial health.
QBTS Rating
- Rating: C- also marked very favorable, but lower than HPQ’s rating.
- Discounted Cash Flow Score: 1, very unfavorable, indicating poor valuation outlook.
- ROE Score: 1, very unfavorable, similarly weak equity profitability.
- ROA Score: 1, very unfavorable, indicating inefficient asset use.
- Debt To Equity Score: 4, favorable, indicating strong balance sheet management.
- Overall Score: 1, very unfavorable, reflecting weaker overall financial condition.
Which one is the best rated?
HP Inc. is better rated overall, with a higher rating of B- and favorable scores in discounted cash flow and asset utilization. D-Wave Quantum Inc. shows weaker scores except for a favorable debt-to-equity score, resulting in a lower overall rating.
Scores Comparison
Here is a comparison of the Altman Z-Score and Piotroski Score for HP Inc. and D-Wave Quantum Inc.:
HPQ Scores
- Altman Z-Score: 1.60, in distress zone, high bankruptcy risk
- Piotroski Score: 6, average financial strength
QBTS Scores
- Altman Z-Score: 28.11, in safe zone, very low bankruptcy risk
- Piotroski Score: 4, average financial strength
Which company has the best scores?
Based strictly on the provided data, QBTS has a significantly better Altman Z-Score indicating strong financial stability, while both companies show average Piotroski Scores. Overall, QBTS scores higher on bankruptcy risk assessment.
Grades Comparison
Here is a comparison of the recent grading data available for HP Inc. and D-Wave Quantum Inc.:
HP Inc. Grades
The following table summarizes the latest grades from major financial institutions for HP Inc.:
| Grading Company | Action | New Grade | Date |
|---|---|---|---|
| Goldman Sachs | Maintain | Neutral | 2025-11-26 |
| Evercore ISI Group | Maintain | In Line | 2025-11-26 |
| Citigroup | Maintain | Neutral | 2025-11-26 |
| Morgan Stanley | Maintain | Underweight | 2025-11-26 |
| JP Morgan | Maintain | Neutral | 2025-11-26 |
| Barclays | Maintain | Equal Weight | 2025-11-26 |
| TD Cowen | Maintain | Hold | 2025-11-26 |
| UBS | Maintain | Neutral | 2025-11-26 |
| Morgan Stanley | Maintain | Underweight | 2025-11-21 |
| B of A Securities | Maintain | Neutral | 2025-11-21 |
HP Inc.’s grades consistently indicate a cautious stance with a prevailing neutral or hold consensus, and some underweight recommendations.
D-Wave Quantum Inc. Grades
The table below shows the recent grading data for D-Wave Quantum Inc.:
| Grading Company | Action | New Grade | Date |
|---|---|---|---|
| Rosenblatt | Maintain | Buy | 2026-01-08 |
| Rosenblatt | Maintain | Buy | 2026-01-07 |
| Benchmark | Maintain | Buy | 2025-11-10 |
| Rosenblatt | Maintain | Buy | 2025-11-07 |
| Canaccord Genuity | Maintain | Buy | 2025-11-07 |
| Cantor Fitzgerald | Maintain | Overweight | 2025-11-07 |
| B. Riley Securities | Maintain | Buy | 2025-09-22 |
| Piper Sandler | Maintain | Overweight | 2025-08-08 |
| Benchmark | Maintain | Buy | 2025-08-04 |
| B. Riley Securities | Maintain | Buy | 2025-07-23 |
D-Wave Quantum Inc. shows a strong buy consensus with repeated buy and overweight grades, indicating confidence from several analysts.
Which company has the best grades?
D-Wave Quantum Inc. has received notably stronger and more positive grades compared to HP Inc., which primarily holds neutral or underweight ratings. This difference may influence investor sentiment by suggesting higher growth expectations for D-Wave Quantum Inc. and more caution for HP Inc.
Strengths and Weaknesses
Below is a comparison of key strengths and weaknesses for HP Inc. (HPQ) and D-Wave Quantum Inc. (QBTS) based on the latest financial and operational data.
| Criterion | HP Inc. (HPQ) | D-Wave Quantum Inc. (QBTS) |
|---|---|---|
| Diversification | High: Strong revenue from Personal Systems ($38.5B) and Printing ($16.7B) segments with corporate investments | Low: Revenue mainly from Professional Services ($1.94M) and limited product sales ($144K) |
| Profitability | Moderate: ROIC 25%, positive but declining trend, net margin 4.57%, some unfavorable ratios | Low: Negative ROIC (-45%), large net loss margins (-1630%), improving ROIC trend but value destroying |
| Innovation | Established tech with steady product upgrades; moderate investment in innovation | High potential quantum computing innovation but early stage with unprofitable results |
| Global presence | Strong global footprint with broad market reach | Limited scale and market presence, niche quantum computing sector |
| Market Share | Significant share in personal systems and printing markets | Emerging player with very small market share in quantum computing |
Key takeaways: HP Inc. demonstrates strong diversification and solid profitability despite a declining ROIC trend, reflecting a mature but competitive business. D-Wave Quantum shows promising innovation and improving profitability metrics but remains unprofitable with limited diversification and scale. Investors should weigh HP’s stable cash flows against QBTS’s growth potential and higher risk.
Risk Analysis
The following table summarizes key risks for HP Inc. and D-Wave Quantum Inc. as of their latest fiscal years.
| Metric | HP Inc. (HPQ) | D-Wave Quantum Inc. (QBTS) |
|---|---|---|
| Market Risk | Beta 1.22, moderate volatility | Beta 1.56, higher volatility |
| Debt Level | Low debt-to-assets 26.05%, favorable | Moderate debt-to-assets 19.2%, favorable |
| Regulatory Risk | US-focused, moderate tech regulation | Emerging tech, regulatory uncertainty in quantum computing |
| Operational Risk | Large scale operations, supply chain complexity | Small company, operational scaling risks |
| Environmental Risk | Moderate, printing division impact | Low direct environmental impact |
| Geopolitical Risk | US-based, exposure to global trade tensions | Canadian base, international market exposure |
HP Inc. faces moderate market and operational risks due to its scale and competitive environment, but benefits from stable debt levels and dividend yield. D-Wave Quantum carries higher market volatility and regulatory uncertainty inherent in emerging quantum computing, though it has low debt and environmental risks. The most impactful risks lie in QBTS’s earnings volatility and HPQ’s operational challenges.
Which Stock to Choose?
HP Inc. (HPQ) shows a slightly declining income trend with mixed growth metrics, including a negative net margin growth over recent years. Its financial ratios are mostly favorable, indicating good asset turnover and a solid debt profile, though profitability and liquidity ratios show some weaknesses. The company’s rating is very favorable overall despite a moderate score on return on equity.
D-Wave Quantum Inc. (QBTS) exhibits strong revenue growth but suffers from significant net losses and negative profitability metrics. Its financial ratios are predominantly unfavorable, with poor returns on capital and a high weighted average cost of capital. Despite a very favorable rating, key scores indicate financial distress and weak operational performance.
For investors, HPQ could appear more suitable for those prioritizing value creation and a stable financial structure, given its positive moat and mostly favorable ratios. Conversely, QBTS might be interpreted as fitting for risk-tolerant investors willing to engage in a high-growth, speculative quantum computing play despite ongoing financial challenges.
Disclaimer: Investment carries a risk of loss of initial capital. The past performance is not a reliable indicator of future results. Be sure to understand risks before making an investment decision.
Go Further
I encourage you to read the complete analyses of HP Inc. and D-Wave Quantum Inc. to enhance your investment decisions: