In the fast-evolving technology sector, Dell Technologies Inc. and D-Wave Quantum Inc. stand out for their innovative approaches to computing hardware. Dell, a well-established giant, focuses on traditional and next-generation IT infrastructure, while D-Wave pioneers quantum computing solutions with cutting-edge applications. Comparing these companies reveals contrasting strategies and growth potentials. Join me as we analyze which company presents the most compelling opportunity for your investment portfolio.

Table of contents
Companies Overview
I will begin the comparison between Dell Technologies Inc. and D-Wave Quantum Inc. by providing an overview of these two companies and their main differences.
Dell Technologies Inc. Overview
Dell Technologies Inc. designs, develops, manufactures, markets, sells, and supports IT solutions, products, and services globally. Operating through three segments—Infrastructure Solutions Group, Client Solutions Group, and VMware—it offers storage, servers, networking, desktops, workstations, and cloud software, among others. Founded in 1984 and headquartered in Round Rock, Texas, Dell is a major player in computer hardware and IT infrastructure modernization.
D-Wave Quantum Inc. Overview
D-Wave Quantum Inc. specializes in quantum computing systems, software, and services worldwide. It provides fifth-generation quantum computers, onboarding services, and open-source programming tools used in AI, materials science, drug discovery, and financial modeling. Founded recently and based in Burnaby, Canada, D-Wave targets industries such as manufacturing, logistics, and life sciences with advanced quantum solutions.
Key similarities and differences
Both Dell and D-Wave operate in the technology sector within the computer hardware industry, but their business models differ substantially. Dell focuses on traditional IT infrastructure and cloud solutions, supporting a broad enterprise market with extensive hardware and software offerings. In contrast, D-Wave concentrates on quantum computing technologies and related professional services, addressing niche markets with innovative applications in emerging fields. Their scale and employee counts also highlight Dell’s larger, more diversified operation compared to D-Wave’s specialized focus.
Income Statement Comparison
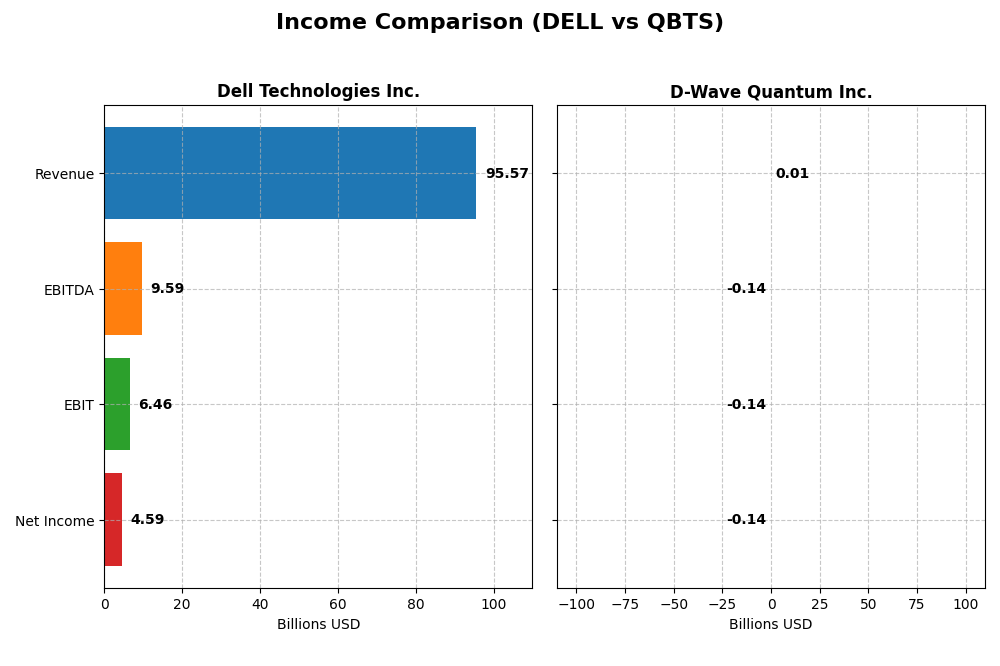
The table below presents a side-by-side comparison of key income statement metrics for Dell Technologies Inc. and D-Wave Quantum Inc. for their most recent fiscal years.
| Metric | Dell Technologies Inc. | D-Wave Quantum Inc. |
|---|---|---|
| Market Cap | 80.2B | 10.0B |
| Revenue | 95.6B | 8.8M |
| EBITDA | 9.6B | -138.1M |
| EBIT | 6.5B | -140.0M |
| Net Income | 4.6B | -143.9M |
| EPS | 6.51 | -0.75 |
| Fiscal Year | 2025 | 2024 |
Income Statement Interpretations
Dell Technologies Inc.
Dell Technologies showed steady revenue growth from 2021 to 2025, increasing from $86.7B to $95.6B, with net income rising significantly from $3.2B to $4.6B. Gross margins remained favorable at 22.24%, while EBIT and net margins were neutral but stable. The 2025 year saw an 8.1% revenue growth and a 25.4% net margin improvement, reflecting stronger profitability.
D-Wave Quantum Inc.
D-Wave Quantum’s revenue increased from $5.2M in 2020 to $8.8M in 2024, showing growth but with persistent net losses, reaching -$144M in 2024. Despite a favorable gross margin of 63.02%, EBIT and net margins were heavily negative, with a significant deterioration in profitability in 2024. Revenue growth slowed to 0.8% in the latest year while net margin and EPS declined further.
Which one has the stronger fundamentals?
Dell Technologies exhibits stronger fundamentals with consistent revenue and net income growth, favorable gross margin, and improving net margin and EPS. In contrast, D-Wave Quantum, despite revenue increases, suffers from large negative margins and net losses, signaling operational challenges. Dell’s income statement presents a more favorable and stable financial profile overall.
Financial Ratios Comparison
The table below presents a side-by-side comparison of key financial ratios for Dell Technologies Inc. and D-Wave Quantum Inc. based on the most recent fiscal year data available.
| Ratios | Dell Technologies Inc. (2025) | D-Wave Quantum Inc. (2024) |
|---|---|---|
| ROE | -3.10% | -229.67% |
| ROIC | 14.71% | -45.01% |
| P/E | 15.7 | -11.22 |
| P/B | -48.66 | 25.76 |
| Current Ratio | 0.78 | 6.14 |
| Quick Ratio | 0.63 | 6.08 |
| D/E | -16.58 | 0.61 |
| Debt-to-Assets | 30.81% | 19.20% |
| Interest Coverage | 4.41 | -19.82 |
| Asset Turnover | 1.20 | 0.044 |
| Fixed Asset Turnover | 15.08 | 0.77 |
| Payout ratio | 27.77% | 0% |
| Dividend yield | 1.77% | 0% |
Interpretation of the Ratios
Dell Technologies Inc.
Dell shows a mixed ratio profile with some strengths in return on invested capital (14.7%) and asset turnover (1.2), but concerns arise from weak net margin (4.8%) and negative return on equity (-310%). The current and quick ratios below 1 indicate liquidity constraints. Dell pays dividends with a moderate yield of 1.77%, supported by free cash flow coverage, suggesting measured shareholder returns without excessive risk from payouts or buybacks.
D-Wave Quantum Inc.
D-Wave Quantum’s ratios reflect significant challenges, including deeply negative net margin (-1630%) and returns on equity (-230%) and invested capital (-45%), alongside poor asset turnover (0.04). The company does not pay dividends, consistent with its negative earnings and high R&D spending (around 4% of revenue), focusing on growth and innovation rather than shareholder payouts. Liquidity appears ample with a high current ratio (6.14), despite unfavorable interest coverage.
Which one has the best ratios?
Dell Technologies presents a slightly favorable ratio set with balanced profitability and cash flow metrics, despite liquidity weaknesses and negative equity returns. In contrast, D-Wave Quantum’s ratios are largely unfavorable, marked by deep losses and low efficiency. Based strictly on ratio analysis, Dell’s financials appear more stable and supportive of operational sustainability.
Strategic Positioning
This section compares the strategic positioning of Dell and D-Wave Quantum, including market position, key segments, and exposure to technological disruption:
Dell
- Leading global IT solutions provider facing strong competition in computer hardware.
- Diversified segments: Client Solutions, Infrastructure Solutions, VMware cloud services.
- Moderate exposure with cloud and hybrid IT innovation, facing evolving tech landscape.
D-Wave Quantum
- Emerging quantum computing firm with niche market presence and high competition risk.
- Focused on quantum computing systems, software, and professional services.
- High exposure as a pioneer in quantum computing, a disruptive technology field.
Dell vs D-Wave Quantum Positioning
Dell’s diversified business model spans multiple IT segments with established market presence, offering stability and broad revenue sources. D-Wave concentrates on quantum computing, which offers high growth potential but with niche application and market uncertainty.
Which has the best competitive advantage?
Dell holds a very favorable moat with growing ROIC outperforming WACC, signaling durable competitive advantage. D-Wave shows slightly unfavorable moat status with negative ROIC versus WACC despite improving profitability, indicating value destruction risk.
Stock Comparison
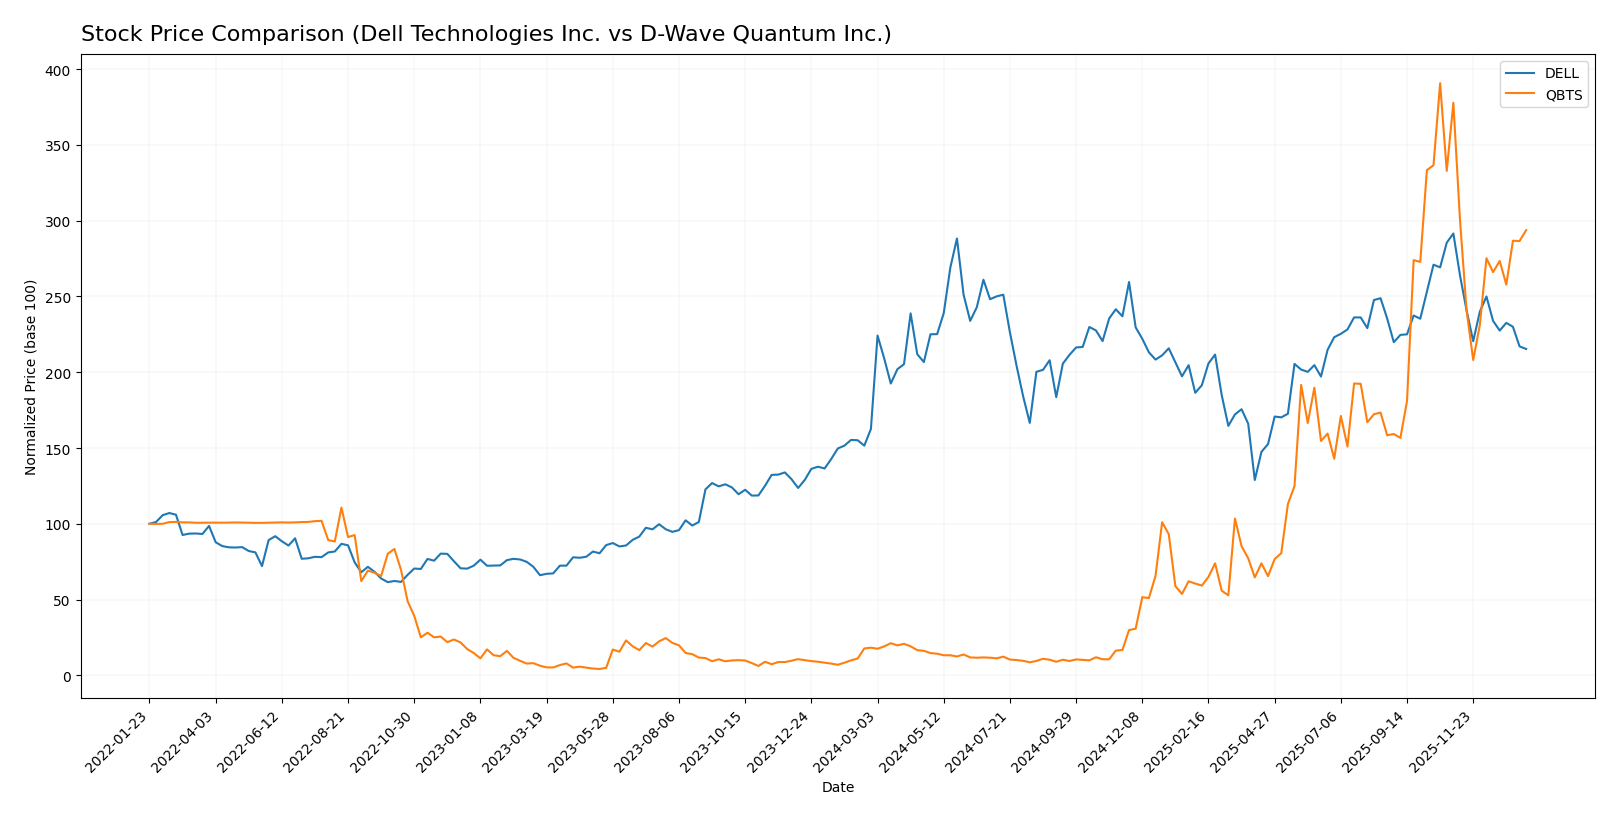
The past year has seen significant bullish gains for both Dell Technologies Inc. and D-Wave Quantum Inc., with notable deceleration in their upward momentum and a recent downward trend in the final months analyzed.
Trend Analysis
Dell Technologies Inc. exhibited a 32.44% price increase over the past 12 months, indicating a bullish trend with decelerating momentum. The stock ranged between 71.63 and 162.01, showing high volatility (std deviation 16.95). Recent months show a -26.14% decline.
D-Wave Quantum Inc. posted a remarkable 1510.06% increase over the same period, also bullish but with decelerating acceleration. The price ranged from 0.84 to 38.33, with moderate volatility (std deviation 10.33). Its recent trend dropped by -22.23%.
Comparing both, D-Wave Quantum Inc. delivered the highest market performance with a substantially larger overall gain, despite both stocks showing recent short-term weakness.
Target Prices
The current analyst consensus presents promising upside potential for both Dell Technologies Inc. and D-Wave Quantum Inc.
| Company | Target High | Target Low | Consensus |
|---|---|---|---|
| Dell Technologies Inc. | 200 | 113 | 163.83 |
| D-Wave Quantum Inc. | 46 | 26 | 38.88 |
Analysts expect Dell’s stock to trade significantly above its current price of 119.7 USD, suggesting strong growth potential. D-Wave’s consensus target also indicates upside from its current 28.84 USD, reflecting optimism about its emerging quantum computing business.
Analyst Opinions Comparison
This section compares analysts’ ratings and financial scores for Dell Technologies Inc. and D-Wave Quantum Inc.:
Rating Comparison
DELL Rating
- Rating: C+, classified as Very Favorable by analysts.
- Discounted Cash Flow Score: Moderate at 3, indicating average valuation status.
- ROE Score: Very Unfavorable at 1, reflecting low profit generation efficiency.
- ROA Score: Favorable at 4, showing strong asset utilization.
- Debt To Equity Score: Very Unfavorable at 1, indicating higher financial risk.
- Overall Score: Moderate at 2, representing an average overall financial health.
QBTS Rating
- Rating: C-, also classified as Very Favorable by analysts.
- Discounted Cash Flow Score: Very Unfavorable at 1, suggesting possible overvaluation.
- ROE Score: Very Unfavorable at 1, showing similarly low efficiency in generating equity profit.
- ROA Score: Very Unfavorable at 1, indicating weak asset utilization.
- Debt To Equity Score: Favorable at 4, reflecting lower financial risk.
- Overall Score: Very Unfavorable at 1, indicating weaker overall financial health.
Which one is the best rated?
Based strictly on the provided data, Dell has a higher overall score and stronger asset utilization but carries more financial risk. D-Wave Quantum shows a better debt-to-equity score but lower scores across most other metrics, resulting in a weaker overall rating.
Scores Comparison
The following table presents a comparison of the Altman Z-Score and Piotroski Score for Dell and D-Wave Quantum:
Dell Scores
- Altman Z-Score: 1.93, indicating a grey zone risk.
- Piotroski Score: 7, reflecting strong financials.
D-Wave Quantum Scores
- Altman Z-Score: 28.11, indicating a safe zone.
- Piotroski Score: 4, reflecting average financials.
Which company has the best scores?
D-Wave Quantum shows a significantly higher Altman Z-Score, placing it firmly in the safe zone, while Dell’s score is in the grey zone. Conversely, Dell’s Piotroski Score is stronger than D-Wave’s, indicating better financial strength on that metric.
Grades Comparison
Below is a detailed comparison of recent grades issued by recognized financial institutions for the two companies:
Dell Technologies Inc. Grades
This table summarizes the latest grades assigned to Dell Technologies by major financial firms.
| Grading Company | Action | New Grade | Date |
|---|---|---|---|
| Mizuho | Maintain | Outperform | 2025-11-26 |
| B of A Securities | Maintain | Buy | 2025-11-26 |
| Morgan Stanley | Maintain | Underweight | 2025-11-26 |
| UBS | Maintain | Buy | 2025-11-26 |
| Barclays | Maintain | Equal Weight | 2025-11-26 |
| B of A Securities | Maintain | Buy | 2025-11-20 |
| JP Morgan | Maintain | Overweight | 2025-11-17 |
| Morgan Stanley | Downgrade | Underweight | 2025-11-17 |
| Raymond James | Maintain | Outperform | 2025-10-21 |
| Argus Research | Maintain | Buy | 2025-10-09 |
Overall, Dell’s grades show a mix of Buy, Outperform, and Underweight ratings, reflecting a generally positive but somewhat cautious market sentiment.
D-Wave Quantum Inc. Grades
This table presents the recent grades awarded to D-Wave Quantum by reputable grading firms.
| Grading Company | Action | New Grade | Date |
|---|---|---|---|
| Rosenblatt | Maintain | Buy | 2026-01-08 |
| Rosenblatt | Maintain | Buy | 2026-01-07 |
| Benchmark | Maintain | Buy | 2025-11-10 |
| Rosenblatt | Maintain | Buy | 2025-11-07 |
| Canaccord Genuity | Maintain | Buy | 2025-11-07 |
| Cantor Fitzgerald | Maintain | Overweight | 2025-11-07 |
| B. Riley Securities | Maintain | Buy | 2025-09-22 |
| Piper Sandler | Maintain | Overweight | 2025-08-08 |
| Benchmark | Maintain | Buy | 2025-08-04 |
| B. Riley Securities | Maintain | Buy | 2025-07-23 |
D-Wave Quantum’s grades consistently show Buy and Overweight ratings, indicating strong analyst confidence in the stock.
Which company has the best grades?
D-Wave Quantum holds a more uniformly positive grading profile, with all ratings being Buy or Overweight, while Dell Technologies shows a broader range including some Underweight and Equal Weight grades. This contrast may affect investors’ perception of risk and potential growth opportunities.
Strengths and Weaknesses
Below is a comparative analysis of Dell Technologies Inc. and D-Wave Quantum Inc. based on key business criteria:
| Criterion | Dell Technologies Inc. | D-Wave Quantum Inc. |
|---|---|---|
| Diversification | Highly diversified with strong revenue streams from Client Solutions (49B in 2024), Infrastructure Solutions (34B), and Other Segments. | Limited diversification; revenue mainly from Professional Services (1.9M in 2024) and small Product sales. |
| Profitability | Moderate net margin (4.81%) but favorable ROIC (14.7%) indicating efficient capital use. | Negative net margin (-1630%) and ROIC (-45%), indicating ongoing losses and unprofitable operations. |
| Innovation | Established technology provider with consistent investment in infrastructure and solutions. | Focused on quantum computing innovation but profitability and scale remain challenges. |
| Global presence | Strong global presence with a broad customer base across multiple sectors. | Smaller scale and niche market in quantum computing with limited global reach. |
| Market Share | Significant share in computer hardware and enterprise solutions markets. | Emerging player in quantum computing with a very small market share. |
Key takeaways: Dell demonstrates a durable competitive advantage with diverse revenue and solid capital efficiency, despite some margin pressures. D-Wave is innovating in a cutting-edge field but struggles with profitability and scale, posing higher investment risk.
Risk Analysis
Below is a comparative table of key risks for Dell Technologies Inc. and D-Wave Quantum Inc. based on the most recent data from 2025 and 2024 respectively:
| Metric | Dell Technologies Inc. | D-Wave Quantum Inc. |
|---|---|---|
| Market Risk | Beta 1.11, moderate volatility | Beta 1.56, higher volatility |
| Debt Level | Debt-to-assets 30.8%, neutral | Debt-to-assets 19.2%, favorable |
| Regulatory Risk | Moderate, US tech regulations | Higher, emerging quantum sector |
| Operational Risk | Large scale operations, 108K employees | Smaller scale, 216 employees, reliance on cutting-edge tech |
| Environmental Risk | Moderate, tech hardware impact | Moderate, less hardware production |
| Geopolitical Risk | US-based, global supply chains | Canadian base, international markets exposure |
Dell faces moderate market and regulatory risks typical of a large US tech hardware firm, with some financial constraints reflected in liquidity ratios. D-Wave’s higher beta indicates greater market volatility, with significant operational risk due to its nascent quantum computing field and smaller size. Its strong balance sheet debt metrics reduce financial risk, but the emerging nature of its technology and geopolitical exposure pose notable uncertainties.
The most impactful risks are Dell’s operational complexity and moderate liquidity, while for D-Wave, market volatility and operational dependence on evolving quantum technology stand out. Investors should weigh these factors carefully, balancing growth potential against the inherent risks of each company’s industry positioning.
Which Stock to Choose?
Dell Technologies Inc. shows a favorable income evolution with 8.08% revenue growth in 2025 and a solid 10.27% over five years. Its financial ratios are slightly favorable overall, with a strong ROIC of 14.71% and a very favorable economic moat. Despite a negative ROE of -3.1%, Dell’s debt and liquidity ratios appear manageable, earning it a very favorable C+ rating.
D-Wave Quantum Inc. presents an unfavorable income statement, with a -1629.99% net margin and negative profitability metrics. Its financial ratios are predominantly unfavorable, including a negative ROIC and weak asset turnover, though it holds a strong current ratio and favorable debt-to-assets. The company’s rating is C- but with a very unfavorable overall score, reflecting financial challenges.
Investors focused on stable value creation and profitability may find Dell’s consistent income growth and strong moat more aligned with their profile, while those with a higher risk tolerance and interest in emerging technologies might view D-Wave’s growth potential and improving ROIC trend as indicative of possible future gains.
Disclaimer: Investment carries a risk of loss of initial capital. The past performance is not a reliable indicator of future results. Be sure to understand risks before making an investment decision.
Go Further
I encourage you to read the complete analyses of Dell Technologies Inc. and D-Wave Quantum Inc. to enhance your investment decisions: