Home > Comparison > Consumer Cyclical > DHI vs PHM
The strategic rivalry between D.R. Horton, Inc. and PulteGroup, Inc. shapes the U.S. residential construction sector. D.R. Horton operates as a vast, diversified homebuilder with nationwide reach, while PulteGroup focuses on targeted land development and varied home designs. This clash highlights a contest between scale-driven efficiency and flexible portfolio management. This analysis will identify which business model delivers superior risk-adjusted returns for a diversified portfolio in today’s evolving housing market.

Table of contents
Companies Overview
D.R. Horton and PulteGroup define the competitive landscape of U.S. residential construction with distinctive scale and reach.
D.R. Horton, Inc.: America’s Largest Homebuilder
D.R. Horton dominates the U.S. residential construction market with a broad geographic footprint across 31 states and 98 markets. Its core revenue stems from constructing and selling single-family and attached homes, supplemented by mortgage financing and title services. In 2026, it strategically focuses on expanding its land acquisition and residential lot development to sustain its market leadership.
PulteGroup, Inc.: Diverse Home Design Innovator
PulteGroup specializes in various home designs including single-family, townhomes, and condominiums, operating under multiple brand names. Its revenue engine relies on land acquisition, home construction, and mortgage origination services. In 2026, the company emphasizes controlling a large lot inventory and leveraging financing solutions to enhance buyer accessibility and diversity in product offerings.
Strategic Collision: Similarities & Divergences
Both companies compete fiercely in residential construction but differ in scale and product breadth. D.R. Horton pursues market dominance through volume and geographic spread, while PulteGroup focuses on brand diversification and lot control. Their primary battleground lies in land development and financing integration. Investors face contrasting profiles: D.R. Horton offers scale-driven stability, whereas PulteGroup presents growth through product variety and targeted market segments.
Income Statement Comparison
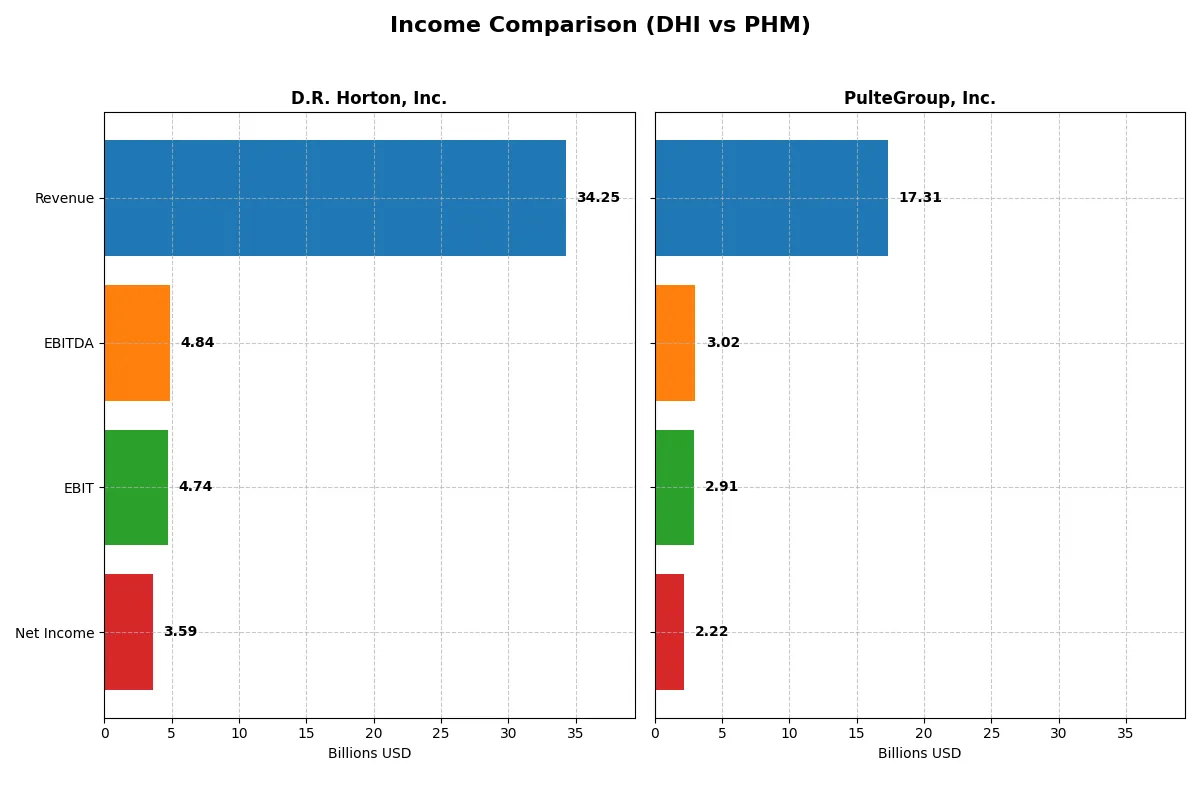
The following data dissects the core profitability and scalability of both corporate engines to reveal who dominates the bottom line:
| Metric | D.R. Horton, Inc. (DHI) | PulteGroup, Inc. (PHM) |
|---|---|---|
| Revenue | 34.3B | 17.3B |
| Cost of Revenue | 26.1B | 12.7B |
| Operating Expenses | 3.7B | 1.6B |
| Gross Profit | 8.1B | 4.6B |
| EBITDA | 4.8B | 3.0B |
| EBIT | 4.7B | 2.9B |
| Interest Expense | 0 | 0.6M |
| Net Income | 3.6B | 2.2B |
| EPS | 11.62 | 11.21 |
| Fiscal Year | 2025 | 2025 |
Income Statement Analysis: The Bottom-Line Duel
The following comparison exposes each firm’s income statement efficiency, revealing who maximizes profits amid shifting revenues and costs.
D.R. Horton, Inc. Analysis
D.R. Horton’s revenue peaked at 36.8B in 2024 before falling 6.9% to 34.3B in 2025. Net income dropped 24% year-over-year to 3.6B, signaling pressure on profitability. Despite a solid 23.7% gross margin and 10.5% net margin, recent declines suggest waning momentum and compressing margins.
PulteGroup, Inc. Analysis
PulteGroup grew revenue by 26% from 2021 to 2025 but saw a 3.5% dip in 2025 to 17.3B. Net income rose 14% overall, yet dropped 24% last year to 2.2B. Margins remain robust with a 26.4% gross margin and 12.8% net margin, indicating better cost control despite short-term setbacks.
Margin Strength vs. Revenue Resilience
D.R. Horton delivers higher revenues but struggles with sharper net income declines and margin compression. PulteGroup shows steadier net income growth and superior margin ratios, reflecting efficient capital allocation. Investors favor PulteGroup’s profile for consistent profitability and margin resilience over D.R. Horton’s scale with eroding efficiency.
Financial Ratios Comparison
These vital ratios act as a diagnostic tool to expose the underlying fiscal health, valuation premiums, and capital efficiency of the companies compared below:
| Ratios | D.R. Horton, Inc. (DHI) | PulteGroup, Inc. (PHM) |
|---|---|---|
| ROE | 14.8% | 17.1% |
| ROIC | 10.1% | 15.1% |
| P/E | 14.6 | 10.5 |
| P/B | 2.16 | 1.79 |
| Current Ratio | 17.4 | 5.15 |
| Quick Ratio | 4.51 | 0.69 |
| D/E | 0.25 | 0.17 |
| Debt-to-Assets | 17.0% | 12.0% |
| Interest Coverage | 0 | 0 |
| Asset Turnover | 0.97 | 0.96 |
| Fixed Asset Turnover | 399 | 0 |
| Payout Ratio | 13.8% | 7.96% |
| Dividend Yield | 0.95% | 0.76% |
| Fiscal Year | 2025 | 2025 |
Efficiency & Valuation Duel: The Vital Signs
Ratios act as a company’s DNA, revealing hidden risks and operational excellence critical for informed investment decisions.
D.R. Horton, Inc.
D.R. Horton posts a solid 14.8% ROE with a favorable 10.5% net margin, indicating efficient profitability. The P/E of 14.6 suggests a fair valuation, while a high current ratio (17.4) signals excess liquidity but potential asset inefficiency. Dividend yield is low at 0.95%, reflecting limited shareholder payouts.
PulteGroup, Inc.
PulteGroup leads with a stronger 17.1% ROE and a 12.8% net margin, signaling superior profitability. Its P/E of 10.5 indicates the stock trades at a discount relative to earnings. However, a weak quick ratio (0.69) raises liquidity concerns. Dividend yield stands at 0.76%, showing modest returns to shareholders.
Balanced Profitability vs. Valuation Discipline
D.R. Horton offers operational efficiency with slightly stretched liquidity, while PulteGroup combines higher returns with a more attractive valuation but weaker short-term liquidity. Investors prioritizing steady profitability may prefer D.R. Horton’s profile; those seeking value with growth potential might lean toward PulteGroup.
Which one offers the Superior Shareholder Reward?
I see D.R. Horton (DHI) pays a higher dividend yield near 0.95% with a conservative 14% payout ratio, supported by robust free cash flow coverage above 90%. PulteGroup (PHM) yields about 0.76%, with a similar payout near 8%. Both boost returns via active buybacks, but DHI’s larger buyback scale and stronger cash ratios enhance sustainability. PHM’s reinvestment into growth shows potential, yet DHI’s balanced cash returns and capital allocation provide a more attractive total return profile in 2026. I favor DHI for superior, sustainable shareholder reward.
Comparative Score Analysis: The Strategic Profile
The radar chart reveals the core DNA and strategic trade-offs between D.R. Horton, Inc. and PulteGroup, Inc., highlighting their financial strengths and valuation nuances:
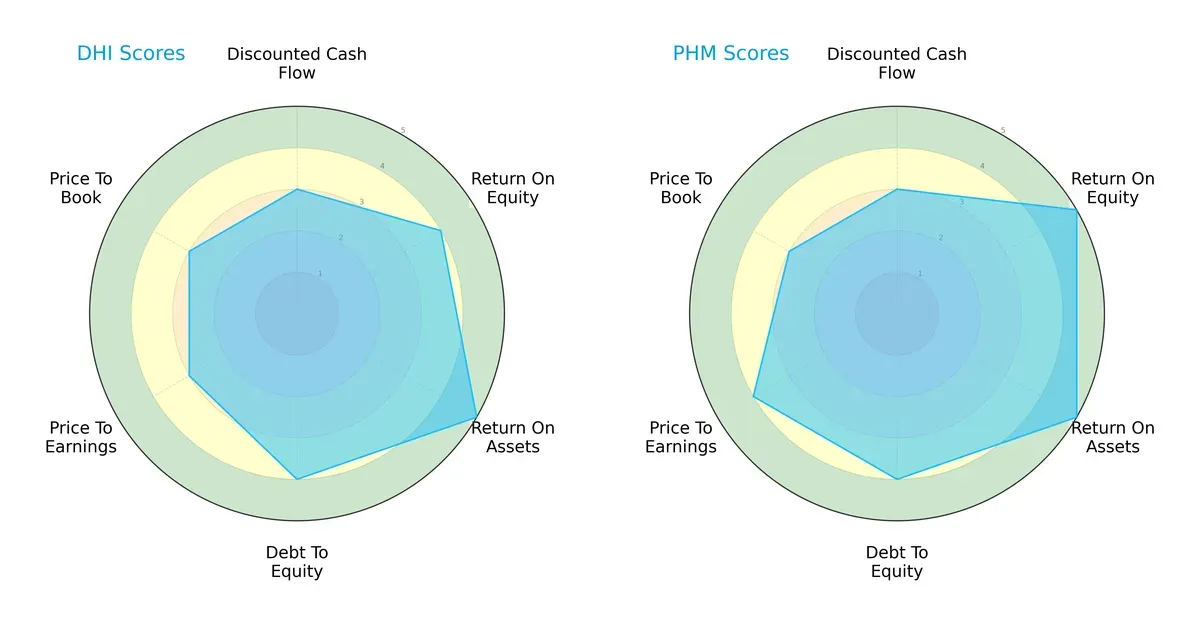
PulteGroup edges out with higher ROE and P/E scores, showcasing superior profitability and market valuation appeal. D.R. Horton leads in return on assets, signaling efficient asset use, and holds a slightly better debt-to-equity balance. Both firms share an overall favorable rating, but PulteGroup relies more on equity returns, while D.R. Horton offers a balanced profile across profitability and leverage metrics.
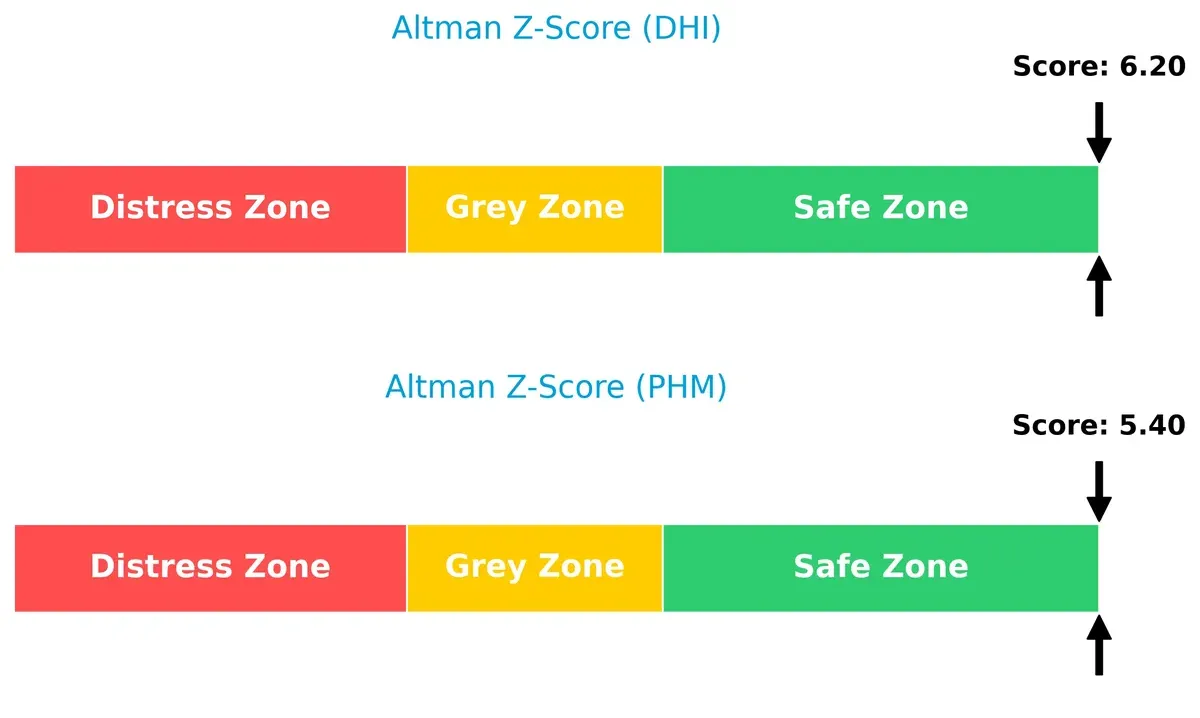
Bankruptcy Risk: Solvency Showdown
The Altman Z-Scores place both companies comfortably in the safe zone, with D.R. Horton scoring 6.2 and PulteGroup 5.4, indicating strong solvency and low bankruptcy risk in this cycle:
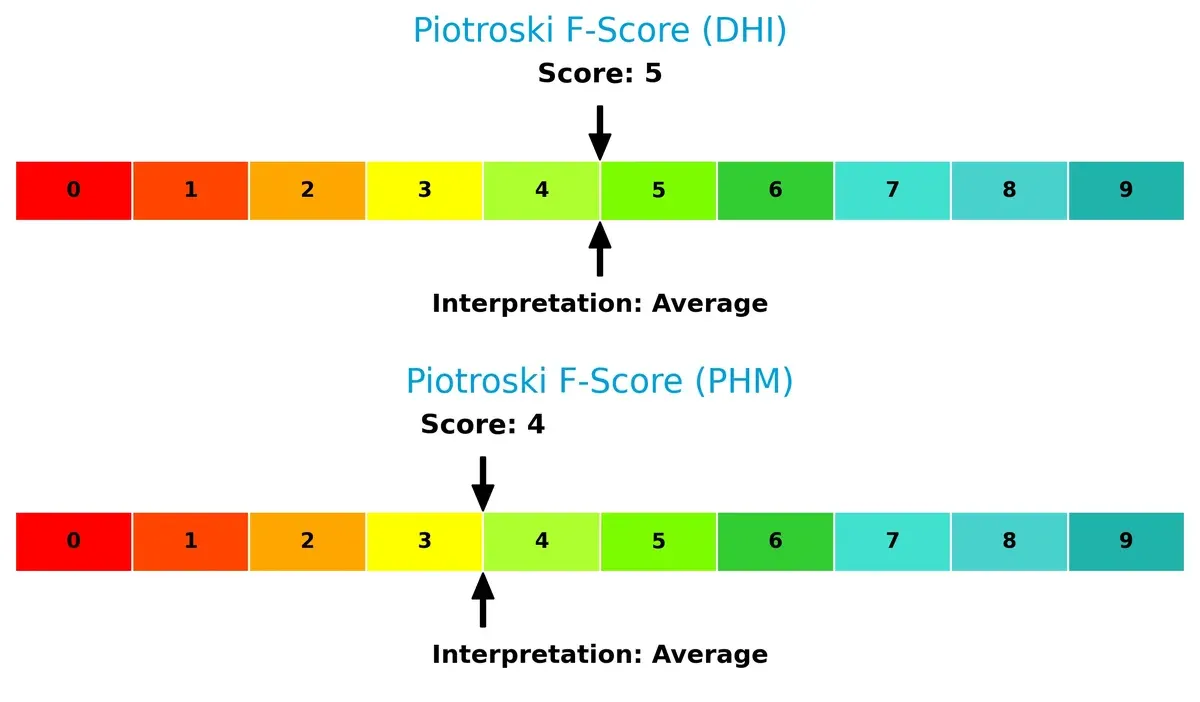
Financial Health: Quality of Operations
D.R. Horton’s Piotroski F-Score of 5 slightly surpasses PulteGroup’s 4, both within an average range, suggesting moderate financial health without glaring internal red flags:
How are the two companies positioned?
This section dissects the operational DNA of DHI and PHM by comparing their revenue distribution by segment and internal dynamics. The goal is to confront their economic moats and identify the most resilient competitive advantage today.
Revenue Segmentation: The Strategic Mix
This comparison dissects how D.R. Horton, Inc. and PulteGroup, Inc. diversify their income streams and where their primary sector bets lie:
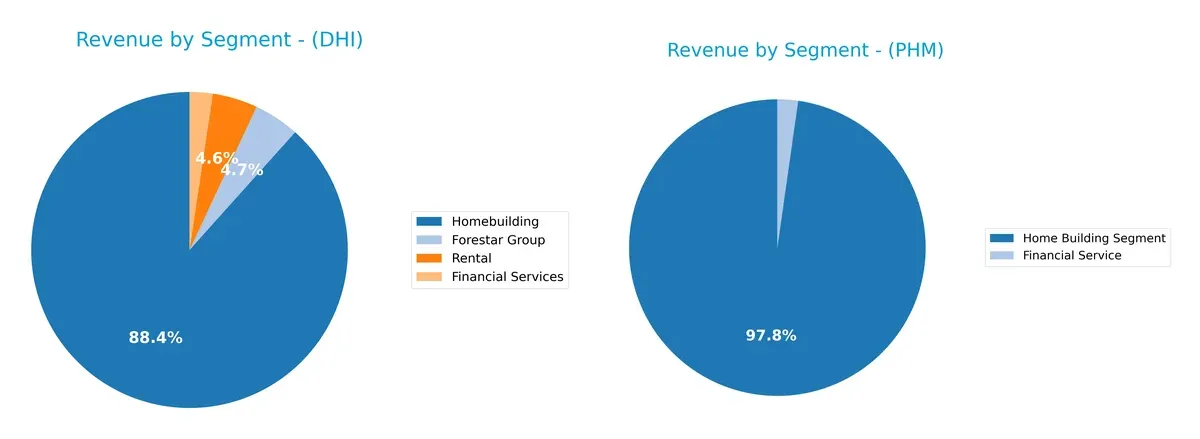
D.R. Horton dwarfs PulteGroup in homebuilding revenue with $31.5B in 2025, but also anchors income in Forestar ($1.66B), Rental ($1.64B), and Financial Services ($841M). PulteGroup relies heavily on its Home Building Segment at $16.9B, with a smaller Financial Service contribution ($389M). DHI’s broader mix reduces concentration risk, while PHM pivots on a dominant single segment, increasing exposure to housing market cycles.
Strengths and Weaknesses Comparison
This table compares the strengths and weaknesses of DHI and PHM based on diversification, profitability, financials, innovation, global presence, and market share:
DHI Strengths
- Diversified revenue from homebuilding, rental, financial services, Forestar Group
- Favorable net margin and ROIC above WACC
- Strong debt management with low debt-to-assets
- High fixed asset turnover indicating efficient asset use
- Broad geographic presence across six US regions
PHM Strengths
- Higher net margin, ROE, and ROIC than DHI
- Favorable P/E ratio signaling valuation appeal
- Low debt-to-assets ratio and very strong interest coverage
- Geographic diversification including Florida, Texas, West, Midwest
- Significant market share in attached and detached homes
DHI Weaknesses
- Unfavorable extremely high current ratio indicating liquidity management issues
- Relatively low dividend yield
- Neutral ROE and asset turnover metrics
- Limited innovation data
- Heavy reliance on homebuilding segment
PHM Weaknesses
- Unfavorable low quick ratio signaling potential liquidity risk
- Unfavorable fixed asset turnover at zero suggests inefficient asset use
- Lower dividend yield than DHI
- Higher proportion of unfavorable ratios overall
- Concentrated revenue in homebuilding and financial services only
Both companies exhibit solid profitability and geographic reach, yet DHI’s liquidity metrics raise caution. PHM excels in profitability ratios but faces asset utilization challenges. These factors will shape their capital allocation and growth strategies in 2026.
The Moat Duel: Analyzing Competitive Defensibility
A structural moat is the only durable shield protecting long-term profits from relentless competition erosion:
D.R. Horton, Inc.: Cost Advantage Powerhouse
D.R. Horton’s moat stems from its scale-driven cost advantage, evident in stable 23.7% gross margins. Yet, declining ROIC signals margin pressure. Expansion into multi-family rentals could deepen its moat, but competition tightens in 2026.
PulteGroup, Inc.: Efficient Capital Creator
PulteGroup leverages efficient capital deployment, demonstrated by ROIC comfortably above WACC and superior 26.4% gross margins. Unlike DHI, PHM sustains value creation despite a shrinking ROIC trend. New market penetration in Florida may fuel growth ahead.
Cost Leadership vs. Capital Efficiency: The Moat Verdict
PulteGroup maintains a wider moat with ROIC exceeding WACC by 5.5%, contrasting DHI’s value erosion. PHM’s superior margins and value creation better equip it to defend market share amid 2026’s headwinds.
Which stock offers better returns?
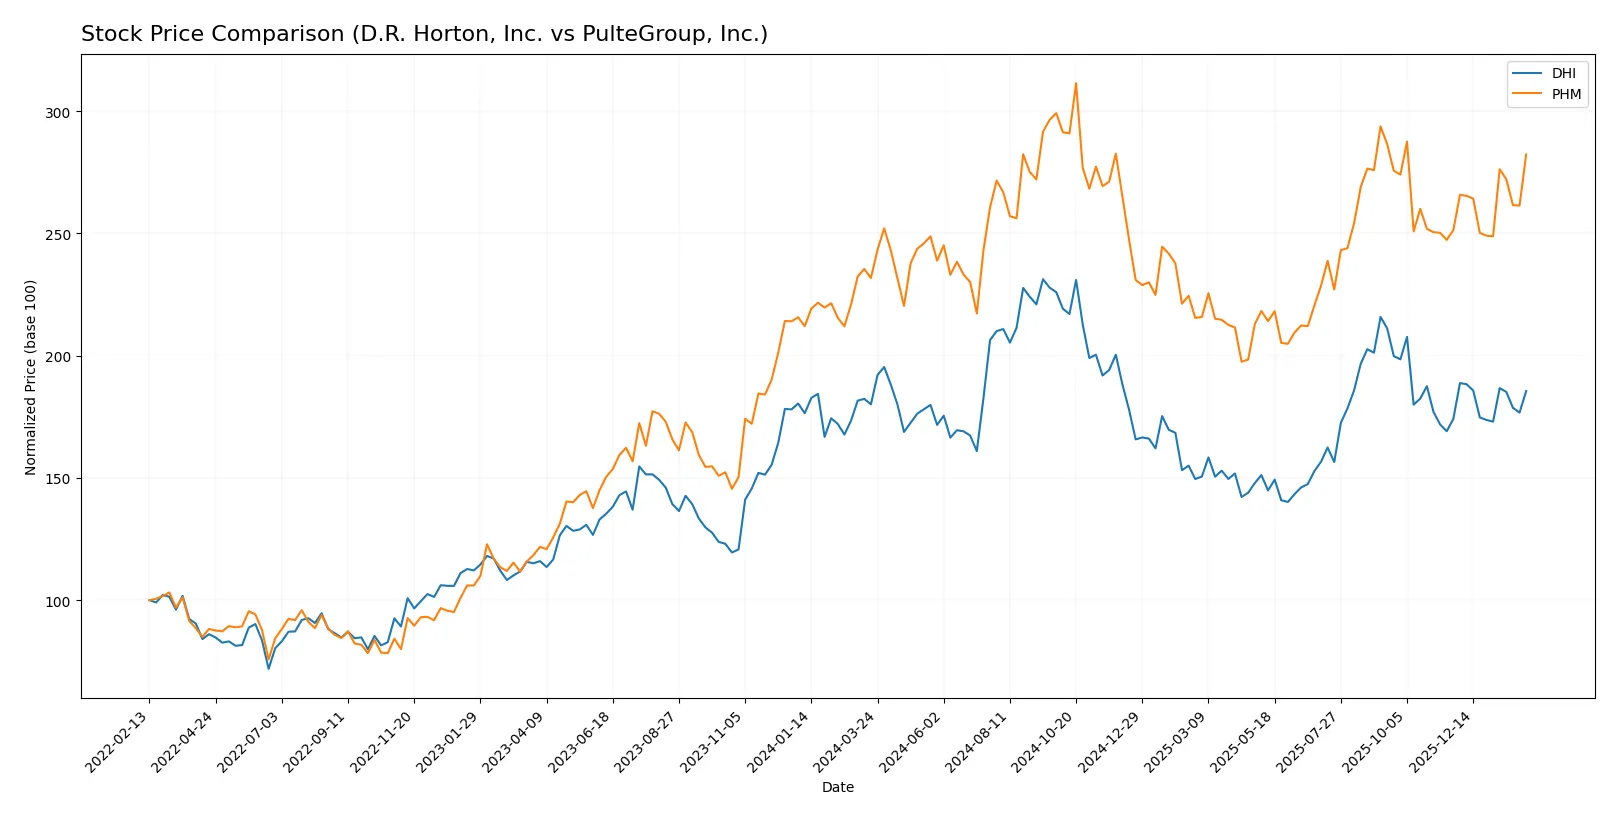
The past year shows distinct price dynamics: D.R. Horton, Inc. gained steadily with accelerating momentum, while PulteGroup, Inc. posted a stronger rally and sharper acceleration.
Trend Comparison
D.R. Horton, Inc. shows a 3.02% price increase over 12 months, indicating a bullish trend with accelerating gains and a high volatility of 20.01%. The stock’s range spans from 118.06 to 194.8.
PulteGroup, Inc. outperformed with a 21.81% price increase over the same period, also bullish with acceleration. It has lower volatility at 12.47%, trading between 94.53 and 149.04.
PulteGroup, Inc. delivered the highest market performance with a greater price increase and sustained acceleration compared to D.R. Horton, Inc.
Target Prices
Analysts present a cautiously optimistic consensus for these residential construction leaders.
| Company | Target Low | Target High | Consensus |
|---|---|---|---|
| D.R. Horton, Inc. | 129 | 195 | 168.71 |
| PulteGroup, Inc. | 115 | 159 | 137.29 |
The target consensus for D.R. Horton stands about 8% above its current 156.27 price, signaling moderate upside. PulteGroup’s consensus target also suggests slight appreciation potential, roughly 2% above the 135.09 stock price.

Don’t Let Luck Decide Your Entry Point
Optimize your entry points with our advanced ProRealTime indicators. You’ll get efficient buy signals with precise price targets for maximum performance. Start outperforming now!
How do institutions grade them?
D.R. Horton, Inc. Grades
The table below shows recent institutional grades for D.R. Horton, Inc.:
| Grading Company | Action | New Grade | Date |
|---|---|---|---|
| Argus Research | Maintain | Buy | 2026-01-23 |
| B of A Securities | Maintain | Neutral | 2026-01-21 |
| Barclays | Maintain | Equal Weight | 2026-01-21 |
| Evercore ISI Group | Maintain | In Line | 2026-01-21 |
| Citigroup | Maintain | Neutral | 2026-01-08 |
| Citizens | Downgrade | Market Perform | 2026-01-07 |
| UBS | Maintain | Buy | 2026-01-06 |
| Wells Fargo | Downgrade | Equal Weight | 2026-01-06 |
| Wells Fargo | Maintain | Overweight | 2025-12-08 |
| Barclays | Maintain | Equal Weight | 2025-12-08 |
PulteGroup, Inc. Grades
The table below shows recent institutional grades for PulteGroup, Inc.:
| Grading Company | Action | New Grade | Date |
|---|---|---|---|
| Citigroup | Maintain | Neutral | 2026-02-03 |
| JP Morgan | Maintain | Overweight | 2026-02-03 |
| Oppenheimer | Maintain | Outperform | 2026-01-30 |
| RBC Capital | Maintain | Sector Perform | 2026-01-30 |
| Wells Fargo | Maintain | Overweight | 2026-01-14 |
| Citigroup | Maintain | Neutral | 2026-01-08 |
| Wells Fargo | Maintain | Overweight | 2026-01-06 |
| UBS | Maintain | Buy | 2026-01-06 |
| Evercore ISI Group | Maintain | In Line | 2025-10-22 |
| B of A Securities | Maintain | Buy | 2025-10-10 |
Which company has the best grades?
PulteGroup, Inc. generally receives stronger grades, including multiple Overweight and Outperform ratings. D.R. Horton, Inc. shows mixed grades with several Neutral and Equal Weight ratings. This divergence may signal varying market confidence and affect investor sentiment differently.
Risks specific to each company
In the 2026 market environment, these categories pinpoint critical pressure points and systemic threats facing D.R. Horton, Inc. and PulteGroup, Inc.:
1. Market & Competition
D.R. Horton, Inc.
- Large scale presence in 31 states supports resilience but intensifies competitive pressure.
PulteGroup, Inc.
- Controls extensive lot inventory, enabling growth but increasing exposure to market shifts.
2. Capital Structure & Debt
D.R. Horton, Inc.
- Debt-to-equity at 0.25 signals moderate leverage with strong interest coverage.
PulteGroup, Inc.
- Lower debt-to-equity at 0.17 suggests more conservative debt usage and robust coverage ratio.
3. Stock Volatility
D.R. Horton, Inc.
- Beta of 1.45 indicates higher volatility than the market, increasing risk in downturns.
PulteGroup, Inc.
- Beta of 1.34 shows elevated but slightly lower volatility compared to DHI.
4. Regulatory & Legal
D.R. Horton, Inc.
- Broad geographic footprint exposes DHI to diverse regulatory regimes and compliance costs.
PulteGroup, Inc.
- Concentrated lot ownership invites scrutiny on land use and environmental regulations.
5. Supply Chain & Operations
D.R. Horton, Inc.
- Multi-regional operations require complex supply chain management, risking delays and cost overruns.
PulteGroup, Inc.
- Heavy reliance on owned and optioned lots demands efficient land development and construction execution.
6. ESG & Climate Transition
D.R. Horton, Inc.
- Energy assets ownership increases exposure to climate policy risks but offers transition opportunities.
PulteGroup, Inc.
- Focus on residential projects necessitates proactive ESG strategies to meet growing investor expectations.
7. Geopolitical Exposure
D.R. Horton, Inc.
- Domestic US focus limits direct geopolitical risks but market sensitivity remains to national economic policy.
PulteGroup, Inc.
- Similar US-centric exposure with additional sensitivity to regional economic fluctuations in key states.
Which company shows a better risk-adjusted profile?
The most impactful risk for D.R. Horton is its elevated stock volatility (beta 1.45), which can amplify losses during market downturns. For PulteGroup, the operational complexity tied to its large lot portfolio is a key vulnerability. Despite this, PulteGroup’s superior profitability metrics and lower leverage deliver a slightly better risk-adjusted profile. Notably, PulteGroup’s higher ROIC (15.08% vs. 10.09%) signals more effective capital use, reinforcing my confidence in its resilience under pressure.
Final Verdict: Which stock to choose?
D.R. Horton, Inc. (DHI) demonstrates a superpower in its robust asset utilization and strong balance sheet discipline, which historically supports steady cash generation. However, its declining profitability and unusually high current ratio present points of vigilance. This stock aligns well with aggressive growth portfolios willing to navigate cyclical headwinds.
PulteGroup, Inc. (PHM) boasts a strategic moat through efficient capital use and superior return on invested capital, reflecting effective value creation. It offers a comparatively safer profile with stronger profitability metrics and a more reasonable valuation. PHM suits investors seeking growth at a reasonable price with moderate risk tolerance.
If you prioritize capital efficiency and value creation, PulteGroup outshines with its superior moat and stability despite some profitability erosion. However, if you seek aggressive growth fueled by operational strength and can tolerate short-term margin pressures, D.R. Horton could offer compelling upside. Both demand careful monitoring of market cycles and company fundamentals.
Disclaimer: Investment carries a risk of loss of initial capital. The past performance is not a reliable indicator of future results. Be sure to understand risks before making an investment decision.
Go Further
I encourage you to read the complete analyses of D.R. Horton, Inc. and PulteGroup, Inc. to enhance your investment decisions: