Home > Comparison > Consumer Cyclical > DHI vs NVR
The strategic rivalry between D.R. Horton, Inc. and NVR, Inc. shapes the residential construction sector’s competitive landscape. D.R. Horton operates as a broad-market homebuilder with extensive geographic reach and diversified services. In contrast, NVR pursues a focused, high-efficiency approach targeting premium and move-up buyers. This analysis explores which operational model offers superior risk-adjusted returns, guiding investors seeking durable growth within a cyclical industry.

Table of contents
Companies Overview
D.R. Horton and NVR are leading U.S. homebuilders shaping the residential construction market.
D.R. Horton, Inc.: America’s Largest Homebuilder
D.R. Horton dominates with a broad footprint across 31 states and 98 markets. Its core revenue comes from constructing and selling single-family and attached homes. In 2026, the company emphasizes land acquisition and residential lot development to sustain growth in diverse regions, leveraging integrated mortgage and title services as competitive edges.
NVR, Inc.: Focused Regional Homebuilder
NVR specializes in mid-Atlantic and Midwest markets with a strong emphasis on single-family and attached homes. Its revenue engine combines homebuilding and mortgage banking services. The strategic focus in 2026 targets first-time and luxury buyers through segmented brands, supported by mortgage loan sales to investors, enhancing cash flow and risk management.
Strategic Collision: Similarities & Divergences
Both firms compete in residential construction but diverge in scale and market approach. D.R. Horton pursues a broad national footprint with integrated services, while NVR targets specific regions with a brand-segmented model. The battleground centers on market penetration and financing capabilities. Their investment profiles reflect this: D.R. Horton offers scale-driven resilience; NVR delivers focused, efficient growth.
Income Statement Comparison
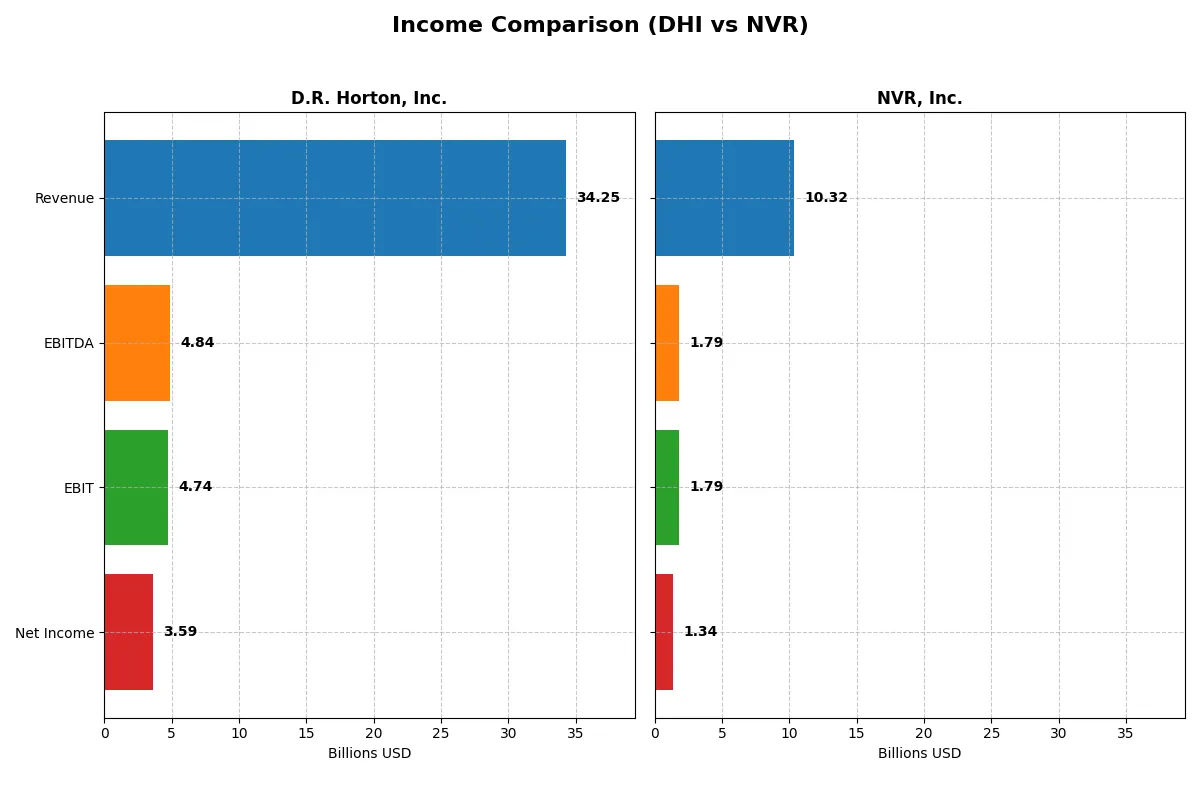
The following data dissects the core profitability and scalability of both corporate engines to reveal who dominates the bottom line:
| Metric | D.R. Horton, Inc. (DHI) | NVR, Inc. (NVR) |
|---|---|---|
| Revenue | 34.3B | 10.3B |
| Cost of Revenue | 26.1B | 7.95B |
| Operating Expenses | 3.69B | 699M |
| Gross Profit | 8.12B | 2.37B |
| EBITDA | 4.84B | 1.79B |
| EBIT | 4.74B | 1.79B |
| Interest Expense | 0 | 29M |
| Net Income | 3.59B | 1.34B |
| EPS | 11.62 | 462 |
| Fiscal Year | 2025 | 2025 |
Income Statement Analysis: The Bottom-Line Duel
This income statement comparison reveals which company runs its business with greater efficiency and sustainable profit generation.
D.R. Horton, Inc. Analysis
D.R. Horton’s revenue peaked at 36.8B in 2024 before declining to 34.3B in 2025. Net income followed suit, dropping from 4.76B to 3.59B. Gross and net margins remain healthy at 23.7% and 10.5%, respectively, but recent declines signal pressure on profitability and operating efficiency in 2025.
NVR, Inc. Analysis
NVR’s revenue slid slightly from 10.5B in 2024 to 10.3B in 2025, while net income decreased from 1.68B to 1.34B. Despite this, NVR sustains robust margins, with a 22.96% gross margin and a superior 13.0% net margin in 2025, reflecting efficient cost management and stronger bottom-line resilience.
Margin Strength vs. Scale and Momentum
NVR outperforms on margin quality and bottom-line growth, while D.R. Horton boasts higher revenue scale but weaker recent profitability. For investors, NVR’s efficiency and margin stability present a more attractive profile amid sector headwinds.
Financial Ratios Comparison
These vital ratios act as a diagnostic tool to expose the underlying fiscal health, valuation premiums, and capital efficiency of the companies compared below:
| Ratios | D.R. Horton, Inc. (DHI) | NVR, Inc. (NVR) |
|---|---|---|
| ROE | 14.82% | 0% |
| ROIC | 10.09% | 0% |
| P/E | 14.58 | 15.79 |
| P/B | 2.16 | 0 |
| Current Ratio | 17.39 | 0 |
| Quick Ratio | 4.51 | 0 |
| D/E | 0.25 | 0 |
| Debt-to-Assets | 17.00% | 0% |
| Interest Coverage | 0 | -55.89 |
| Asset Turnover | 0.97 | 0 |
| Fixed Asset Turnover | 398.72 | 0 |
| Payout ratio | 13.80% | 0% |
| Dividend yield | 0.95% | 0% |
| Fiscal Year | 2025 | 2025 |
Efficiency & Valuation Duel: The Vital Signs
Financial ratios serve as a company’s DNA, exposing hidden risks and operational strengths that numbers alone often conceal.
D.R. Horton, Inc.
D.R. Horton shows solid profitability with a 14.8% ROE and favorable 10.5% net margin. Its P/E of 14.58 suggests a reasonable valuation, neither stretched nor cheap. Despite a low 0.95% dividend yield, the company maintains strong capital discipline with a low debt-to-equity ratio of 0.25 and invests efficiently in operations.
NVR, Inc.
NVR presents a higher net margin at 13.3% but reports an unfavorable zero ROE and ROIC, indicating possible data gaps or reinvestment focus. Its P/E of 15.79 is neutral, slightly above DHI. NVR carries no dividend and shows weaker liquidity ratios, signaling a riskier profile despite an impressive interest coverage of 62.1.
Balanced Strength vs. Data Ambiguity
D.R. Horton offers a clearer, more balanced financial picture with favorable profitability and manageable risk. NVR’s incomplete ratio data and zero returns on equity metrics introduce uncertainty. Investors seeking operational clarity might prefer DHI, while those accepting ambiguity for potential growth could consider NVR.
Which one offers the Superior Shareholder Reward?
I compare D.R. Horton, Inc. (DHI) and NVR, Inc. (NVR) on dividends, buybacks, and reinvestment. DHI pays dividends with yields near 0.9%, supported by a modest payout ratio (~14%), signaling sustainable cash return. It also maintains steady buybacks, enhancing total returns. NVR pays no dividends but aggressively reinvests massive free cash flow (~$432M/share in 2024) into growth and buybacks, fueling higher margins and asset turnover. Historically, NVR’s reinvestment-driven model outperforms in long cycles, but DHI offers safer income. I judge NVR’s aggressive capital allocation and buybacks as superior for total shareholder reward in 2026.
Comparative Score Analysis: The Strategic Profile
The radar chart reveals the fundamental DNA and trade-offs of both firms, highlighting their core strengths and vulnerabilities:
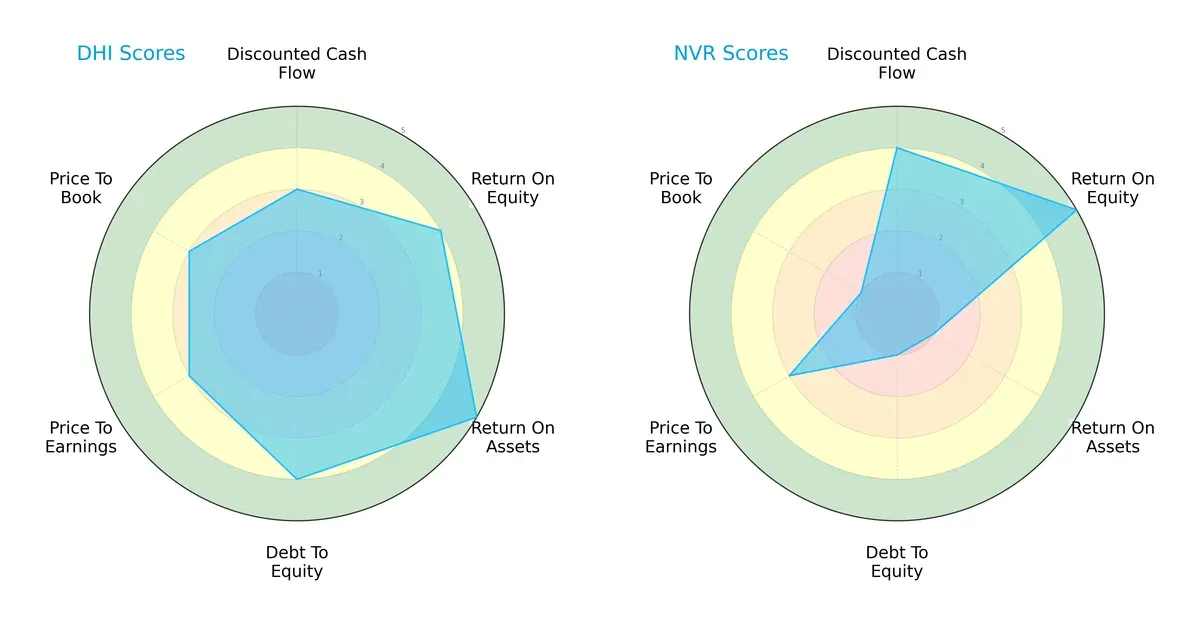
D.R. Horton, Inc. (DHI) presents a balanced profile with strong returns on assets (5) and equity (4) and solid debt management (4). NVR, Inc. (NVR) excels in return on equity (5) and discounted cash flow (4) but suffers from weak asset utilization (1) and heavy debt (1). DHI offers a more stable, well-rounded investment case, while NVR relies heavily on its equity efficiency edge.
Bankruptcy Risk: Solvency Showdown
DHI’s Altman Z-Score of 6.12 places it firmly in the safe zone, signaling robust solvency and low bankruptcy risk in this cycle. NVR’s Altman Z-Score is unavailable, preventing direct comparative insights:

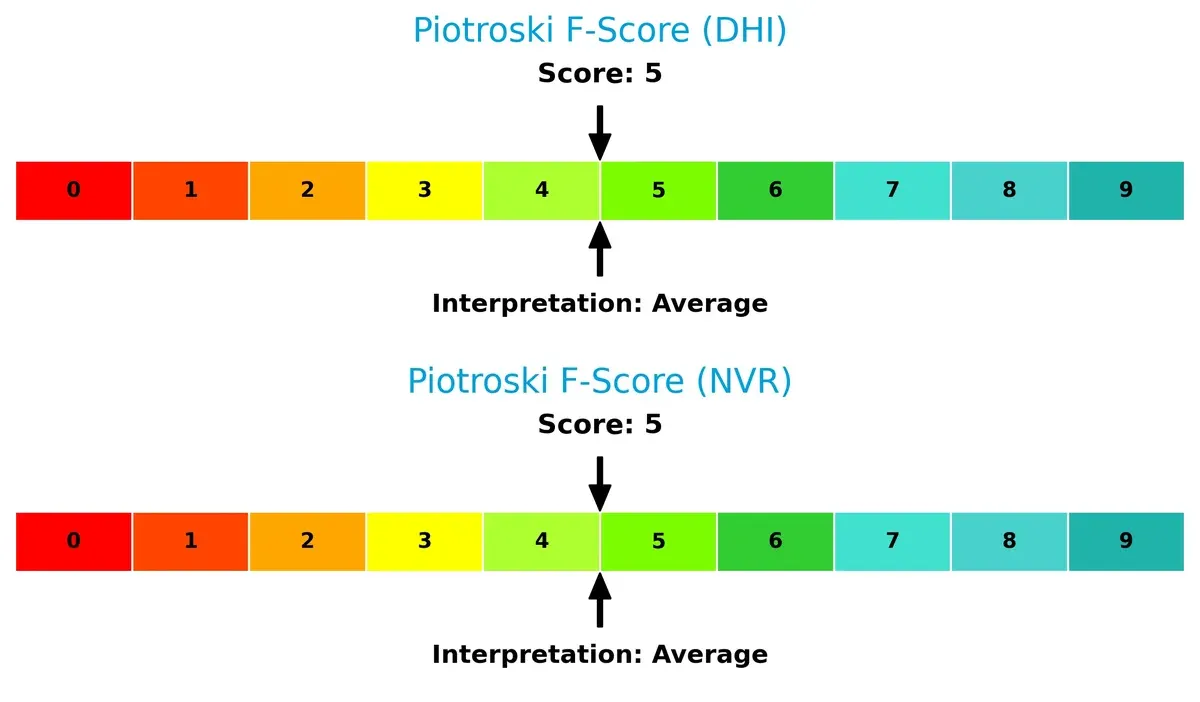
Financial Health: Quality of Operations
Both companies score a 5 on the Piotroski F-Score, indicating average financial health. Neither shows critical red flags, but neither demonstrates peak operational quality either:
How are the two companies positioned?
This section dissects the operational DNA of DHI and NVR by comparing their revenue distribution by segment and internal dynamics. The goal is to confront their economic moats to identify which model offers the most resilient competitive advantage today.
Revenue Segmentation: The Strategic Mix
The following visual comparison dissects how D.R. Horton, Inc. and NVR, Inc. diversify their income streams and where their primary sector bets lie:
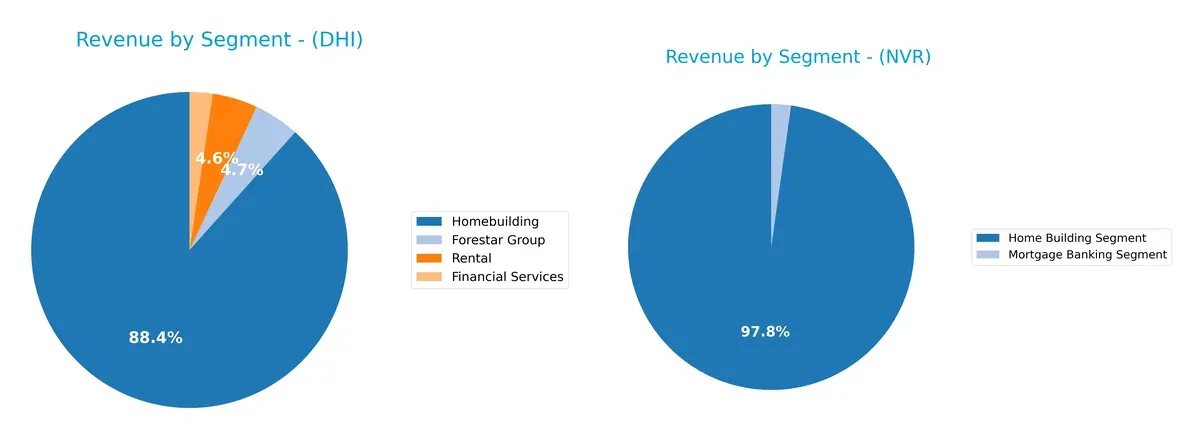
D.R. Horton dwarfs NVR with a $31.5B homebuilding core, complemented by $1.66B from Forestar and smaller financial services. NVR pivots mainly on a $10.3B home building segment, with a modest $232M mortgage banking unit. DHI’s diversified exposure reduces concentration risk, while NVR’s reliance on homebuilding anchors it to housing cycles, posing higher cyclicality but focused operational expertise.
Strengths and Weaknesses Comparison
This table compares the Strengths and Weaknesses of DHI and NVR based on diversification, profitability, financials, innovation, global presence, and market share:
DHI Strengths
- Diversified revenue from Homebuilding, Forestar Group, Rental, and Financial Services
- Favorable net margin (10.47%) and ROIC (10.09%)
- Strong interest coverage and low debt ratios
- Extensive geographic presence across multiple U.S. regions
- Consistent market share in varied segments
NVR Strengths
- Favorable net margin (13.27%)
- Strong interest coverage (62.1)
- Favorable debt-to-equity and debt-to-assets ratios
- Focused market share in Home Building and Mortgage Banking
- Positive price-to-book ratio indicating shareholder value
DHI Weaknesses
- Unfavorable current ratio (17.39) signals liquidity concerns
- Dividend yield below 1% may deter income-focused investors
- Neutral ROE and WACC suggest room for capital efficiency improvement
- Asset turnover neutral despite scale
NVR Weaknesses
- Unfavorable zero values in ROE, ROIC, current and quick ratios raise financial stability questions
- Unavailable WACC complicates cost of capital assessment
- Asset turnover and fixed asset turnover at zero indicate operational inefficiencies
- No dividend yield limits income appeal
DHI’s broad diversification and strong financial ratios support resilience and growth across multiple markets. NVR excels in profitability and debt management but shows red flags in liquidity and operational metrics, which may restrict strategic flexibility. Both companies’ financial profiles reveal distinct strengths and risks that shape their competitive positioning.
The Moat Duel: Analyzing Competitive Defensibility
A structural moat is the only shield that protects long-term profits from relentless competition erosion in residential construction. Let’s dissect the moats of two industry leaders:
D.R. Horton, Inc.: Scale and Geographic Diversification Moat
DHI’s competitive edge stems from its vast geographic footprint and scale, enabling cost efficiencies and market reach. Its 2025 margins remain solid despite recent revenue dips. Expansion into 31 states deepens this moat but margin pressure signals risk.
NVR, Inc.: Operational Efficiency and Premium Market Focus
NVR’s moat lies in operational excellence and focus on higher-end markets, driving superior EBIT and net margins compared to peers. Though its ROIC trend declines, NVR’s strategy of targeting luxury buyers supports sustained profitability and selective growth opportunities.
Scale and Diversification vs. Operational Precision
DHI’s broader geographic diversification offers a wider moat, cushioning regional downturns. NVR’s tighter, premium niche creates a deeper moat through margin robustness. I see DHI better positioned to defend market share long-term due to scale, but margin trends warrant cautious monitoring.
Which stock offers better returns?
Over the past year, both D.R. Horton, Inc. and NVR, Inc. show mixed trading dynamics with recent upward momentum despite their overall bearish trends.
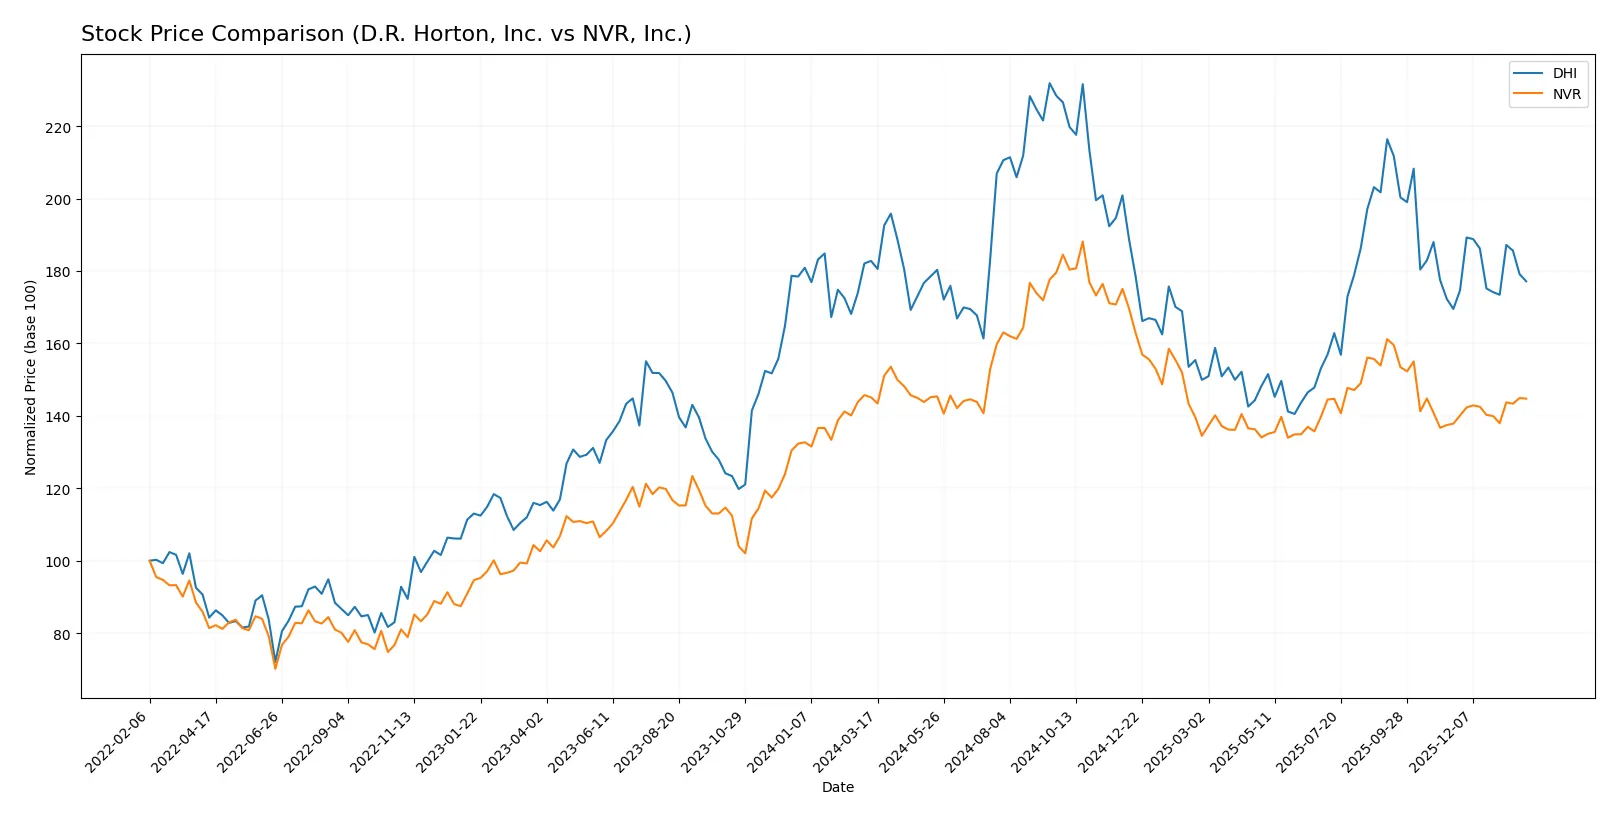
Trend Comparison
D.R. Horton, Inc. experienced a 3.09% price decline over 12 months, marking a bearish trend with accelerating downward momentum. Recent months show a 4.5% recovery.
NVR, Inc. recorded a slight 0.25% drop, also bearish but close to neutral. Its recent 5.0% gain signals accelerating positive momentum despite high volatility.
NVR’s smaller overall loss and stronger recent rebound indicate it delivered higher market performance than D.R. Horton over the past year.
Target Prices
Analysts show a bullish consensus on both D.R. Horton and NVR, indicating significant upside potential from current levels.
| Company | Target Low | Target High | Consensus |
|---|---|---|---|
| D.R. Horton, Inc. | 129 | 195 | 168.71 |
| NVR, Inc. | 8,350 | 9,022 | 8,686 |
The target consensus for D.R. Horton sits about 13% above the current $149 price, signaling moderate upside. NVR’s consensus target exceeds its $7,644 share price by roughly 14%, reflecting strong investor confidence.

Don’t Let Luck Decide Your Entry Point
Optimize your entry points with our advanced ProRealTime indicators. You’ll get efficient buy signals with precise price targets for maximum performance. Start outperforming now!
How do institutions grade them?
The following tables summarize recent institutional grades for D.R. Horton, Inc. and NVR, Inc.:
D.R. Horton, Inc. Grades
The table below shows the latest grades from key financial institutions for D.R. Horton, Inc.:
| Grading Company | Action | New Grade | Date |
|---|---|---|---|
| Argus Research | Maintain | Buy | 2026-01-23 |
| Barclays | Maintain | Equal Weight | 2026-01-21 |
| Evercore ISI Group | Maintain | In Line | 2026-01-21 |
| B of A Securities | Maintain | Neutral | 2026-01-21 |
| Citigroup | Maintain | Neutral | 2026-01-08 |
| Citizens | Downgrade | Market Perform | 2026-01-07 |
| UBS | Maintain | Buy | 2026-01-06 |
| Wells Fargo | Downgrade | Equal Weight | 2026-01-06 |
| Wells Fargo | Maintain | Overweight | 2025-12-08 |
| Barclays | Maintain | Equal Weight | 2025-12-08 |
NVR, Inc. Grades
The following table compiles recent grades issued by recognized institutions for NVR, Inc.:
| Grading Company | Action | New Grade | Date |
|---|---|---|---|
| Zelman & Assoc | Upgrade | Hold | 2026-01-29 |
| UBS | Maintain | Neutral | 2026-01-06 |
| UBS | Maintain | Neutral | 2025-10-23 |
| B of A Securities | Maintain | Buy | 2025-10-10 |
| UBS | Maintain | Neutral | 2025-07-24 |
| JP Morgan | Maintain | Neutral | 2025-07-24 |
| UBS | Maintain | Neutral | 2025-04-23 |
| UBS | Maintain | Neutral | 2025-01-29 |
| JP Morgan | Maintain | Neutral | 2025-01-29 |
| UBS | Maintain | Neutral | 2025-01-08 |
Which company has the best grades?
D.R. Horton holds a stronger consensus with multiple “Buy” and “Overweight” ratings. NVR’s grades lean more toward “Neutral” with fewer “Buy” ratings. This divergence suggests D.R. Horton currently enjoys greater institutional confidence, potentially influencing investor sentiment and capital allocation decisions.
Risks specific to each company
The following categories identify the critical pressure points and systemic threats facing both firms in the 2026 market environment:
1. Market & Competition
D.R. Horton, Inc.
- Operates across 31 states, facing broad regional competition and economic cycles.
NVR, Inc.
- Focused on fewer states, with concentrated market risk but niche luxury segment exposure.
2. Capital Structure & Debt
D.R. Horton, Inc.
- Low debt-to-equity (0.25) and debt-to-assets (17%) indicate a conservative balance sheet.
NVR, Inc.
- Virtually no debt reported, signaling strong financial stability but potential under-leverage.
3. Stock Volatility
D.R. Horton, Inc.
- Beta of 1.42 shows higher volatility than the market, increasing investment risk.
NVR, Inc.
- Beta near 1.01 reflects market-level volatility, suggesting more stable price movements.
4. Regulatory & Legal
D.R. Horton, Inc.
- Exposure to multi-state building codes and mortgage financing regulations.
NVR, Inc.
- Similar regulatory environment but less geographic dispersion reduces complexity.
5. Supply Chain & Operations
D.R. Horton, Inc.
- Large scale operations across 98 markets may face supply chain disruptions.
NVR, Inc.
- Smaller footprint simplifies supply chain but limits economies of scale.
6. ESG & Climate Transition
D.R. Horton, Inc.
- Owns energy-related assets, raising exposure to climate regulation and transition risks.
NVR, Inc.
- Less diversified asset base may reduce ESG risk but limits green initiatives impact.
7. Geopolitical Exposure
D.R. Horton, Inc.
- Primarily U.S.-focused, limited international geopolitical risk.
NVR, Inc.
- U.S.-centric as well, with regional market concentration risk.
Which company shows a better risk-adjusted profile?
D.R. Horton’s most impactful risk lies in its broad geographic footprint, increasing exposure to supply chain and regulatory complexity. NVR’s critical risk is its limited diversification and weaker asset utilization metrics, indicating operational vulnerability. I view D.R. Horton as having a better risk-adjusted profile due to stronger financial ratios and safer leverage, despite higher volatility. The contrasting Altman Z-score—DHI in a safe zone versus unavailable for NVR—reinforces this concern.
Final Verdict: Which stock to choose?
D.R. Horton, Inc. (DHI) excels as a cash-generating powerhouse with efficient capital deployment, despite a warning sign in its unusually high current ratio signaling potential liquidity management issues. It suits investors seeking aggressive growth in a cyclical housing market.
NVR, Inc. offers a strategic moat through its lean operations and strong free cash flow, underpinned by minimal debt and superior interest coverage. It presents a safer profile compared to DHI, fitting well with growth-at-a-reasonable-price (GARP) investors who value financial prudence.
If you prioritize robust cash flow and aggressive expansion, DHI outshines thanks to its operational efficiency and market scale. However, if you seek better stability and lower financial risk, NVR offers a more conservative investment scenario with solid margins and disciplined capital structure. Each stock appeals to distinct investor profiles balancing growth and risk differently.
Disclaimer: Investment carries a risk of loss of initial capital. The past performance is not a reliable indicator of future results. Be sure to understand risks before making an investment decision.
Go Further
I encourage you to read the complete analyses of D.R. Horton, Inc. and NVR, Inc. to enhance your investment decisions: