Home > Comparison > Consumer Cyclical > DHI vs LEN
The strategic rivalry between D.R. Horton, Inc. and Lennar Corporation shapes the U.S. residential construction landscape. D.R. Horton operates as a broad-based homebuilder with extensive regional reach, while Lennar combines homebuilding with diverse financial services and multifamily development. This analysis contrasts their operational models and growth vectors to identify which company offers the superior risk-adjusted return for a diversified portfolio amidst cyclical housing market dynamics.

Table of contents
Companies Overview
D.R. Horton and Lennar dominate the U.S. residential construction market, shaping housing trends nationwide.
D.R. Horton: America’s Leading Homebuilder
D.R. Horton stands as the largest U.S. homebuilder, generating revenue through land acquisition, residential construction, and sales across 31 states. Its core business includes single-family and attached homes, supported by mortgage financing and title services. In 2026, the company focuses strategically on expanding in diverse regional markets while enhancing its multi-family rental portfolio.
Lennar Corporation: Diverse Homebuilding Powerhouse
Lennar operates nationwide with a broad footprint in single-family and multifamily homebuilding. Revenue streams come from home sales, land development, mortgage financing, and securitized commercial loans. The company’s competitive advantage lies in serving first-time to luxury buyers, emphasizing integrated financial services and multifamily property management to capture varied market segments.
Strategic Collision: Similarities & Divergences
Both firms rely on vertical integration including mortgage and title services but differ in market targeting: D.R. Horton leans heavily on regional expansion and multi-family rentals, while Lennar diversifies across buyer segments and securitized lending. Their primary battleground is the U.S. housing market, where scale and financing capabilities dictate share. Investors face distinct profiles: D.R. Horton with broad geographic reach and Lennar with diversified buyer focus and financial innovation.
Income Statement Comparison
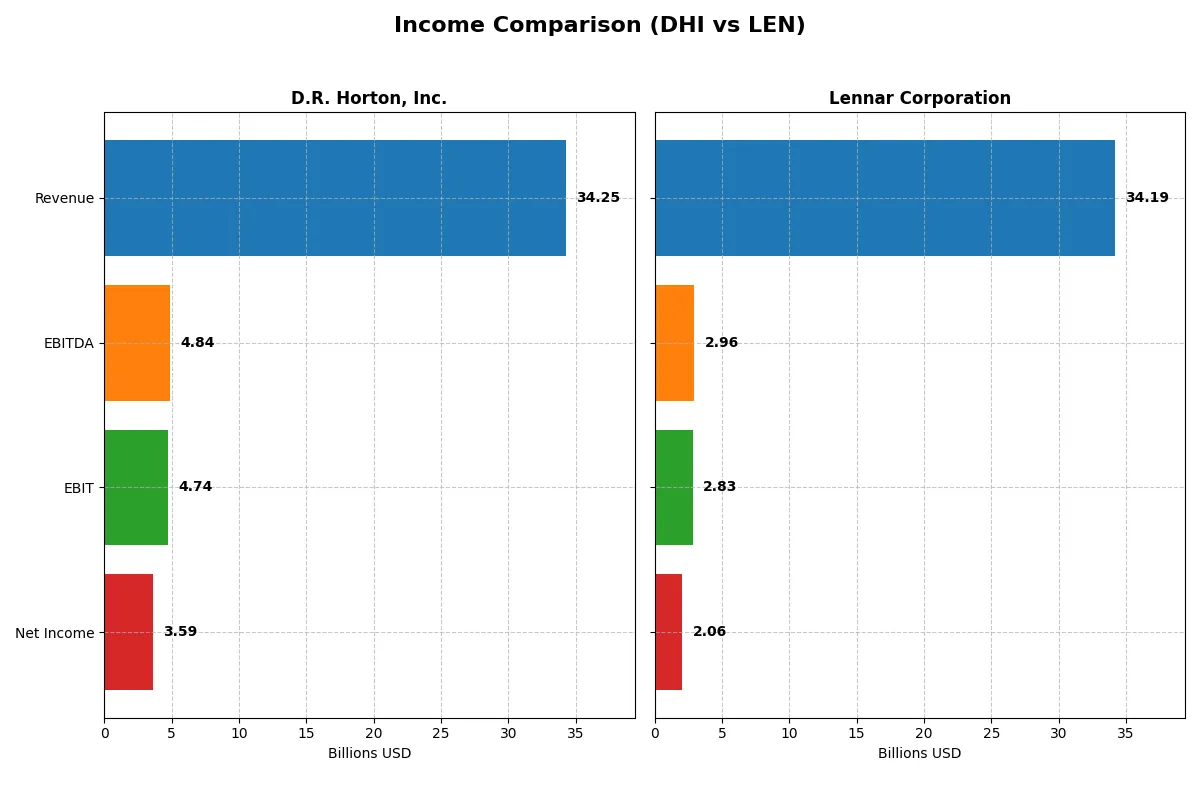
The following data dissects the core profitability and scalability of both corporate engines to reveal who dominates the bottom line:
| Metric | D.R. Horton, Inc. (DHI) | Lennar Corporation (LEN) |
|---|---|---|
| Revenue | 34.3B | 34.2B |
| Cost of Revenue | 26.1B | 28.1B |
| Operating Expenses | 3.7B | 3.3B |
| Gross Profit | 8.1B | 6.1B |
| EBITDA | 4.8B | 3.0B |
| EBIT | 4.7B | 2.8B |
| Interest Expense | 0 | 14M |
| Net Income | 3.6B | 2.1B |
| EPS | 11.62 | 7.98 |
| Fiscal Year | 2025 | 2025 |
Income Statement Analysis: The Bottom-Line Duel
This income statement comparison reveals which company operates with superior efficiency and stronger profitability under current market conditions.
D.R. Horton, Inc. Analysis
D.R. Horton’s revenue peaked at 36.8B in 2024 before declining 7% to 34.3B in 2025. Net income fell 25% over the last year to 3.6B, reflecting margin pressure. Its gross margin remains healthy at 23.7%, and net margin stands at a solid 10.5%. The company’s declining profitability signals weakening momentum despite favorable margins.
Lennar Corporation Analysis
Lennar’s revenue slid nearly 4% from 35.5B in 2024 to 34.2B in 2025, while net income halved to roughly 2.0B. Its gross margin contracted sharply to 17.7%, and net margin dropped to 6.0%, highlighting eroding efficiency. The steep decline in earnings and margins suggests Lennar faces more significant operational challenges than its peer.
Margin Strength vs. Profit Resilience
D.R. Horton outperforms Lennar on every profit metric, boasting higher gross and net margins with better absolute net income. Both firms experienced revenue declines, but D.R. Horton’s superior margin profile cushions its earnings drop. For investors, D.R. Horton’s more resilient profitability and margin discipline present a fundamentally stronger income statement profile.
Financial Ratios Comparison
These vital ratios act as a diagnostic tool to expose the underlying fiscal health, valuation premiums, and capital efficiency of the companies compared below:
| Ratios | D.R. Horton, Inc. (DHI) | Lennar Corporation (LEN) |
|---|---|---|
| ROE | 14.8% | 9.4% |
| ROIC | 10.1% | 6.6% |
| P/E | 14.6 | 16.3 |
| P/B | 2.16 | 1.53 |
| Current Ratio | 17.4 | 3.12 |
| Quick Ratio | 4.51 | 0.96 |
| D/E | 0.25 | 0.29 |
| Debt-to-Assets | 17.0% | 18.3% |
| Interest Coverage | 0 | 198.2 |
| Asset Turnover | 0.97 | 0.99 |
| Fixed Asset Turnover | 399 | 37.5 |
| Payout ratio | 13.8% | 25.3% |
| Dividend yield | 0.95% | 1.55% |
| Fiscal Year | 2025 | 2025 |
Efficiency & Valuation Duel: The Vital Signs
Financial ratios act as the company’s DNA, exposing hidden risks and operational strength beyond surface-level metrics.
D.R. Horton, Inc.
D.R. Horton delivers solid profitability with a 14.82% ROE and a favorable 10.47% net margin, reflecting operational efficiency. Its P/E of 14.58 signals a reasonably valued stock, neither stretched nor cheap. The company returns value through modest dividends and maintains a strong reinvestment profile, balancing growth and shareholder returns.
Lennar Corporation
Lennar shows weaker profitability, with a 9.37% ROE and a neutral 6.02% net margin, indicating less operational efficiency than peers. The stock trades at a neutral P/E of 16.31, suggesting fairly priced shares. Lennar offers a higher dividend yield of 1.55%, offsetting its slower growth and signaling some income focus.
Premium Valuation vs. Operational Safety
D.R. Horton combines better profitability and a more favorable valuation, offering a stronger risk/reward balance. Lennar’s higher dividend yield may appeal to income investors but reflects weaker operational metrics. Investors prioritizing growth and efficiency might find D.R. Horton better suited to their goals.
Which one offers the Superior Shareholder Reward?
I see D.R. Horton (DHI) pays modest dividends with yields around 0.9%, supported by low payout ratios near 14%, indicating strong free cash flow coverage (FCF/Div > 5x). It also executes consistent buybacks, boosting total returns sustainably. Lennar (LEN) yields a higher 1.5% dividend but spends heavily on dividends with payout ratios around 25%, straining free cash flow (FCF/Div < 1x). LEN’s buyback program is less intense, limiting capital return flexibility. I judge DHI’s balanced dividend and robust buyback strategy as more sustainable and superior for long-term total shareholder reward in 2026.
Comparative Score Analysis: The Strategic Profile
The radar chart reveals the fundamental DNA and trade-offs of D.R. Horton, Inc. and Lennar Corporation, highlighting their financial strengths and vulnerabilities:
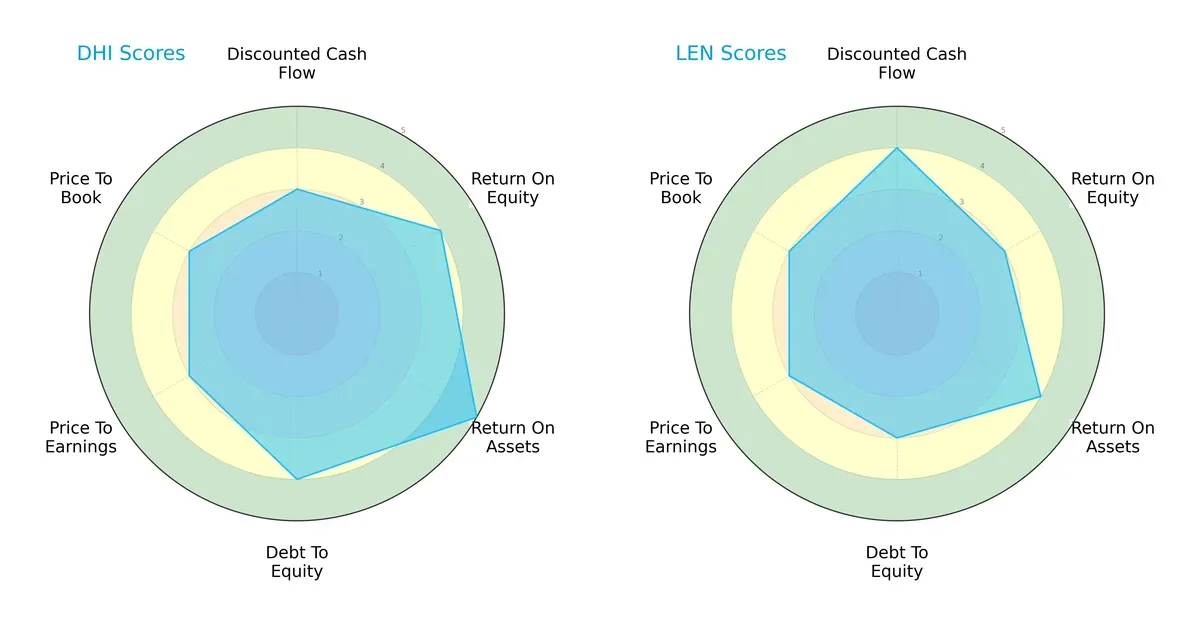
D.R. Horton leads with a stronger return on assets (5 vs. 4) and a superior debt-to-equity score (4 vs. 3), signaling more efficient asset use and a sturdier balance sheet. Lennar edges ahead in discounted cash flow (4 vs. 3), reflecting better valuation on future cash flows. Both share similar overall scores, but DHI presents a more balanced profile, while LEN leans on its DCF advantage.
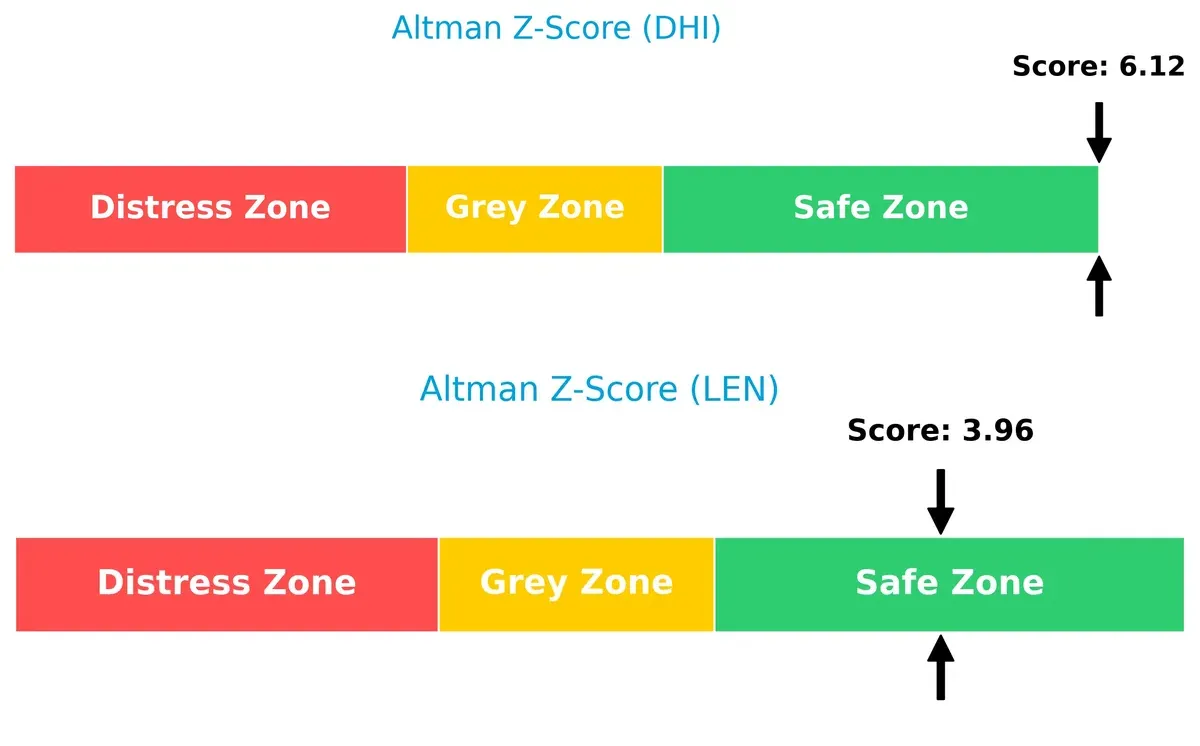
Bankruptcy Risk: Solvency Showdown
The Altman Z-Scores for both firms place them comfortably in the safe zone, with DHI at 6.12 and LEN at 3.96, confirming strong solvency and a low bankruptcy risk in this cycle:
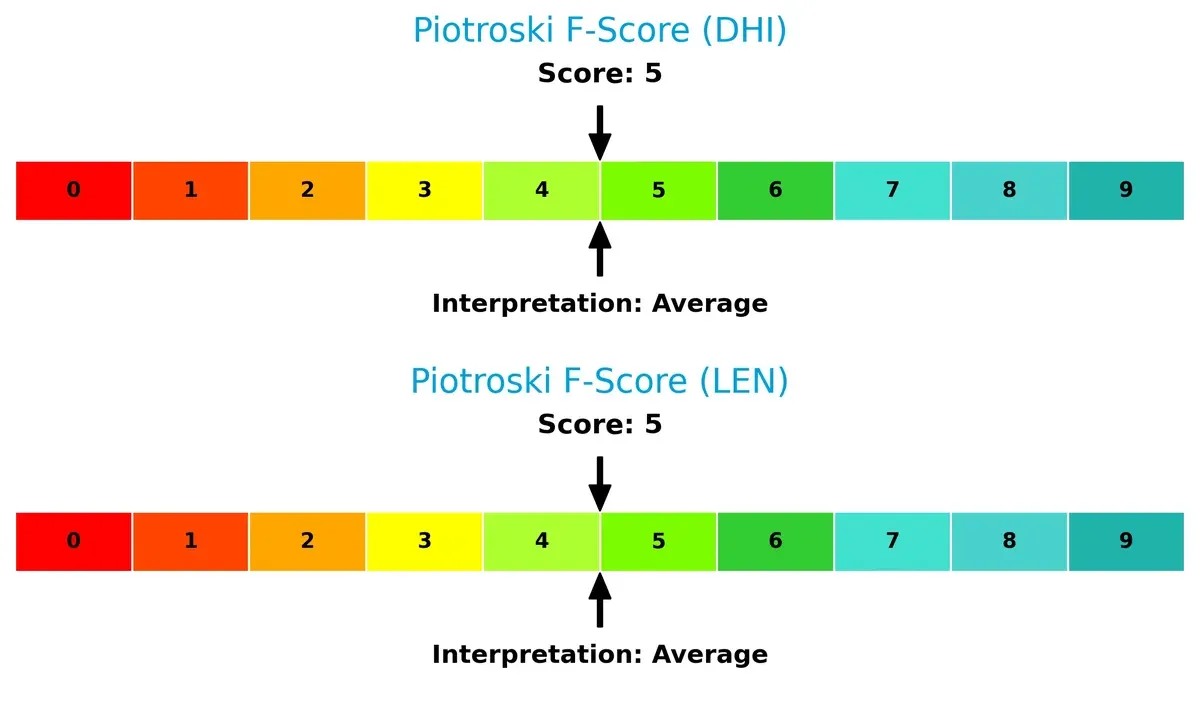
Financial Health: Quality of Operations
Both DHI and LEN share identical Piotroski F-Scores of 5, indicating average financial health. Neither shows significant red flags, but both have room for operational improvements to reach peak financial strength:
How are the two companies positioned?
This section dissects the operational DNA of DHI and LEN by comparing their revenue distribution and internal strengths and weaknesses. The goal is to confront their economic moats to reveal which model offers the most resilient, sustainable competitive edge today.
Revenue Segmentation: The Strategic Mix
This visual comparison dissects how D.R. Horton and Lennar diversify their income streams and where their primary sector bets lie:
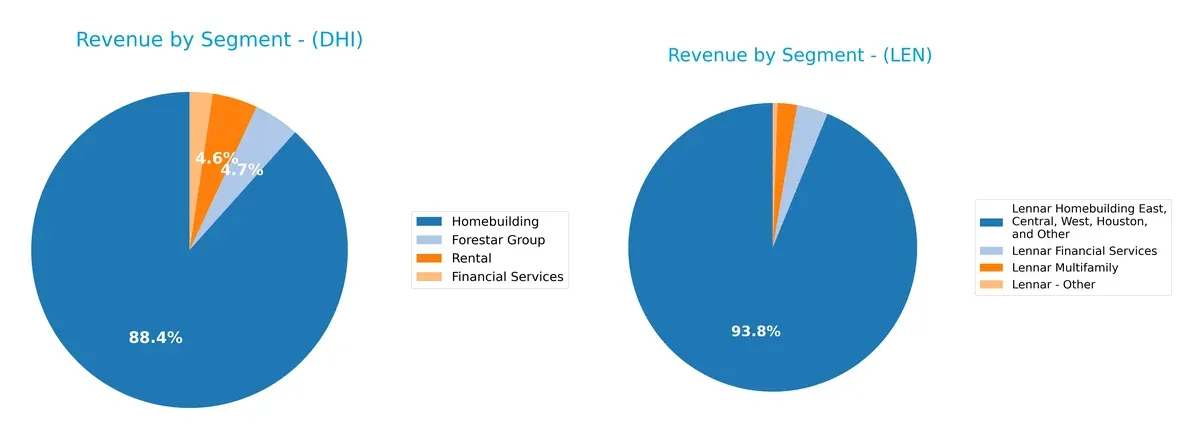
D.R. Horton anchors its revenue overwhelmingly in Homebuilding at $31.5B (2025), with smaller contributions from Forestar Group ($1.66B) and Rental ($1.64B). Lennar also pivots on Homebuilding with $32.3B but shows a more balanced mix including Financial Services ($1.2B) and Multifamily ($750M). Lennar’s diversification reduces concentration risk, while D.R. Horton’s dominance in Homebuilding signals strong ecosystem lock-in but higher sector sensitivity.
Strengths and Weaknesses Comparison
This table compares the Strengths and Weaknesses of D.R. Horton, Inc. and Lennar Corporation:
DHI Strengths
- Higher net margin and ROIC indicate better profitability
- Strong quick ratio and low debt-to-assets show financial stability
- Exceptional fixed asset turnover signals efficient asset use
- Broad geographic revenue spread across six U.S. regions
- Diverse revenue streams including rental and Forestar Group
LEN Strengths
- Favorable debt-to-equity and interest coverage ratios improve financial resilience
- Multifaceted homebuilding presence in multiple U.S. regions including Texas
- Steady financial services revenue contributes to diversification
- Neutral asset turnover and fixed asset turnover ratios
- Larger multifamily segment complements homebuilding
DHI Weaknesses
- Unfavorable current ratio suggests potential short-term liquidity risks
- Dividend yield under 1% may deter income-focused investors
- Moderate ROE with neutral status limits equity efficiency
- PB ratio neutral, indicating average market valuation
LEN Weaknesses
- Unfavorable ROE indicates weaker returns on equity capital
- Neutral net margin reflects lower profitability compared to DHI
- Current ratio below 4 signals liquidity caution
- Quick ratio near 1 suggests limited immediate asset liquidity
Overall, DHI demonstrates stronger profitability and asset efficiency with a wider geographic reach and diversified operations. LEN shows solid financial structure but faces challenges in profitability and liquidity metrics. Both must navigate these dynamics to optimize competitive positioning.
The Moat Duel: Analyzing Competitive Defensibility
A structural moat protects long-term profits from competition’s erosion. Without it, market share and margins quickly deteriorate:
D.R. Horton, Inc.: Geographic Diversification and Scale Advantage
D.R. Horton leverages broad geographic reach across 31 states, stabilizing revenue despite cyclical homebuilding risks. Its slight value erosion in ROIC warns of margin pressure in 2026.
Lennar Corporation: Integrated Financial Services Moat
Lennar combines homebuilding with mortgage and title services, creating customer lock-in unlike D.R. Horton’s scale focus. Yet, steep ROIC decline signals weakening capital efficiency amid market headwinds.
Scale Reach vs. Vertical Integration: Who Holds the Stronger Moat?
Both firms shed value, but D.R. Horton’s diversified footprint cushions shocks better than Lennar’s faltering integration play. I see D.R. Horton better poised to defend market share in 2026.
Which stock offers better returns?
Stock prices for D.R. Horton, Inc. and Lennar Corporation over the past year reveal distinct bearish trends, with recent shifts highlighting diverging momentum and trading activity.
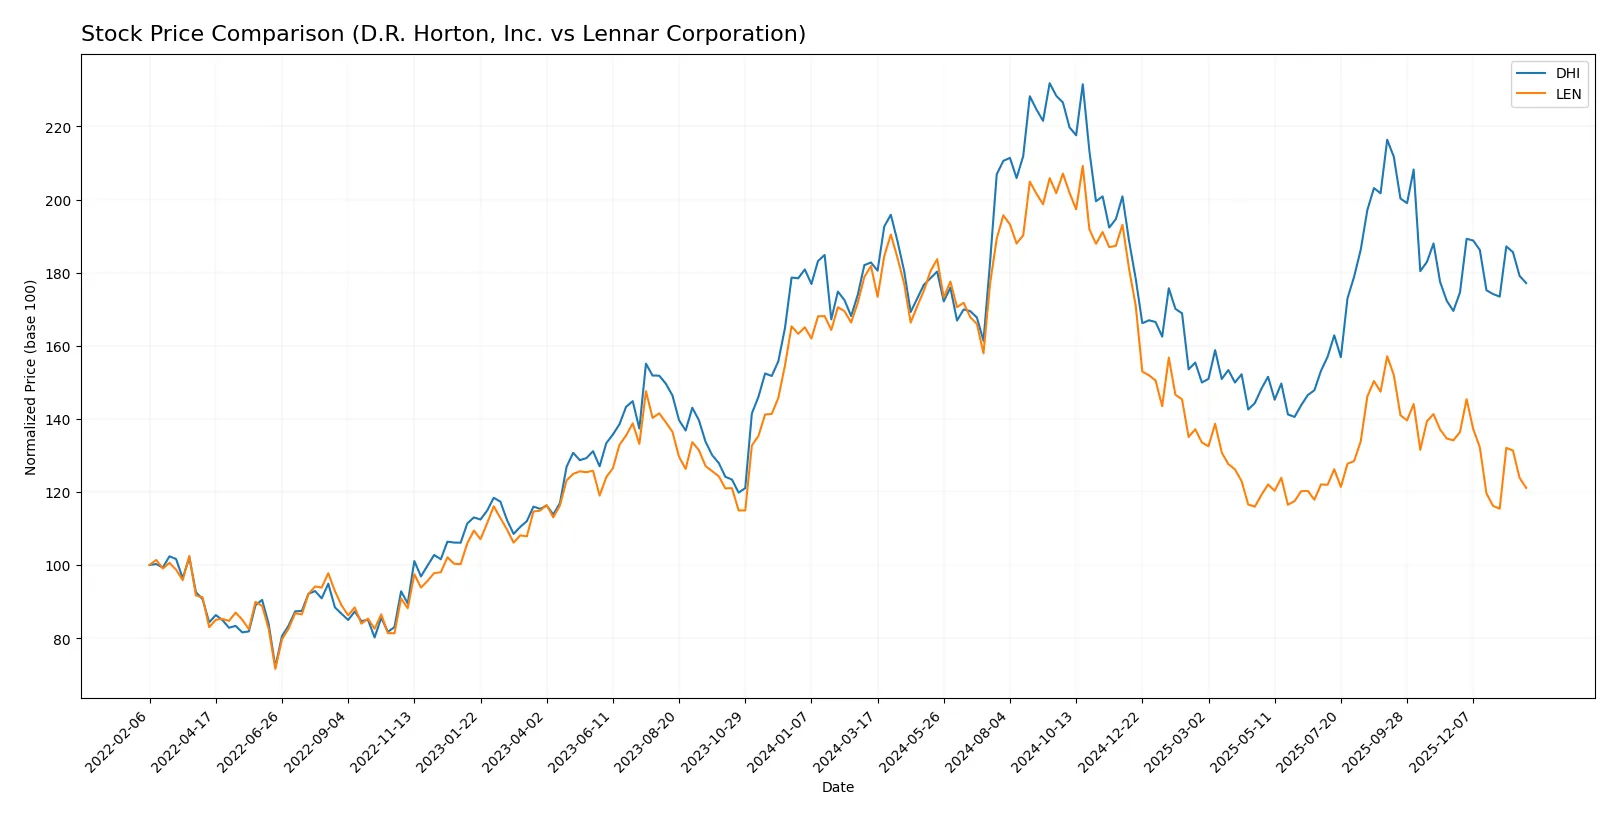
Trend Comparison
D.R. Horton’s stock declined 3.09% over the last 12 months, marking a bearish trend with accelerating downward momentum and a high volatility of 20.01%. The price ranged between 118.06 and 194.8.
Lennar’s stock fell sharply by 33.4% in the same period, showing a bearish trend with decelerating losses and even higher volatility at 25.88%. Prices fluctuated between 104.22 and 188.93.
D.R. Horton outperformed Lennar, delivering a smaller loss and an accelerating recovery, while Lennar’s decline was deeper and its recent trend more negative.
Target Prices
Analysts show a generally positive outlook for both D.R. Horton, Inc. and Lennar Corporation based on target consensus data.
| Company | Target Low | Target High | Consensus |
|---|---|---|---|
| D.R. Horton, Inc. | 129 | 195 | 168.71 |
| Lennar Corporation | 88 | 140 | 106.88 |
The target consensus for D.R. Horton at $168.71 suggests upside from the current $148.84 price. Lennar’s consensus of $106.88 is modestly below its current $109.35 price, indicating mixed analyst expectations.

Don’t Let Luck Decide Your Entry Point
Optimize your entry points with our advanced ProRealTime indicators. You’ll get efficient buy signals with precise price targets for maximum performance. Start outperforming now!
How do institutions grade them?
Here is a summary of recent institutional grades for D.R. Horton, Inc. and Lennar Corporation:
D.R. Horton, Inc. Grades
The table below shows the latest grades from reputable institutions for D.R. Horton, Inc.:
| Grading Company | Action | New Grade | Date |
|---|---|---|---|
| Argus Research | Maintain | Buy | 2026-01-23 |
| Barclays | Maintain | Equal Weight | 2026-01-21 |
| Evercore ISI Group | Maintain | In Line | 2026-01-21 |
| B of A Securities | Maintain | Neutral | 2026-01-21 |
| Citigroup | Maintain | Neutral | 2026-01-08 |
| Citizens | Downgrade | Market Perform | 2026-01-07 |
| UBS | Maintain | Buy | 2026-01-06 |
| Wells Fargo | Downgrade | Equal Weight | 2026-01-06 |
| Wells Fargo | Maintain | Overweight | 2025-12-08 |
| Barclays | Maintain | Equal Weight | 2025-12-08 |
Lennar Corporation Grades
The table below displays recent grades for Lennar Corporation from recognized grading firms:
| Grading Company | Action | New Grade | Date |
|---|---|---|---|
| Citigroup | Maintain | Neutral | 2026-01-08 |
| Citizens | Downgrade | Market Perform | 2026-01-07 |
| Wells Fargo | Maintain | Equal Weight | 2026-01-06 |
| UBS | Downgrade | Neutral | 2026-01-06 |
| Barclays | Maintain | Underweight | 2025-12-18 |
| Keefe, Bruyette & Woods | Maintain | Market Perform | 2025-12-18 |
| B of A Securities | Downgrade | Underperform | 2025-12-18 |
| Evercore ISI Group | Downgrade | Underperform | 2025-12-18 |
| UBS | Maintain | Buy | 2025-12-18 |
| RBC Capital | Downgrade | Underperform | 2025-12-18 |
Which company has the best grades?
D.R. Horton holds stronger and more consistent grades, including multiple “Buy” ratings. Lennar shows a trend of downgrades and several “Underperform” ratings. Investors may perceive D.R. Horton as the more favorably viewed stock by institutions.
Risks specific to each company
The following categories identify the critical pressure points and systemic threats facing both firms in the 2026 market environment:
1. Market & Competition
D.R. Horton, Inc.
- Dominates 31 states and 98 markets with diverse product lines, but faces intense regional competition.
Lennar Corporation
- Operates nationwide with segmented focus; competitive pressures from first-time to luxury homebuyers.
2. Capital Structure & Debt
D.R. Horton, Inc.
- Low debt-to-equity at 0.25 and strong interest coverage indicate conservative leverage.
Lennar Corporation
- Slightly higher debt-to-equity at 0.29 but maintains solid interest coverage of 204x.
3. Stock Volatility
D.R. Horton, Inc.
- Beta of 1.42 suggests above-market volatility consistent with cyclical sector norms.
Lennar Corporation
- Beta slightly higher at 1.43, reflecting comparable market sensitivity.
4. Regulatory & Legal
D.R. Horton, Inc.
- Faces typical residential construction regulations and zoning laws across multiple states.
Lennar Corporation
- Subject to similar regulatory frameworks; exposure to state-level policy shifts in Florida and beyond.
5. Supply Chain & Operations
D.R. Horton, Inc.
- Broad geographic footprint may mitigate localized supply disruptions but adds complexity.
Lennar Corporation
- Diverse regional operations increase supply chain risks amid fluctuating material costs.
6. ESG & Climate Transition
D.R. Horton, Inc.
- Emerging ESG initiatives but limited disclosure; energy assets may pose transition risks.
Lennar Corporation
- Increasing focus on sustainability, yet climate-related regulations could impact land development.
7. Geopolitical Exposure
D.R. Horton, Inc.
- Primarily US-based with low direct geopolitical risk; regional economic shifts may affect markets.
Lennar Corporation
- Also US-focused; exposure to Florida’s hurricane risk and broader macroeconomic volatility.
Which company shows a better risk-adjusted profile?
D.R. Horton’s strongest risk is its complex operational footprint, while Lennar’s main concern lies in its weaker profitability and regulatory exposure in highly volatile regions. DHI’s superior capital structure and higher net margins grant it a better risk-adjusted profile. Notably, DHI’s Altman Z-Score of 6.12 outpaces LEN’s 3.96, signaling stronger financial safety.
Final Verdict: Which stock to choose?
D.R. Horton, Inc. (DHI) shines as a cash-generating powerhouse with robust operational efficiency. Its exceptionally strong liquidity signals a conservative financial buffer, though an unusually high current ratio warrants vigilance. DHI suits aggressive growth portfolios seeking firms with solid free cash flow and operational resilience.
Lennar Corporation (LEN) holds a strategic moat in its scale and inventory management, delivering steady, if more modest, returns. Its balance sheet presents a safer profile relative to DHI’s extreme liquidity, offering a more traditional risk-reward balance. LEN fits well in GARP portfolios prioritizing consistent cash conversion and moderate growth.
If you prioritize aggressive cash flow generation and operational strength, DHI is the compelling choice due to its superior liquidity and efficiency. However, if you seek better stability with a strategic inventory moat and a more balanced risk profile, LEN offers a more prudent scenario. Both stocks face profitability headwinds, demanding careful monitoring.
Disclaimer: Investment carries a risk of loss of initial capital. The past performance is not a reliable indicator of future results. Be sure to understand risks before making an investment decision.
Go Further
I encourage you to read the complete analyses of D.R. Horton, Inc. and Lennar Corporation to enhance your investment decisions: