In today’s rapidly evolving cybersecurity landscape, choosing the right investment requires a clear understanding of key players. Zscaler, Inc. and CyberArk Software Ltd. both operate in the software infrastructure sector, focusing on cloud security and privileged access management, respectively. Their innovative approaches target overlapping markets with strong growth potential. This article will analyze these companies to help you identify the most compelling investment opportunity for your portfolio.
Table of contents
Companies Overview
I will begin the comparison between Zscaler and CyberArk by providing an overview of these two companies and their main differences.
Zscaler Overview
Zscaler, Inc. is a US-based cloud security company specializing in providing secure access solutions for users, servers, and IoT devices to externally managed applications and private clouds. Founded in 2007 and headquartered in San Jose, California, Zscaler offers a range of products including Internet Access, Private Access, and Digital Experience solutions, serving industries such as finance, healthcare, and technology with a workforce of 7,348 employees.
CyberArk Overview
CyberArk Software Ltd., founded in 1999 and headquartered in Petah Tikva, Israel, develops software-based security solutions focusing on privileged access management and identity services. Its product suite includes Privileged Access Manager, Endpoint Privilege Manager, and Cloud Entitlements Manager, targeting industries like financial services, manufacturing, and government agencies. CyberArk employs 3,793 people and operates globally through direct sales and partners.
Key similarities and differences
Both Zscaler and CyberArk operate in the software infrastructure security sector, offering cloud-based security solutions to enterprise clients worldwide. While Zscaler emphasizes secure access to externally managed and internal applications via cloud security platforms, CyberArk focuses on protecting privileged access and identity management across on-premises and cloud environments. The two differ in employee size and market capitalization, with Zscaler larger in both aspects.
Income Statement Comparison
The table below presents a side-by-side comparison of the key income statement metrics for Zscaler, Inc. and CyberArk Software Ltd. based on their most recent fiscal year data.
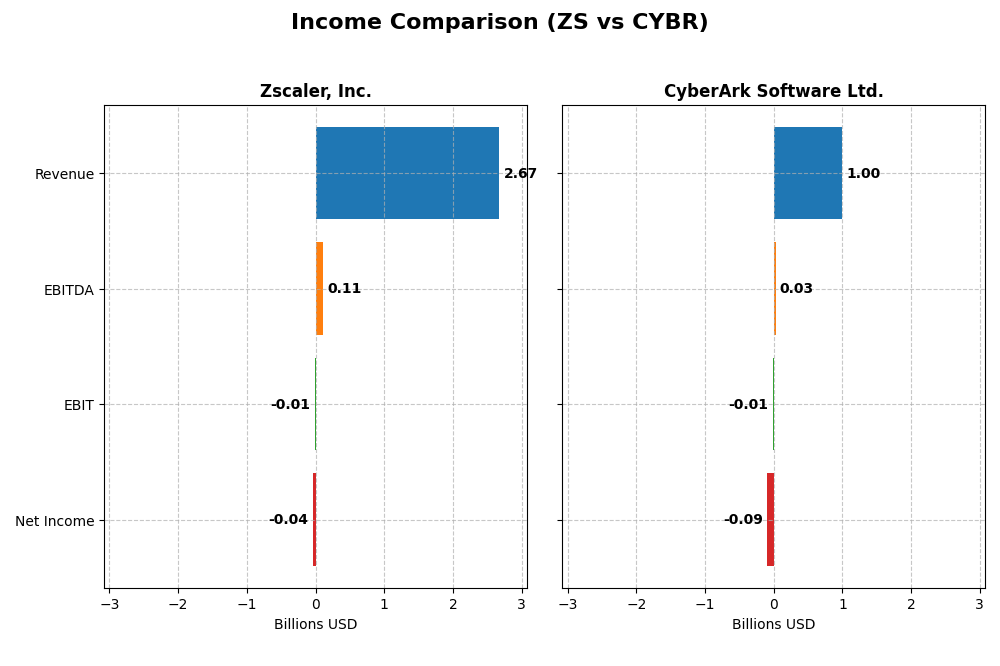
| Metric | Zscaler, Inc. (ZS) | CyberArk Software Ltd. (CYBR) |
|---|---|---|
| Market Cap | 34.1B USD | 22.9B USD |
| Revenue | 2.67B USD | 1.00B USD |
| EBITDA | 112M USD | 29M USD |
| EBIT | -8.8M USD | -13.3M USD |
| Net Income | -41.5M USD | -93.5M USD |
| EPS | -0.27 USD | -2.12 USD |
| Fiscal Year | 2025 | 2024 |
Income Statement Interpretations
Zscaler, Inc.
Zscaler’s revenue showed a strong upward trend from 673M in 2021 to 2.67B in 2025, with net income losses narrowing from -262M to -41M. Gross margins remained favorable at 76.87%, while net margins were still negative at -1.55%. The 2025 fiscal year saw solid revenue growth of 23.31%, improved EBIT by 45.67%, and better net margin performance, indicating operational progress.
CyberArk Software Ltd.
CyberArk’s revenue grew steadily from 464M in 2020 to 1.0B in 2024, but net income declined from a loss of -6M to -93M. Gross margin stayed favorable at 79.18%, though net margin remained deeply negative at -9.34%. Despite a 33.1% revenue rise in 2024, net margin and EPS growth deteriorated, reflecting challenges in converting top-line growth into profitability.
Which one has the stronger fundamentals?
Zscaler exhibits stronger fundamentals with a more favorable income statement profile, including significant revenue growth of nearly 300% over five years and improving margins. CyberArk, while growing revenue, suffers from more pronounced net losses and worsening profitability metrics. Zscaler’s overall income statement evaluation is favorable, contrasting with CyberArk’s neutral stance, indicating a more robust financial trajectory for Zscaler.
Financial Ratios Comparison
The following table compares key financial ratios for Zscaler, Inc. and CyberArk Software Ltd. based on their most recent fiscal year data, providing an overview of profitability, valuation, liquidity, and leverage metrics.
| Ratios | Zscaler, Inc. (ZS) FY 2025 | CyberArk Software Ltd. (CYBR) FY 2024 |
|---|---|---|
| ROE | -2.31% | -3.94% |
| ROIC | -3.18% | -2.85% |
| P/E | -1063 | -157.5 |
| P/B | 24.51 | 6.21 |
| Current Ratio | 2.01 | 1.48 |
| Quick Ratio | 2.01 | 1.48 |
| D/E (Debt-to-Equity) | 1.00 | 0.01 |
| Debt-to-Assets | 28.0% | 0.9% |
| Interest Coverage | -13.49 | -17.90 |
| Asset Turnover | 0.42 | 0.30 |
| Fixed Asset Turnover | 4.22 | 51.11 |
| Payout Ratio | 0 | 0 |
| Dividend Yield | 0 | 0 |
Interpretation of the Ratios
Zscaler, Inc.
Zscaler shows a mixed ratio profile with favorable liquidity ratios like a current ratio of 2.01, indicating solid short-term financial health, but struggles with profitability metrics such as negative net margin (-1.55%) and return on equity (-2.31%). The company does not pay dividends, reflecting its reinvestment strategy and focus on growth, typical for a tech firm prioritizing R&D and operational expansion.
CyberArk Software Ltd.
CyberArk exhibits similar challenges, with unfavorable net margin (-9.34%) and return on equity (-3.94%) ratios, suggesting ongoing profitability issues. Its liquidity is moderate with a neutral current ratio of 1.48 and a favorable quick ratio. Like Zscaler, CyberArk does not distribute dividends, likely emphasizing reinvestment in technology and innovation over shareholder payouts at this growth stage.
Which one has the best ratios?
Both companies present a slightly unfavorable overall ratio evaluation, each with 35.71% favorable and 50% unfavorable ratios. Zscaler offers stronger liquidity, whereas CyberArk benefits from lower leverage and a higher fixed asset turnover. Neither company currently delivers dividends, reflecting their focus on growth and reinvestment rather than immediate shareholder returns.
Strategic Positioning
This section compares the strategic positioning of Zscaler and CyberArk, including their market position, key segments, and exposure to technological disruption:
Zscaler, Inc.
- Leading cloud security provider with a $34B market cap facing moderate competition.
- Focuses on cloud security, SaaS, private access, and workload segmentation solutions.
- Positioned strongly in cloud security with innovative digital experience and posture management.
CyberArk Software Ltd.
- Mid-sized cybersecurity firm with a $23B market cap operating under moderate competitive pressure.
- Offers privileged access management, identity and access management, and cloud entitlement management across segments.
- Exposed to cloud and endpoint security disruptions with SaaS and on-premises subscription models.
Zscaler vs CyberArk Positioning
Zscaler has a diversified cloud security platform addressing multiple enterprise needs, while CyberArk concentrates on privileged access and identity management. Zscaler’s broader scope supports varied customer industries; CyberArk’s focused approach targets specific security challenges.
Which has the best competitive advantage?
Both companies are shedding value with ROIC below WACC; however, Zscaler shows improving profitability, whereas CyberArk’s profitability is declining, indicating a slightly better competitive advantage for Zscaler.
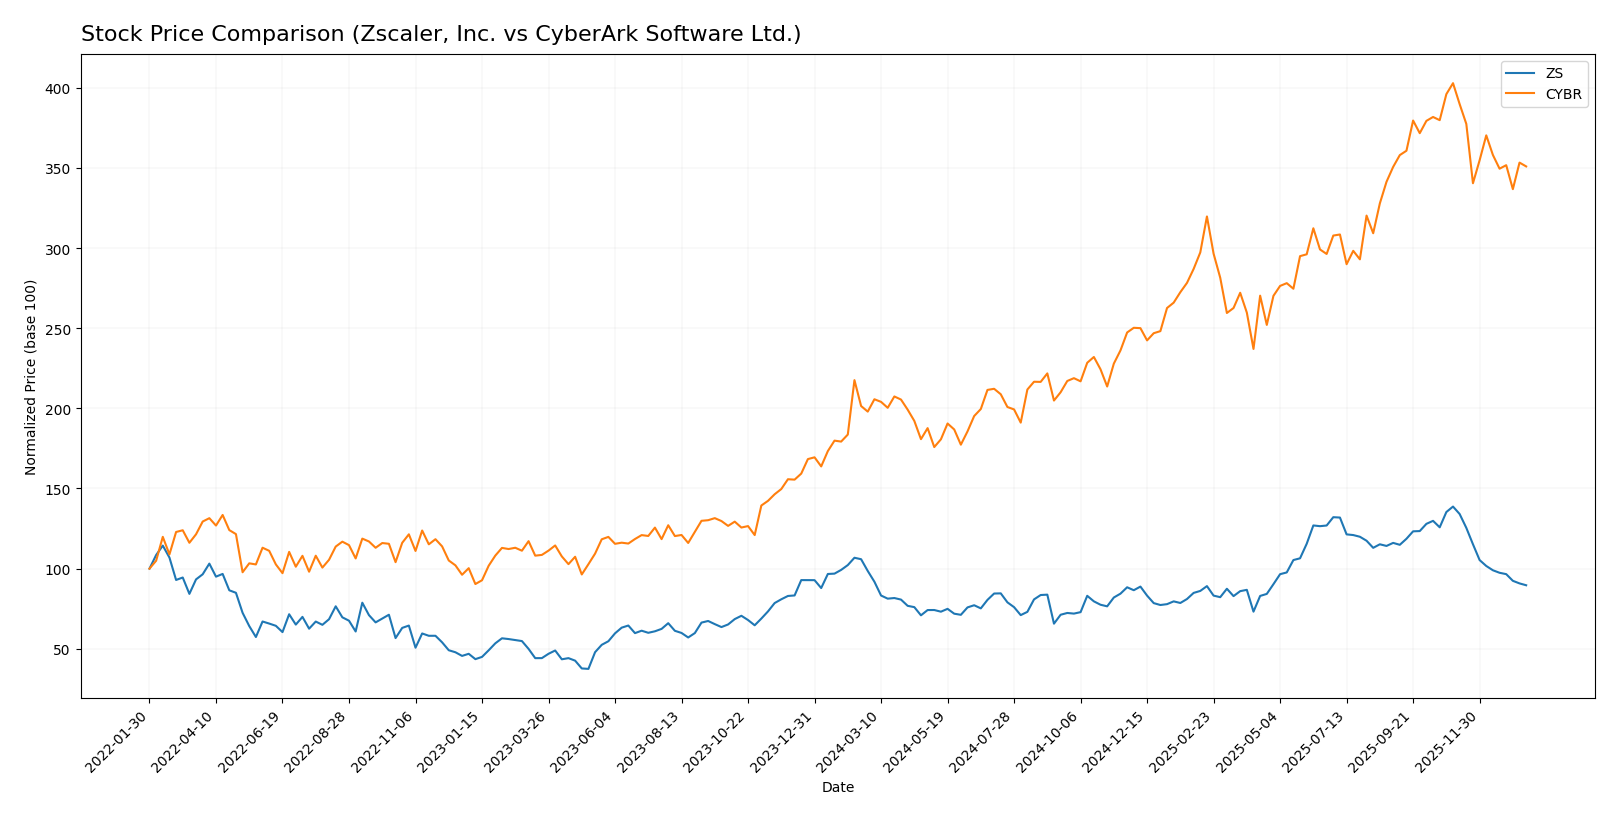
Stock Comparison
The stock price movements of Zscaler, Inc. and CyberArk Software Ltd. over the past year reveal contrasting trends, with Zscaler experiencing a bearish trajectory and CyberArk showing a strong bullish performance, both exhibiting decelerating momentum.
Trend Analysis
Zscaler, Inc. recorded a -9.03% price change over the past 12 months, indicating a bearish trend with decelerating decline. The stock ranged between 156.78 and 331.14, showing high volatility with a 47.11 standard deviation.
CyberArk Software Ltd. posted a 77.27% price increase in the same period, reflecting a bullish trend but with deceleration. Its price fluctuated between 227.32 and 520.78, accompanied by a higher volatility standard deviation of 82.45.
Comparing both, CyberArk significantly outperformed Zscaler in market returns despite recent downward pressures, delivering the highest market performance over the last 12 months.
Target Prices
The current analyst consensus target prices suggest a positive outlook for both Zscaler, Inc. and CyberArk Software Ltd.
| Company | Target High | Target Low | Consensus |
|---|---|---|---|
| Zscaler, Inc. | 360 | 260 | 311.41 |
| CyberArk Software Ltd. | 520 | 440 | 479.22 |
Analysts expect Zscaler shares to rise significantly from the current price of $213.98, with a consensus target around $311. CyberArk also shows strong upside potential from $453.65 to near $479 on average.
Analyst Opinions Comparison
This section compares analysts’ ratings and financial scores for Zscaler, Inc. and CyberArk Software Ltd.:
Rating Comparison
ZS Rating
- Rating: Both companies have a C- rating, considered very favorable by analysts.
- Discounted Cash Flow Score: ZS has a favorable score of 4, indicating relatively strong valuation.
- ROE Score: Both companies have a very unfavorable score of 1, showing low efficiency in equity use.
- ROA Score: Both companies scored very unfavorable at 1, indicating poor asset utilization.
- Debt To Equity Score: ZS scored very unfavorable at 1, indicating higher financial risk.
- Overall Score: Both companies share a very unfavorable overall score of 1, signaling weak fundamentals.
CYBR Rating
- Rating: Both companies have a C- rating, considered very favorable by analysts.
- Discounted Cash Flow Score: CYBR has a moderate score of 3, suggesting a more cautious valuation.
- ROE Score: Both companies have a very unfavorable score of 1, showing low efficiency in equity use.
- ROA Score: Both companies scored very unfavorable at 1, indicating poor asset utilization.
- Debt To Equity Score: CYBR is moderate at 2, reflecting lower financial risk than ZS.
- Overall Score: Both companies share a very unfavorable overall score of 1, signaling weak fundamentals.
Which one is the best rated?
Both ZS and CYBR share the same overall C- rating and very unfavorable overall score. However, ZS has a stronger discounted cash flow score, while CYBR has a better debt-to-equity score, making their ratings mixed without a clear advantage.
Scores Comparison
Here is a comparison of the Altman Z-Score and Piotroski Score for the two companies:
ZS Scores
- Altman Z-Score: 4.89, in the safe zone indicating low bankruptcy risk.
- Piotroski Score: 3, categorized as very weak financial strength.
CYBR Scores
- Altman Z-Score: 6.52, in the safe zone showing very low bankruptcy risk.
- Piotroski Score: 3, also categorized as very weak financial strength.
Which company has the best scores?
Based solely on the provided data, CYBR has a higher Altman Z-Score than ZS, indicating a slightly stronger bankruptcy safety margin. Both companies share an identical, very weak Piotroski Score, reflecting similar financial strength concerns.
Grades Comparison
Here is a comparison of the recent and consensus grades from reputable grading companies for both companies:
Zscaler, Inc. Grades
The following table summarizes recent grades given by major financial institutions for Zscaler, Inc.:
| Grading Company | Action | New Grade | Date |
|---|---|---|---|
| Citigroup | Maintain | Buy | 2026-01-13 |
| Keybanc | Maintain | Overweight | 2026-01-12 |
| Piper Sandler | Maintain | Neutral | 2026-01-05 |
| RBC Capital | Maintain | Outperform | 2026-01-05 |
| Mizuho | Upgrade | Outperform | 2025-12-16 |
| Bernstein | Downgrade | Market Perform | 2025-12-01 |
| Citigroup | Maintain | Buy | 2025-12-01 |
| JP Morgan | Maintain | Overweight | 2025-11-26 |
| Baird | Maintain | Outperform | 2025-11-26 |
| BTIG | Maintain | Buy | 2025-11-26 |
Overall, Zscaler has maintained mostly positive grades ranging from Neutral to Buy and Outperform, with a few recent upgrades and one downgrade.
CyberArk Software Ltd. Grades
The following table presents the recent grades assigned by recognized grading companies for CyberArk Software Ltd.:
| Grading Company | Action | New Grade | Date |
|---|---|---|---|
| Oppenheimer | Maintain | Outperform | 2024-10-22 |
| Keybanc | Maintain | Overweight | 2024-10-18 |
| Mizuho | Maintain | Outperform | 2024-10-17 |
| BTIG | Maintain | Buy | 2024-10-09 |
| Barclays | Maintain | Overweight | 2024-10-07 |
| Wedbush | Maintain | Outperform | 2024-10-01 |
| Jefferies | Maintain | Buy | 2024-09-24 |
| DA Davidson | Maintain | Buy | 2024-08-09 |
| Rosenblatt | Maintain | Buy | 2024-08-09 |
| Susquehanna | Maintain | Positive | 2024-08-09 |
CyberArk’s grades consistently show strong Buy and Outperform ratings, with no downgrades reported in the last year.
Which company has the best grades?
Both Zscaler and CyberArk have received predominantly positive grades from reputable firms, but CyberArk shows a steadier pattern of Outperform and Buy ratings without any recent downgrades. This can influence investor confidence by signaling more consistent analyst support for CyberArk.
Strengths and Weaknesses
Below is a comparative overview of key strengths and weaknesses for Zscaler, Inc. (ZS) and CyberArk Software Ltd. (CYBR) based on their most recent financial and operational data.
| Criterion | Zscaler, Inc. (ZS) | CyberArk Software Ltd. (CYBR) |
|---|---|---|
| Diversification | Primarily cloud security with a strong SaaS focus, revenue of $2.67B in 2025; less diversified | More diversified revenue streams: SaaS, self-hosted subscriptions, maintenance, licenses, and services; total revenue spread across segments in 2024 |
| Profitability | Negative net margin (-1.55%), ROIC -3.18%, shedding value but improving ROIC trend | Negative net margin (-9.34%), ROIC -2.85%, shedding value with declining profitability |
| Innovation | High fixed asset turnover (4.22) indicates efficient asset use; strong growth in ROIC trend | Exceptional fixed asset turnover (51.11), but declining ROIC trend signals challenges in converting innovation to profitability |
| Global presence | Strong global cloud footprint, reflected in growing returns despite losses | Global presence with diverse offerings, but financial performance weak and deteriorating |
| Market Share | Leading cloud security provider with expanding market share in SaaS | Established in privileged access management; market share stable but growth under pressure |
Key takeaways: Both Zscaler and CyberArk are currently unprofitable and shedding value, but Zscaler shows improving profitability trends while CyberArk faces worsening returns. Zscaler’s focus on cloud SaaS drives its growth, whereas CyberArk’s diversified but declining profitability calls for caution.
Risk Analysis
The table below summarizes key risks for Zscaler, Inc. (ZS) and CyberArk Software Ltd. (CYBR) based on the most recent financial and market data available for 2025 and 2024 respectively.
| Metric | Zscaler, Inc. (ZS) | CyberArk Software Ltd. (CYBR) |
|---|---|---|
| Market Risk | Beta 1.02, moderate market volatility exposure | Beta 0.92, slightly lower volatility exposure |
| Debt level | Debt-to-assets 28%, moderate leverage | Debt-to-assets <1%, very low leverage |
| Regulatory Risk | US-based, subject to US tech and data privacy laws | Israel-based, subject to international cybersecurity regulations |
| Operational Risk | Large workforce (7.3K), complexity in cloud security services | Smaller workforce (3.8K), focus on privileged access management |
| Environmental Risk | Limited direct environmental impact, tech sector typical | Similar low environmental footprint, focused on software |
| Geopolitical Risk | US-headquartered, relatively stable geopolitical environment | Israeli company exposed to Middle East geopolitical tensions |
In synthesis, the most impactful risks are operational complexity for Zscaler due to its broad cloud security platform and moderate debt level, while CyberArk faces geopolitical risks linked to its Israeli base despite very low debt and operational scale. Both companies report unfavorable profitability ratios, emphasizing the need for cautious investment and strong risk management.
Which Stock to Choose?
Zscaler, Inc. (ZS) shows strong income growth with a 297% revenue increase over five years and improving profitability metrics, despite negative net margin and returns on equity and invested capital. Its debt level is moderate with favorable liquidity ratios, but financial ratios are slightly unfavorable overall. The company is shedding value as ROIC remains below WACC, though trending positively, and it holds a very favorable rating despite weaknesses in return and valuation metrics.
CyberArk Software Ltd. (CYBR) reports solid recent revenue growth of 33% but faces declining profitability with sustained negative net margin and returns. Its debt is minimal, reflected in favorable debt ratios, and liquidity is adequate. Financial ratios also appear slightly unfavorable, with deteriorating ROIC indicating value destruction. The rating is very favorable, supported by safe-zone Altman Z-score, although profitability and operational efficiency remain concerns.
Investors with a growth-oriented profile might find Zscaler’s improving income statement and growing ROIC trend appealing, while those prioritizing financial stability and lower leverage could consider CyberArk’s safer debt position and strong solvency. Both companies display slight unfavorable financial ratios and negative returns, suggesting cautious interpretation based on risk tolerance and investment strategy.
Disclaimer: Investment carries a risk of loss of initial capital. The past performance is not a reliable indicator of future results. Be sure to understand risks before making an investment decision.
Go Further
I encourage you to read the complete analyses of Zscaler, Inc. and CyberArk Software Ltd. to enhance your investment decisions: