In the dynamic world of technology, CyberArk Software Ltd. and Wix.com Ltd. stand out as influential players in the software infrastructure sector. CyberArk focuses on cybersecurity solutions, while Wix empowers users with cloud-based website development tools. Both companies innovate within overlapping markets, making their comparison insightful for investors seeking growth and resilience. Join me as we explore which of these two compelling firms presents the most appealing investment opportunity in 2026.

Table of contents
Companies Overview
I will begin the comparison between CyberArk and Wix.com by providing an overview of these two companies and their main differences.
CyberArk Overview
CyberArk Software Ltd. focuses on developing and marketing software-based security solutions globally. Its mission centers on protecting privileged access through various products such as Privileged Access Manager and Cloud Entitlements Manager. Serving industries like financial services, healthcare, and government agencies, CyberArk operates through direct sales and partners, maintaining a strong position in security infrastructure since its founding in 1999.
Wix.com Overview
Wix.com Ltd. offers a cloud-based platform that enables users worldwide to create websites and web applications easily. Its product suite includes a drag-and-drop editor, artificial intelligence logo maker, payment processing, and business management tools. Founded in 2006, Wix serves over 222M registered users with 6M premium subscriptions, positioning itself as a leader in website development and online business solutions.
Key similarities and differences
Both companies operate in the software infrastructure sector and are headquartered in Israel, emphasizing cloud-based solutions. CyberArk specializes in cybersecurity, focusing on managing privileged access and identity services, while Wix.com concentrates on web development and business automation platforms. Their business models differ with CyberArk targeting enterprise security clients and Wix catering to a broad base of individual and business users.
Income Statement Comparison
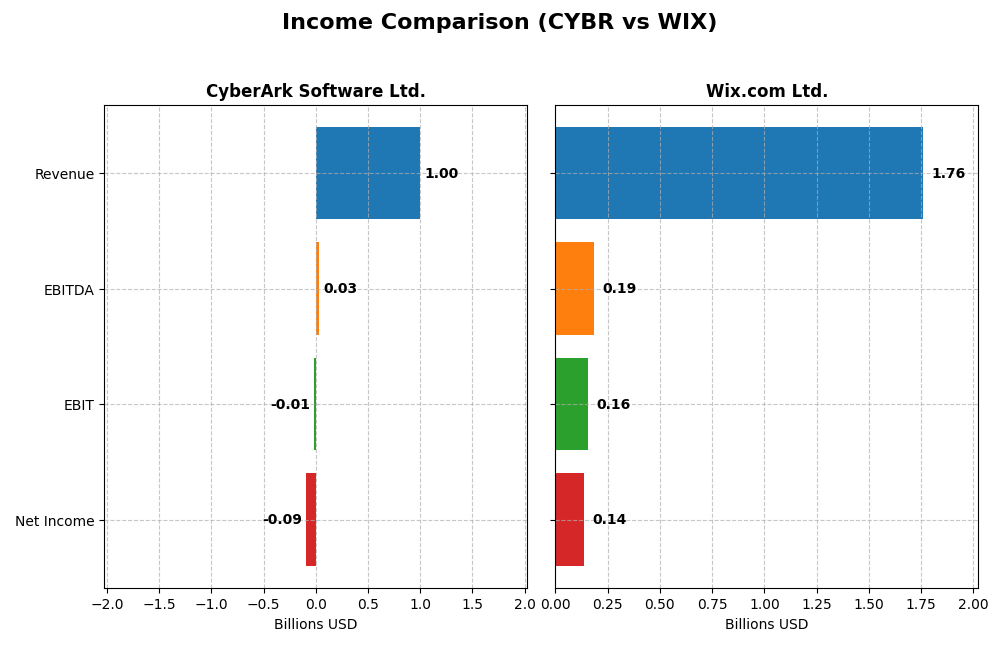
The table below presents a side-by-side comparison of key income statement metrics for CyberArk Software Ltd. and Wix.com Ltd. for the fiscal year 2024.
| Metric | CyberArk Software Ltd. | Wix.com Ltd. |
|---|---|---|
| Market Cap | 22.9B | 4.5B |
| Revenue | 1.00B | 1.76B |
| EBITDA | 29M | 186M |
| EBIT | -13M | 155M |
| Net Income | -93M | 138M |
| EPS | -2.12 | 2.49 |
| Fiscal Year | 2024 | 2024 |
Income Statement Interpretations
CyberArk Software Ltd.
CyberArk’s revenue grew strongly by 115.5% from 2020 to 2024, reaching $1.0B in 2024, with gross margin stable around 79.2%. However, net income remained negative, worsening overall by 1523%, reflecting persistent losses and a negative net margin of -9.34%. In 2024, revenue growth accelerated 33.1%, but net margin and EPS declined further, indicating profitability challenges despite top-line expansion.
Wix.com Ltd.
Wix demonstrated consistent revenue growth of 78.9% over 2020-2024, achieving $1.76B in 2024, alongside a favorable net margin of 7.86%. Gross margin held steady near 67.9%, and operating profit turned positive with an 8.81% EBIT margin in 2024. The latest year showed continued revenue and profit margin improvements, with net income surging 270%, reflecting improving fundamentals and operational leverage.
Which one has the stronger fundamentals?
Wix.com Ltd. exhibits stronger fundamentals due to sustained profitability and positive net margins, with nearly all key income statement metrics rated favorable. In contrast, CyberArk shows robust revenue growth but persistent losses and negative margins, resulting in a neutral overall evaluation. Wix’s improved earnings and margin trends provide a more balanced income statement profile relative to CyberArk.
Financial Ratios Comparison
The following table compares key financial ratios for CyberArk Software Ltd. and Wix.com Ltd. based on their most recent fiscal year data from 2024.
| Ratios | CyberArk Software Ltd. (CYBR) | Wix.com Ltd. (WIX) |
|---|---|---|
| ROE | -3.94% | -175.57% |
| ROIC | -2.85% | 9.13% |
| P/E | -157.5 | 86.2 |
| P/B | 6.21 | -151.35 |
| Current Ratio | 1.48 | 0.84 |
| Quick Ratio | 1.48 | 0.84 |
| D/E (Debt-to-Equity) | 0.01 | -12.31 |
| Debt-to-Assets | 0.88% | 50.7% |
| Interest Coverage | -17.9 | 25.9 |
| Asset Turnover | 0.30 | 0.92 |
| Fixed Asset Turnover | 51.11 | 3.33 |
| Payout ratio | 0% | 0% |
| Dividend yield | 0% | 0% |
Interpretation of the Ratios
CyberArk Software Ltd.
CyberArk shows a mixed ratio profile with 35.7% favorable and 50% unfavorable ratios, indicating a slightly unfavorable overall financial health. Key concerns include negative net margin (-9.34%) and return on equity (-3.94%), alongside poor interest coverage (-3.27). Its leverage ratios are favorable with low debt-to-equity (0.01) and debt-to-assets (0.88%). CyberArk does not pay dividends, likely reflecting its negative profitability and focus on reinvestment or growth.
Wix.com Ltd.
Wix.com presents a slightly unfavorable ratio mix with 28.6% favorable and 35.7% unfavorable, balanced by 35.7% neutral indicators. The net margin is positive at 7.86%, but return on equity is deeply negative (-175.57%), suggesting equity losses or write-downs. The company has high debt-to-assets (50.7%) and weak current ratio (0.84), but strong interest coverage (40.14) indicates manageable debt costs. Wix does not pay dividends, possibly due to reinvestment in growth and operational expansion.
Which one has the best ratios?
Both CyberArk and Wix.com have slightly unfavorable ratio evaluations, though CyberArk shows stronger leverage and liquidity metrics. Wix’s positive net margin contrasts with its severe equity losses, while CyberArk faces profitability challenges but maintains low debt. Neither pays dividends, reflecting reinvestment or growth priorities. Overall, neither company distinctly outperforms in ratio quality.
Strategic Positioning
This section compares the strategic positioning of CyberArk Software Ltd. and Wix.com Ltd. regarding market position, key segments, and exposure to technological disruption:
CyberArk Software Ltd.
- CyberArk holds a larger market cap of $22.9B with moderate beta 0.915, facing competitive pressure in software infrastructure security.
- Focuses on software security solutions including privileged access and identity management targeting multiple industries and government agencies.
- Faces disruption risks mainly from evolving cloud security technologies and SaaS adoption in identity and access management.
Wix.com Ltd.
- Wix has a $4.5B market cap with higher beta 1.418, competing in cloud-based website platform industry with varied user base.
- Concentrates on cloud platform for website creation and business solutions with 222M registered users and multiple subscription offerings.
- Exposure to disruption through rapid innovation in cloud services, AI-driven site creation, and payment platform integrations.
CyberArk vs Wix Positioning
CyberArk’s strategy is more concentrated on cybersecurity software with diversified industry clients and government sectors, while Wix pursues a broader, consumer-focused SaaS platform with strong subscription revenue growth. CyberArk’s exposure centers on security innovations, Wix on cloud and AI advancements.
Which has the best competitive advantage?
Both companies currently shed value as ROIC is below WACC; however, Wix shows a slightly improving profitability trend, while CyberArk’s declining ROIC indicates a weaker competitive moat based on recent efficiency and value creation metrics.
Stock Comparison
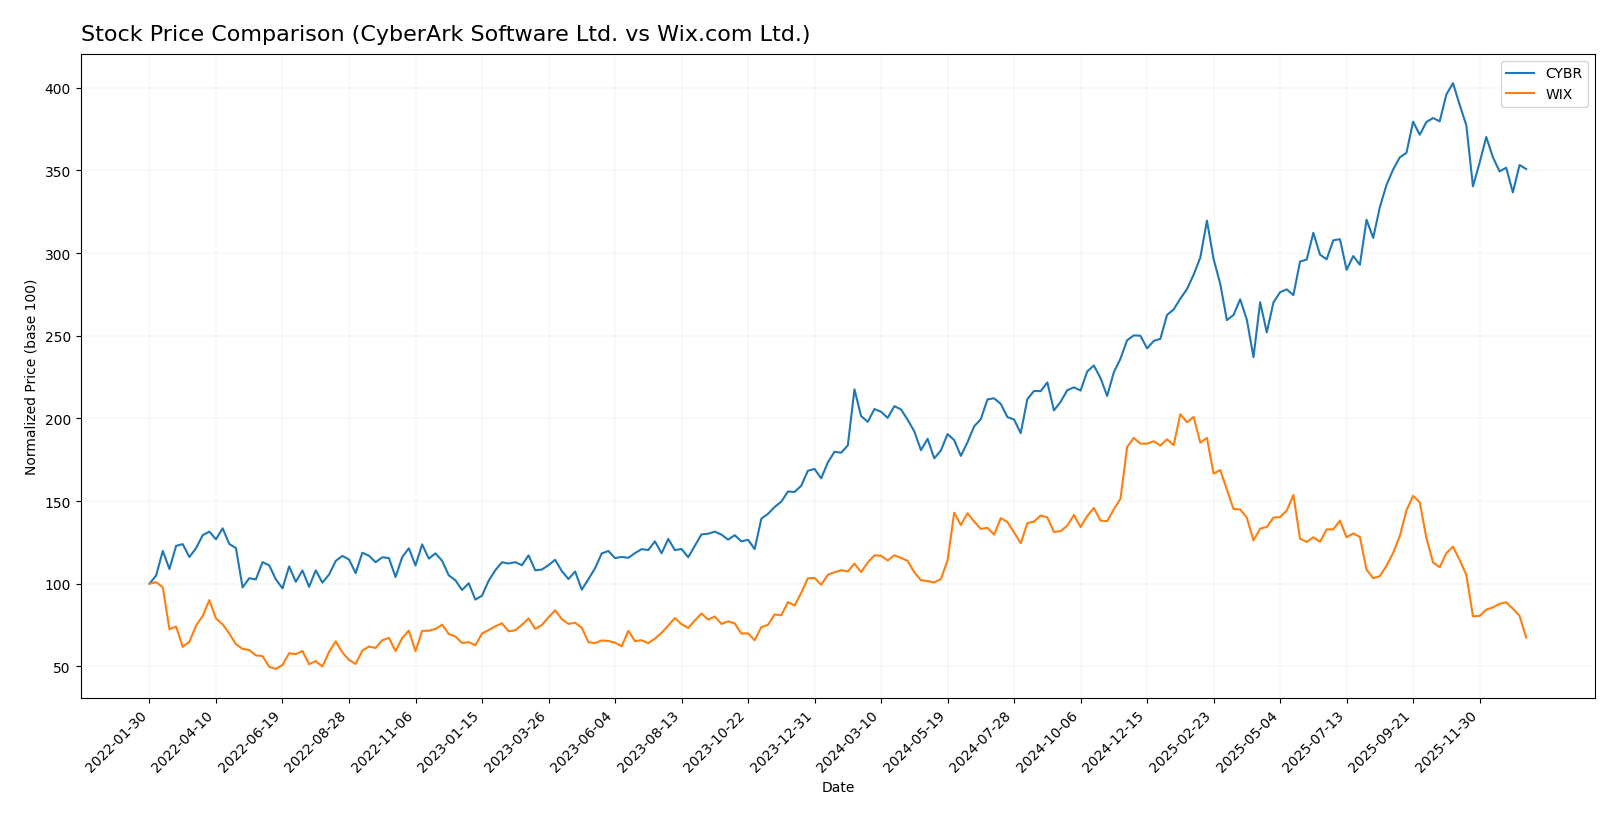
The past year has seen CyberArk Software Ltd. (CYBR) exhibit a strong bullish trend with significant price gains, whereas Wix.com Ltd. (WIX) faced a pronounced bearish trend marked by substantial declines and deceleration in price movement.
Trend Analysis
CyberArk Software Ltd. (CYBR) showed a 77.27% price increase over the past 12 months, reflecting a bullish trend with decelerating momentum, high volatility (std deviation 82.45), and a price range between 227.32 and 520.78.
Wix.com Ltd. (WIX) experienced a 40.28% price decline over the same period, indicating a bearish trend with decelerating price drops, moderate volatility (std deviation 34.39), and prices ranging from 80.16 to 240.89.
Comparing both stocks, CyberArk delivered the highest market performance with strong gains, while Wix showed substantial losses, reflecting divergent investor sentiment and market dynamics.
Target Prices
Analysts present a clear target price consensus for CyberArk Software Ltd. and Wix.com Ltd.
| Company | Target High | Target Low | Consensus |
|---|---|---|---|
| CyberArk Software Ltd. | 520 | 440 | 479.22 |
| Wix.com Ltd. | 210 | 70 | 160.27 |
The target consensus for CyberArk indicates upside potential above its current price of 453.65 USD, suggesting moderate bullish sentiment. Wix’s consensus target is significantly higher than its current price of 80.16 USD, implying expectations of strong recovery or growth.
Analyst Opinions Comparison
This section compares analysts’ ratings and financial scores for CyberArk Software Ltd. and Wix.com Ltd.:
Rating Comparison
CyberArk Software Ltd. Rating
- Rating: C- with a status of Very Favorable
- Discounted Cash Flow Score: 3, indicating Moderate
- ROE Score: 1, classified as Very Unfavorable
- ROA Score: 1, classified as Very Unfavorable
- Debt To Equity Score: 2, indicating Moderate risk
- Overall Score: 1, classified as Very Unfavorable
Wix.com Ltd. Rating
- Rating: C with a status of Very Favorable
- Discounted Cash Flow Score: 3, indicating Moderate
- ROE Score: 1, classified as Very Unfavorable
- ROA Score: 4, classified as Favorable
- Debt To Equity Score: 1, indicating Very Unfavorable
- Overall Score: 2, classified as Moderate
Which one is the best rated?
Based strictly on the provided data, Wix.com Ltd. holds a better overall rating and score than CyberArk Software Ltd., mainly due to its favorable ROA score and a higher overall score. CyberArk scores lower overall despite a similar DCF rating.
Scores Comparison
The scores comparison between CyberArk and Wix highlights their financial health and bankruptcy risk:
CyberArk Scores
- Altman Z-Score of 6.52 indicates a safe zone with low bankruptcy risk.
- Piotroski Score of 3 suggests a very weak financial strength.
Wix Scores
- Altman Z-Score of 1.83 places Wix in the grey zone, indicating moderate risk.
- Piotroski Score of 6 reflects average financial strength.
Which company has the best scores?
CyberArk has a significantly higher Altman Z-Score, indicating stronger bankruptcy safety, while Wix shows better financial strength with a higher Piotroski Score. Each company outperforms the other in one of the two key scores.
Grades Comparison
Here is a detailed comparison of the latest grades assigned to CyberArk Software Ltd. and Wix.com Ltd.:
CyberArk Software Ltd. Grades
The following table shows recent grades from established grading companies for CyberArk Software Ltd.:
| Grading Company | Action | New Grade | Date |
|---|---|---|---|
| Oppenheimer | Maintain | Outperform | 2024-10-22 |
| Keybanc | Maintain | Overweight | 2024-10-18 |
| Mizuho | Maintain | Outperform | 2024-10-17 |
| BTIG | Maintain | Buy | 2024-10-09 |
| Barclays | Maintain | Overweight | 2024-10-07 |
| Wedbush | Maintain | Outperform | 2024-10-01 |
| Jefferies | Maintain | Buy | 2024-09-24 |
| DA Davidson | Maintain | Buy | 2024-08-09 |
| Rosenblatt | Maintain | Buy | 2024-08-09 |
| Susquehanna | Maintain | Positive | 2024-08-09 |
Overall, CyberArk consistently receives positive ratings, predominantly “Buy,” “Outperform,” and “Overweight,” indicating stable confidence from analysts.
Wix.com Ltd. Grades
Below is a summary table of the latest grades from reputable grading companies for Wix.com Ltd.:
| Grading Company | Action | New Grade | Date |
|---|---|---|---|
| Morgan Stanley | Maintain | Overweight | 2026-01-15 |
| Wells Fargo | Maintain | Overweight | 2025-12-19 |
| Cantor Fitzgerald | Maintain | Overweight | 2025-12-11 |
| Wells Fargo | Maintain | Overweight | 2025-11-20 |
| Barclays | Maintain | Overweight | 2025-11-20 |
| Citizens | Maintain | Market Outperform | 2025-11-20 |
| Citigroup | Maintain | Buy | 2025-11-20 |
| Scotiabank | Maintain | Sector Outperform | 2025-11-20 |
| Needham | Maintain | Buy | 2025-11-20 |
| Evercore ISI Group | Maintain | Outperform | 2025-11-20 |
Wix.com has a consistent pattern of “Overweight,” “Buy,” and several “Outperform” ratings, reflecting solid analyst support.
Which company has the best grades?
Both CyberArk and Wix.com share a consensus rating of “Buy” from multiple analysts. CyberArk’s grades lean slightly more towards “Outperform” and “Buy” designations, while Wix.com shows a blend of “Overweight” and “Outperform” ratings. For investors, this suggests both stocks are viewed favorably, but CyberArk’s ratings imply a marginally stronger outlook.
Strengths and Weaknesses
Below is a comparison of key strengths and weaknesses for CyberArk Software Ltd. (CYBR) and Wix.com Ltd. (WIX) based on the most recent financial and operational data.
| Criterion | CyberArk Software Ltd. (CYBR) | Wix.com Ltd. (WIX) |
|---|---|---|
| Diversification | Moderate; revenue spread across SaaS (468M), Self Hosted Subscription (265M), and Maintenance (197M) | Good; two main segments: Creative Subscription (1.26B) and Business Solutions (496M) |
| Profitability | Unfavorable; negative net margin (-9.34%), negative ROIC (-2.85%), declining profitability trend | Slightly better; positive net margin (7.86%), positive ROIC (9.13%) with growing trend |
| Innovation | Moderate; strong SaaS growth but declining overall ROIC indicates challenges | Moderate; steady growth in subscriptions but mixed profitability indicators |
| Global presence | Strong in cybersecurity niche, typical SaaS global reach | Strong global platform with widespread user base for website solutions |
| Market Share | Niche leader in privileged access management but ROIC below WACC indicates value destruction | Leading DIY website builder with growing market share but profitability concerns remain |
Key takeaways: CyberArk shows strong SaaS revenue growth but is currently value-destructive with declining profitability. Wix demonstrates improving profitability and revenue growth, though some financial ratios signal caution. Both companies have distinct market niches but require careful risk assessment before investing.
Risk Analysis
Below is a comparative table highlighting the key risks for CyberArk Software Ltd. (CYBR) and Wix.com Ltd. (WIX) based on the most recent 2024 data:
| Metric | CyberArk Software Ltd. (CYBR) | Wix.com Ltd. (WIX) |
|---|---|---|
| Market Risk | Moderate (Beta 0.915) | Higher (Beta 1.418) |
| Debt level | Very low (Debt/Equity 0.01) | Elevated (Debt/Equity -12.31 but 50.7% debt to assets) |
| Regulatory Risk | Moderate | Moderate |
| Operational Risk | Medium (Negative net margin, ROE) | Medium (Mixed margins, negative ROE) |
| Environmental Risk | Low | Low |
| Geopolitical Risk | Moderate (Israel-based, global market exposure) | Moderate (Israel-based, global market exposure) |
CyberArk presents a lower debt risk and moderate market volatility, but its profitability and return metrics are unfavorable, indicating operational challenges. Wix faces higher market risk and significant leverage concerns, with liquidity below optimal levels, increasing its financial risk exposure. Both companies operate in a moderately regulated, geopolitically sensitive environment, requiring cautious monitoring.
Which Stock to Choose?
CyberArk Software Ltd. (CYBR) shows a favorable revenue growth of 33.1% in 2024 with a gross margin at 79.18%, though profitability remains weak with a net margin of -9.34%. Its financial ratios are slightly unfavorable overall, but it maintains low debt and a strong liquidity position. The company is rated very favorable (C-) despite value destruction evidenced by declining ROIC versus WACC.
Wix.com Ltd. (WIX) posts steady income growth with a 12.74% revenue increase and a positive net margin of 7.86% in 2024. Its financial ratios are mixed with some unfavorable leverage metrics but favorable interest coverage and asset turnover. The rating is also very favorable (C) with a slightly unfavorable moat as ROIC is growing but still below WACC.
For investors focused on growth, CYBR’s robust revenue expansion and liquidity might appear attractive despite profitability challenges and value loss. Conversely, those prioritizing income stability and improving profitability trends may find WIX more aligned with their profile given its positive margin and growing ROIC. Each stock’s outlook could be interpreted differently depending on risk tolerance and investment strategy.
Disclaimer: Investment carries a risk of loss of initial capital. The past performance is not a reliable indicator of future results. Be sure to understand risks before making an investment decision.
Go Further
I encourage you to read the complete analyses of CyberArk Software Ltd. and Wix.com Ltd. to enhance your investment decisions: