In today’s fast-evolving technology landscape, CyberArk Software Ltd. and Veritone, Inc. stand out as innovators in software infrastructure. CyberArk focuses on cybersecurity with privileged access management, while Veritone leads in artificial intelligence solutions through its aiWARE platform. Both companies address critical enterprise needs with cutting-edge technologies. This article will help you identify which company offers the most compelling investment opportunity in 2026.
Table of contents
Companies Overview
I will begin the comparison between CyberArk and Veritone by providing an overview of these two companies and their main differences.
CyberArk Overview
CyberArk Software Ltd. develops and markets software-based security solutions focused on privileged access management, identity, and access management services. Headquartered in Petah Tikva, Israel, it serves industries such as financial services, healthcare, and government agencies globally. Founded in 1999, CyberArk holds a strong position in software infrastructure security with a market cap of approximately 22.9B USD.
Veritone Overview
Veritone, Inc. provides artificial intelligence computing solutions via its aiWARE platform, specializing in machine learning and cognitive processes to analyze structured and unstructured data. Based in Denver, Colorado, Veritone serves media, government, and energy sectors. Founded in 2014, it operates as a smaller player in software infrastructure with a market cap near 225M USD and a focus on AI-powered data insights.
Key similarities and differences
Both CyberArk and Veritone operate in the technology sector within software infrastructure but differ significantly in scale and specialization. CyberArk concentrates on cybersecurity and privileged access management, targeting a broad range of industries worldwide. Veritone focuses on AI-driven data analytics for niche verticals such as media and government, with a notably smaller market capitalization and workforce. Their business models reflect these distinct technological emphases and market approaches.
Income Statement Comparison
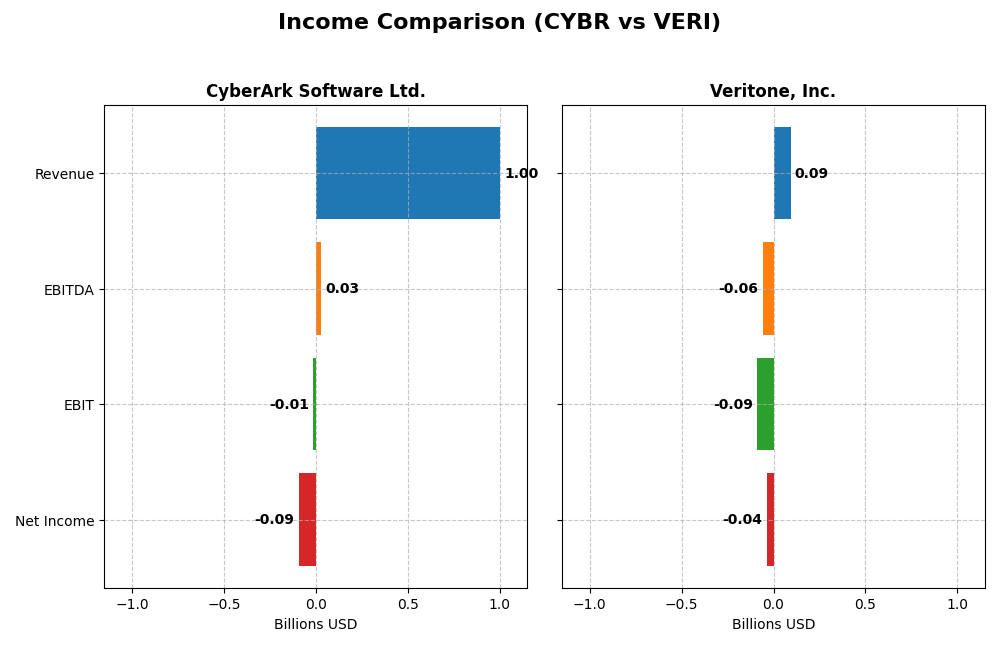
Below is a side-by-side comparison of the key income statement metrics for CyberArk Software Ltd. and Veritone, Inc. for the fiscal year 2024.
| Metric | CyberArk Software Ltd. | Veritone, Inc. |
|---|---|---|
| Market Cap | 22.9B | 225M |
| Revenue | 1.00B | 93M |
| EBITDA | 29M | -59M |
| EBIT | -13M | -88M |
| Net Income | -93M | -37M |
| EPS | -2.12 | -0.98 |
| Fiscal Year | 2024 | 2024 |
Income Statement Interpretations
CyberArk Software Ltd.
CyberArk’s revenue exhibited strong growth, rising 115% from 2020 to 2024, reaching $1.0B in 2024, with gross margin stable at a favorable 79.18%. However, net income declined significantly, showing a negative $93M in 2024 and a deteriorating net margin of -9.34%. Despite a 33% revenue increase in 2024, earnings per share fell by 32.5%, reflecting profitability challenges.
Veritone, Inc.
Veritone’s revenue increased by 60.5% over the five-year period, peaking at $92.6M in 2024 but fell 7.4% year-over-year. Gross margin remained favorable at 70.58%, though EBIT margin was deeply negative at -95.13%. Net income improved overall, showing a 22% growth over the period and a net margin of -40.36% in 2024, supported by a positive net margin growth of 31.17% in the last year.
Which one has the stronger fundamentals?
CyberArk demonstrates robust revenue growth and strong gross margins but struggles with sustained profitability and negative net income trends. Veritone shows slower revenue growth and a more volatile margin profile, yet its net income and EPS trends have improved favorably over time. Overall, Veritone’s income statement evaluation leans more favorable, while CyberArk’s remains neutral due to mixed profitability and margin metrics.
Financial Ratios Comparison
The table below presents a side-by-side comparison of key financial ratios for CyberArk Software Ltd. (CYBR) and Veritone, Inc. (VERI) based on their most recent fiscal year data (2024).
| Ratios | CyberArk Software Ltd. (CYBR) | Veritone, Inc. (VERI) |
|---|---|---|
| ROE | -3.94% | -277.91% |
| ROIC | -2.85% | -58.27% |
| P/E | -157.5 | -3.34 |
| P/B | 6.21 | 9.27 |
| Current Ratio | 1.48 | 0.97 |
| Quick Ratio | 1.48 | 0.97 |
| D/E (Debt-to-Equity) | 0.012 | 8.91 |
| Debt-to-Assets | 0.009 | 0.61 |
| Interest Coverage | -17.90 | -7.31 |
| Asset Turnover | 0.30 | 0.47 |
| Fixed Asset Turnover | 51.11 | 8.51 |
| Payout ratio | 0 | 0 |
| Dividend yield | 0 | 0 |
Interpretation of the Ratios
CyberArk Software Ltd.
CyberArk shows a mixed financial profile with significant unfavorable ratios including negative net margin (-9.34%) and return on equity (-3.94%), indicating profitability challenges. However, it maintains a low debt level (debt-to-assets 0.88%) and strong liquidity (quick ratio 1.48). The company does not pay dividends, likely reflecting its reinvestment strategy and focus on growth in software security solutions.
Veritone, Inc.
Veritone’s ratios are mostly unfavorable, with a deeply negative net margin (-40.36%) and return on equity (-277.91%), highlighting severe profitability issues. It has a high debt burden (debt-to-assets 60.54%) and weak liquidity (current ratio 0.97). Veritone also does not pay dividends, consistent with its high-growth phase and prioritization of AI platform development and acquisitions.
Which one has the best ratios?
CyberArk presents a relatively stronger financial position with a lower debt load, better liquidity, and a less negative profitability profile compared to Veritone. Veritone’s ratios reflect more severe financial distress and higher leverage. Overall, CyberArk’s ratios are slightly unfavorable, whereas Veritone’s are very unfavorable, indicating CyberArk’s ratios are comparatively better.
Strategic Positioning
This section compares CyberArk and Veritone’s strategic positioning including market position, key segments, and exposure to disruption:
CyberArk Software Ltd.
- Leading in software infrastructure security with global reach, facing moderate competitive pressure.
- Revenue driven by SaaS, self-hosted subscriptions, maintenance, and professional services for diverse industries.
- Addresses disruption via cloud entitlement management and adaptive identity services in cybersecurity.
Veritone, Inc.
- Small-cap AI computing company focused on niche markets with high beta, exposed to volatile competition.
- Revenue mainly from AI platform services, advertising, managed services, and software products in select verticals.
- Focuses on AI-driven data insights and machine learning for media, government, and legal sectors.
CyberArk Software Ltd. vs Veritone, Inc. Positioning
CyberArk shows a diversified approach with multiple revenue streams across industries, enhancing resilience. Veritone concentrates on AI and media-related services, which could limit market breadth but allows specialization. Each strategy carries distinct operational risks and growth opportunities.
Which has the best competitive advantage?
Both companies exhibit very unfavorable MOAT ratings due to declining ROIC below WACC, indicating value destruction and decreasing profitability, thus neither currently demonstrates a strong competitive advantage.
Stock Comparison
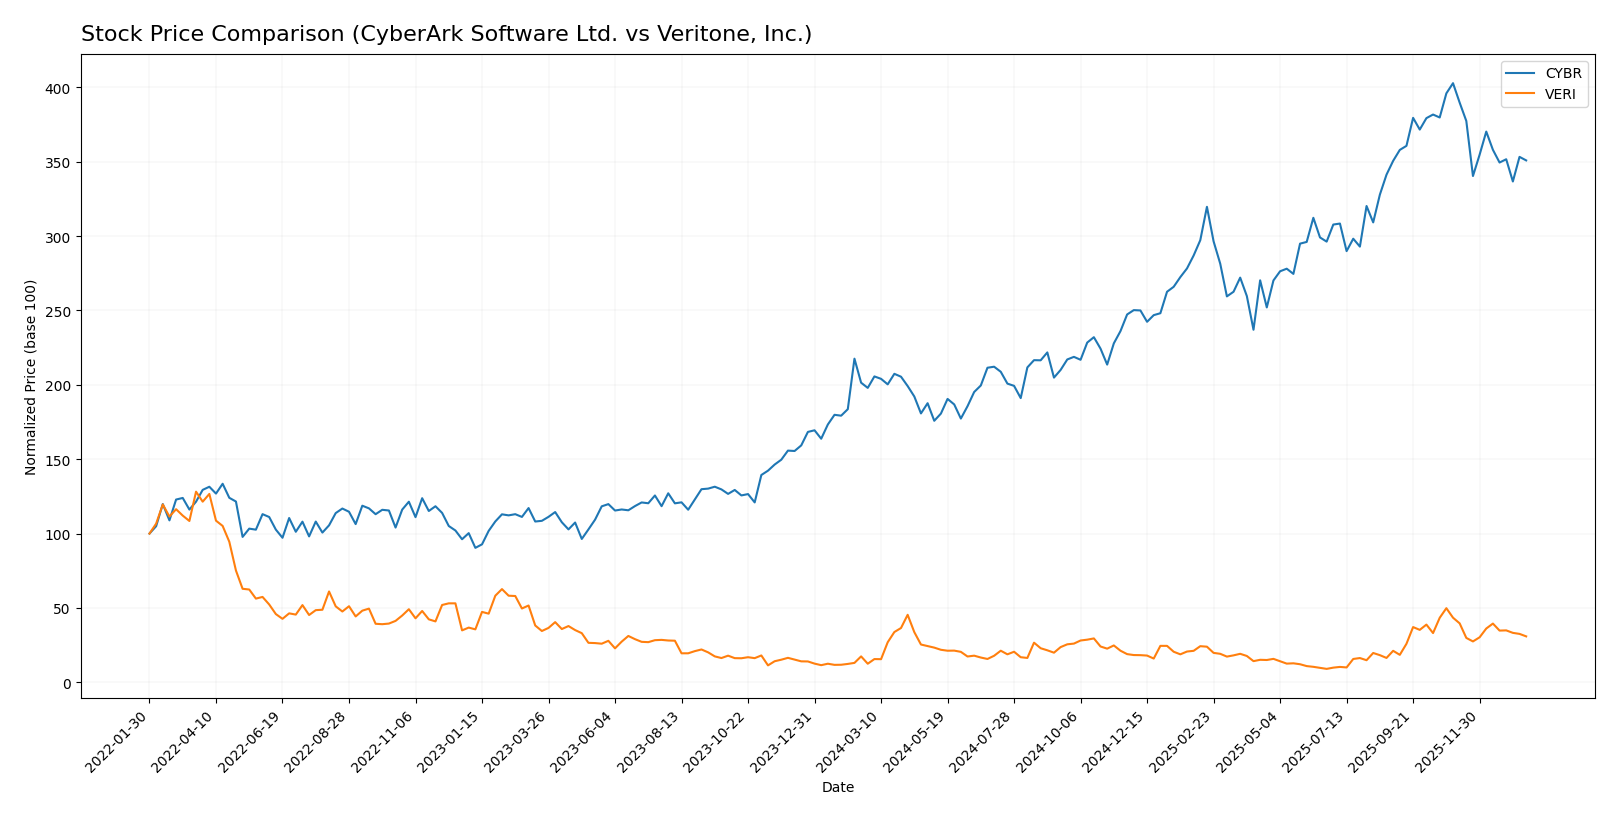
The past year has shown significant price gains for CyberArk Software Ltd. and Veritone, Inc., with both experiencing strong bullish trends despite a recent short-term decline in trading momentum.
Trend Analysis
CyberArk Software Ltd. (CYBR) posted a bullish overall trend with a 77.27% price increase over the past 12 months, marked by a deceleration in growth and a high volatility of 82.45. The recent trend reversed, showing a 12.89% decline from November 2025 to January 2026.
Veritone, Inc. (VERI) exhibited a more pronounced bullish trend, gaining 147.22% over the same 12-month period but with low volatility at 1.26. Its recent trend also turned negative, dropping 28.91% in the last quarter of the analyzed timeframe.
Comparing the two, Veritone outperformed CyberArk in total price appreciation over the past year despite both showing deceleration and recent declines, indicating stronger market performance for VERI overall.
Target Prices
The current analyst consensus presents a positive outlook with defined target price ranges for these technology infrastructure companies.
| Company | Target High | Target Low | Consensus |
|---|---|---|---|
| CyberArk Software Ltd. | 520 | 440 | 479.22 |
| Veritone, Inc. | 10 | 9 | 9.5 |
Analysts expect CyberArk’s stock to appreciate modestly from its current price of 453.65 USD, while Veritone’s consensus target price is more than double its current 4.45 USD share price, indicating higher growth expectations.
Analyst Opinions Comparison
This section compares analysts’ ratings and grades for CyberArk Software Ltd. and Veritone, Inc.:
Rating Comparison
CyberArk Rating
- Rating: C- with a very favorable status
- Discounted Cash Flow Score: 3, moderate rating
- ROE Score: 1, very unfavorable
- ROA Score: 1, very unfavorable
- Debt To Equity Score: 2, moderate rating
- Overall Score: 1, very unfavorable
Veritone Rating
- Rating: C with a very favorable status
- Discounted Cash Flow Score: 5, very favorable rating
- ROE Score: 1, very unfavorable
- ROA Score: 1, very unfavorable
- Debt To Equity Score: 1, very unfavorable
- Overall Score: 2, moderate rating
Which one is the best rated?
Veritone holds a higher overall score and a stronger discounted cash flow rating compared to CyberArk. However, both have equally low ROE and ROA scores, indicating similar challenges in profitability metrics.
Scores Comparison
The scores comparison between CyberArk Software Ltd. and Veritone, Inc. is as follows:
CyberArk Scores
- Altman Z-Score of 6.52 places CyberArk in the safe zone, indicating low bankruptcy risk.
- Piotroski Score of 3 indicates very weak financial strength for CyberArk.
Veritone Scores
- Altman Z-Score of -0.07 places Veritone in the distress zone, indicating high bankruptcy risk.
- Piotroski Score of 3 also indicates very weak financial strength for Veritone.
Which company has the best scores?
CyberArk shows a significantly stronger Altman Z-Score, indicating better financial stability. Both companies share the same very weak Piotroski Score, reflecting similar financial strength concerns.
Grades Comparison
Here is a detailed comparison of the recent grades and ratings assigned to CyberArk Software Ltd. and Veritone, Inc.:
CyberArk Software Ltd. Grades
The following table summarizes recent grades from recognized grading companies for CyberArk Software Ltd.:
| Grading Company | Action | New Grade | Date |
|---|---|---|---|
| Oppenheimer | Maintain | Outperform | 2024-10-22 |
| Keybanc | Maintain | Overweight | 2024-10-18 |
| Mizuho | Maintain | Outperform | 2024-10-17 |
| BTIG | Maintain | Buy | 2024-10-09 |
| Barclays | Maintain | Overweight | 2024-10-07 |
| Wedbush | Maintain | Outperform | 2024-10-01 |
| Jefferies | Maintain | Buy | 2024-09-24 |
| DA Davidson | Maintain | Buy | 2024-08-09 |
| Rosenblatt | Maintain | Buy | 2024-08-09 |
| Susquehanna | Maintain | Positive | 2024-08-09 |
Overall, CyberArk Software Ltd. consistently receives positive grades, predominantly “Buy,” “Outperform,” and “Overweight,” indicating strong analyst confidence.
Veritone, Inc. Grades
The following table summarizes recent grades from recognized grading companies for Veritone, Inc.:
| Grading Company | Action | New Grade | Date |
|---|---|---|---|
| D. Boral Capital | Maintain | Buy | 2025-12-09 |
| D. Boral Capital | Maintain | Buy | 2025-12-04 |
| Needham | Maintain | Buy | 2025-12-02 |
| D. Boral Capital | Maintain | Buy | 2025-12-02 |
| D. Boral Capital | Maintain | Buy | 2025-11-07 |
| D. Boral Capital | Maintain | Buy | 2025-10-28 |
| HC Wainwright & Co. | Maintain | Buy | 2025-10-20 |
| D. Boral Capital | Maintain | Buy | 2025-10-15 |
| D. Boral Capital | Maintain | Buy | 2025-09-24 |
| D. Boral Capital | Maintain | Buy | 2025-09-09 |
Veritone, Inc. shows uniform “Buy” ratings from its grading companies, reflecting consistent positive sentiment.
Which company has the best grades?
Both CyberArk Software Ltd. and Veritone, Inc. hold a consensus “Buy” rating, but CyberArk’s grades include a broader variety of positive assessments such as “Outperform” and “Overweight.” This suggests a slightly stronger analyst endorsement for CyberArk, which may influence investor confidence and portfolio weighting decisions.
Strengths and Weaknesses
Here is a comparative overview of key strengths and weaknesses for CyberArk Software Ltd. (CYBR) and Veritone, Inc. (VERI) based on the most recent financial and operational data.
| Criterion | CyberArk Software Ltd. (CYBR) | Veritone, Inc. (VERI) |
|---|---|---|
| Diversification | Strong SaaS and subscription-based revenue streams, including Maintenance & Support and Professional Services | Revenue mainly from Advertising and AI-powered software products, less diversified |
| Profitability | Negative net margin (-9.34%), ROIC -2.85%; slightly unfavorable overall financial ratios | Significantly negative net margin (-40.36%), ROIC -58.27%; very unfavorable financial ratios |
| Innovation | High fixed asset turnover (51.11) suggests efficient use of assets in innovation | Moderate fixed asset turnover (8.51), but struggles with profitability and debt management |
| Global presence | Solid global footprint with increasing SaaS revenues ($469M in 2024) | More niche AI and advertising focus, smaller scale with $61M in software products in 2024 |
| Market Share | Established leader in privileged access management with growing subscription revenues | Smaller market share in AI solutions and managed services, facing competitive pressure |
Key takeaways: CyberArk shows strength in diversified SaaS offerings and asset efficiency but faces profitability challenges. Veritone suffers from heavy losses and financial weakness, with limited diversification and scale, suggesting higher investment risk. Caution is advised given both have declining economic moats and unfavorable profitability trends.
Risk Analysis
Below is a table summarizing key risks for CyberArk Software Ltd. (CYBR) and Veritone, Inc. (VERI) based on the most recent 2024 data.
| Metric | CyberArk Software Ltd. (CYBR) | Veritone, Inc. (VERI) |
|---|---|---|
| Market Risk | Moderate (Beta 0.915) | High (Beta 2.052) |
| Debt level | Very low (Debt-to-Equity 0.01) | Very high (Debt-to-Equity 8.91) |
| Regulatory Risk | Moderate (Global operations, cybersecurity regulations) | Moderate (US/UK AI regulations evolving) |
| Operational Risk | Moderate (Reliance on security software innovation) | High (AI tech development and client retention challenges) |
| Environmental Risk | Low (Software sector, minimal direct impact) | Low (Software sector, minimal direct impact) |
| Geopolitical Risk | Moderate (Israeli base with international clients) | Low (US-based) |
CyberArk’s main risks are moderate market volatility and operational challenges in maintaining innovation leadership, though its very low debt and strong Altman Z-score suggest financial stability. Veritone faces high financial risk due to heavy debt and a distress-level Altman Z-score, combined with elevated market risk and operational uncertainties in the AI space. Investors should weigh Veritone’s growth potential against its financial vulnerability.
Which Stock to Choose?
CyberArk Software Ltd. (CYBR) shows a positive income evolution with 33.1% revenue growth in 2024 and a 115.48% increase over five years, but profitability remains negative with a -9.34% net margin. Financial ratios are slightly unfavorable overall, though debt levels are low and liquidity ratios are neutral to favorable. The company’s rating is very favorable despite weak profitability, and it maintains a safe Altman Z-Score but a very weak Piotroski score. Its economic moat is very unfavorable due to declining ROIC and value destruction.
Veritone, Inc. (VERI) has a mixed income evolution, with a 7.35% revenue decline in 2024 but positive long-term growth of 60.53%. Profitability is deeply negative with a -40.36% net margin. Financial ratios are mostly very unfavorable, reflecting high leverage and weak liquidity. Ratings indicate a very favorable outlook overall, though the Altman Z-Score is in the distress zone and Piotroski score is very weak. The company’s economic moat is also very unfavorable, showing value destruction and declining ROIC.
For investors prioritizing growth potential and a stronger balance sheet, CyberArk’s favorable rating and income growth might appear more attractive, despite modest profitability and value erosion. Conversely, more risk-tolerant investors focusing on turnaround opportunities or speculative growth could interpret Veritone’s mixed income trends and weaker financials as a potential for recovery, albeit with higher financial risk. The choice may depend on whether stability and moderate growth or higher risk and potential volatility align better with the investor’s profile.
Disclaimer: Investment carries a risk of loss of initial capital. The past performance is not a reliable indicator of future results. Be sure to understand risks before making an investment decision.
Go Further
I encourage you to read the complete analyses of CyberArk Software Ltd. and Veritone, Inc. to enhance your investment decisions: