Home > Comparison > Technology > CYBR vs VRSN
The strategic rivalry between CyberArk Software Ltd. and VeriSign, Inc. shapes the infrastructure software landscape. CyberArk excels as a security-focused software innovator, emphasizing privileged access management. VeriSign operates as a critical internet infrastructure provider, securing domain name registry services globally. This analysis pits CyberArk’s growth-driven security platform against VeriSign’s stable, defensive moat. I aim to identify which company delivers superior risk-adjusted returns for a diversified portfolio in today’s evolving technology sector.
Table of contents
Companies Overview
CyberArk Software Ltd. and VeriSign, Inc. stand as pillars in the software infrastructure market, shaping digital security and internet reliability.
CyberArk Software Ltd.: Guardian of Privileged Access
CyberArk dominates the privileged access security niche by developing software that controls and protects credentials across cloud and on-premises environments. Its revenue stems from advanced security solutions like Privileged Access Manager and Cloud Entitlements Manager. In 2026, CyberArk sharpens its focus on SaaS innovations to mitigate risks linked to excessive privileges in hybrid cloud settings.
VeriSign, Inc.: Backbone of Internet Infrastructure
VeriSign anchors the domain name registry market by managing critical internet infrastructure, including .com and .net domains. It generates revenue through registry services and root zone maintenance critical for global internet navigation and security. In 2026, VeriSign prioritizes enhancing the stability and resiliency of internet services amidst growing cyber threats and digital commerce demands.
Strategic Collision: Similarities & Divergences
Both firms invest heavily in software infrastructure security, yet CyberArk adopts a proactive identity and access management stance, while VeriSign secures the foundational internet architecture. Their competition unfolds at the intersection of cybersecurity and digital trust, targeting enterprise and internet ecosystem reliability. Investors face contrasting profiles: CyberArk pushes aggressive SaaS expansion, while VeriSign offers steady, essential infrastructure stewardship.
Income Statement Comparison
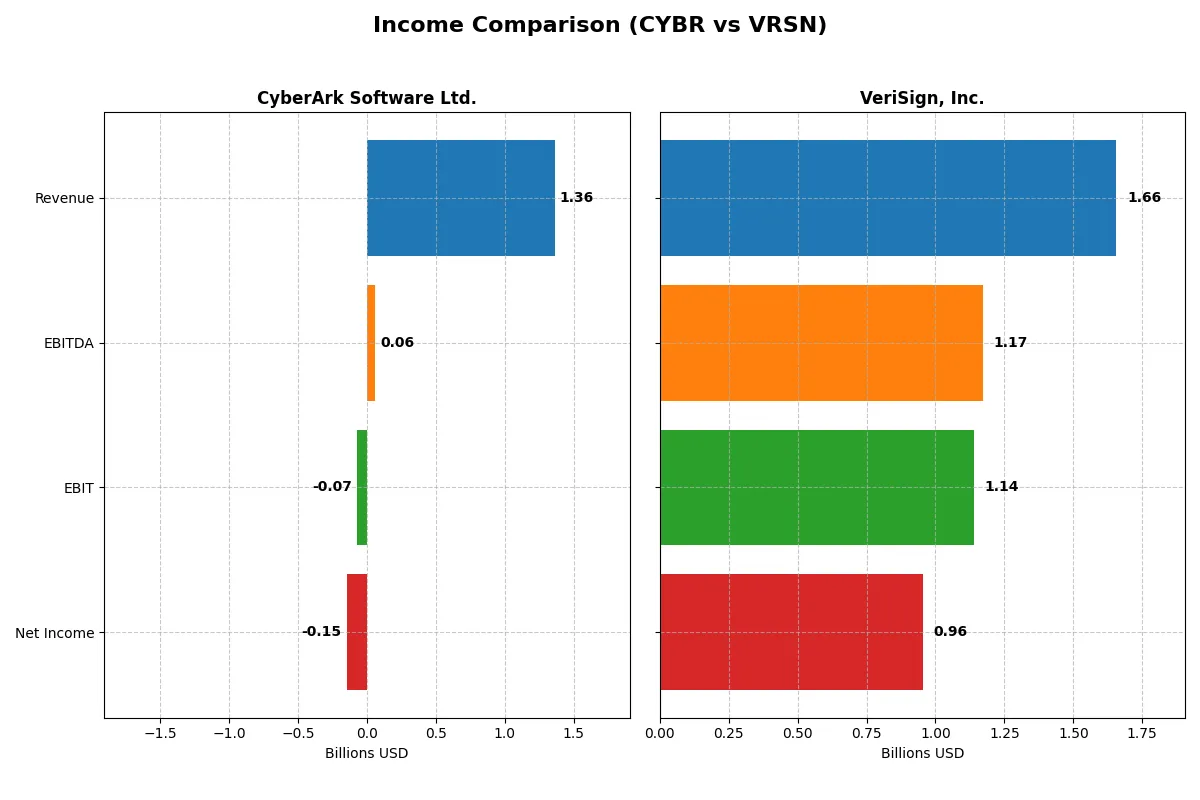
The following data dissects the core profitability and scalability of both corporate engines to reveal who dominates the bottom line:
| Metric | CyberArk Software Ltd. (CYBR) | VeriSign, Inc. (VRSN) |
|---|---|---|
| Revenue | 1.36B | 1.66B |
| Cost of Revenue | 350M | 196M |
| Operating Expenses | 1.12B | 339M |
| Gross Profit | 1.01B | 1.46B |
| EBITDA | 59M | 1.17B |
| EBIT | -69M | 1.14B |
| Interest Expense | 0 | 77M |
| Net Income | -147M | 956M |
| EPS | -2.93 | 8.83 |
| Fiscal Year | 2025 | 2025 |
Income Statement Analysis: The Bottom-Line Duel
The following income statement comparison reveals the true efficiency and profitability trajectory of two distinct corporate engines in the tech sector.
CyberArk Software Ltd. Analysis
CyberArk’s revenue surged 36% in 2025 to $1.36B, reflecting strong top-line growth from $502M in 2021. Despite a robust gross margin of 74%, the company struggles with negative net income and a -10.8% net margin, indicating persistent profitability challenges. Operating losses deepened in 2025, signaling efficiency headwinds despite revenue momentum.
VeriSign, Inc. Analysis
VeriSign delivers steady revenue growth, reaching $1.66B in 2025, up 6.4% year-over-year. It dominates margin metrics with an 88% gross margin and a stellar 57.7% net margin, driving $956M net income. VeriSign’s operating efficiency and consistent profit growth highlight disciplined capital allocation and sustainable competitive advantage.
Margin Dominance vs. Growth Struggles
VeriSign clearly outperforms CyberArk with superior margin control and positive net income, proving more fundamentally sound. CyberArk’s strong revenue growth is undermined by persistent net losses and unfavorable operating margins. For investors, VeriSign’s high-margin, profitable profile offers a more attractive risk-return balance.
Financial Ratios Comparison
These vital ratios act as a diagnostic tool to expose the underlying fiscal health, valuation premiums, and capital efficiency of each company:
| Ratios | CyberArk Software Ltd. (CYBR) | VeriSign, Inc. (VRSN) |
|---|---|---|
| ROE | -6.11% | -64.84% |
| ROIC | -2.74% | -151.96% |
| P/E | -152.2 | 23.49 |
| P/B | 9.31 | -15.23 |
| Current Ratio | 2.00 | 0.49 |
| Quick Ratio | 2.00 | 0.49 |
| D/E | 0.51 | -1.21 |
| Debt-to-Assets | 25.38% | 265.55% |
| Interest Coverage | 0 | 14.56 |
| Asset Turnover | 0.28 | 2.46 |
| Fixed Asset Turnover | 32.73 | 7.75 |
| Payout ratio | 0 | 22.52% |
| Dividend yield | 0 | 0.96% |
| Fiscal Year | 2025 | 2025 |
Efficiency & Valuation Duel: The Vital Signs
Financial ratios serve as the company’s DNA, uncovering hidden risks and operational strengths that raw numbers alone cannot reveal.
CyberArk Software Ltd.
CyberArk’s profitability metrics disappoint with a negative ROE of -6.11% and a net margin of -10.79%, signaling operational challenges. The stock appears stretched with a high P/B of 9.31 despite a favorable P/E due to losses. It reinvests heavily in R&D (25%) but offers no dividends, reflecting a growth-focused capital allocation.
VeriSign, Inc.
VeriSign posts a robust net margin of 57.68%, though its ROE is deeply negative at -64.84%, indicating uneven profitability distribution. Valuation remains neutral with a P/E near 23.5 and a favorable negative P/B. It maintains a low current ratio (0.49), implying liquidity risk, but generates steady cash flow, supporting modest dividends and operational efficiency.
Valuation Stretch vs. Profitability Strength
VeriSign presents stronger margin efficiency but carries liquidity concerns, while CyberArk suffers from poor profitability despite solid liquidity and growth investments. VeriSign suits investors prioritizing cash flow stability; CyberArk fits those seeking long-term growth potential amid operational headwinds.
Which one offers the Superior Shareholder Reward?
CyberArk (CYBR) pays no dividends and focuses on reinvesting free cash flow (~5.2/share in 2025) into growth and innovation, with no buybacks reported. VeriSign (VRSN) offers a 0.96% dividend yield with a 22.5% payout ratio and maintains a strong buyback program, supported by robust free cash flow (~11.6/share). VeriSign’s high operating margins (68.8% EBIT margin in 2025) fund sustainable distributions. CyberArk’s negative net margins and lack of shareholder distributions suggest a riskier return profile. I conclude VeriSign delivers superior total shareholder reward in 2026 due to its balanced dividend and buyback strategy backed by strong cash flow.
Comparative Score Analysis: The Strategic Profile
The radar chart reveals the fundamental DNA and trade-offs of CyberArk Software Ltd. and VeriSign, Inc., highlighting their core financial strengths and vulnerabilities:
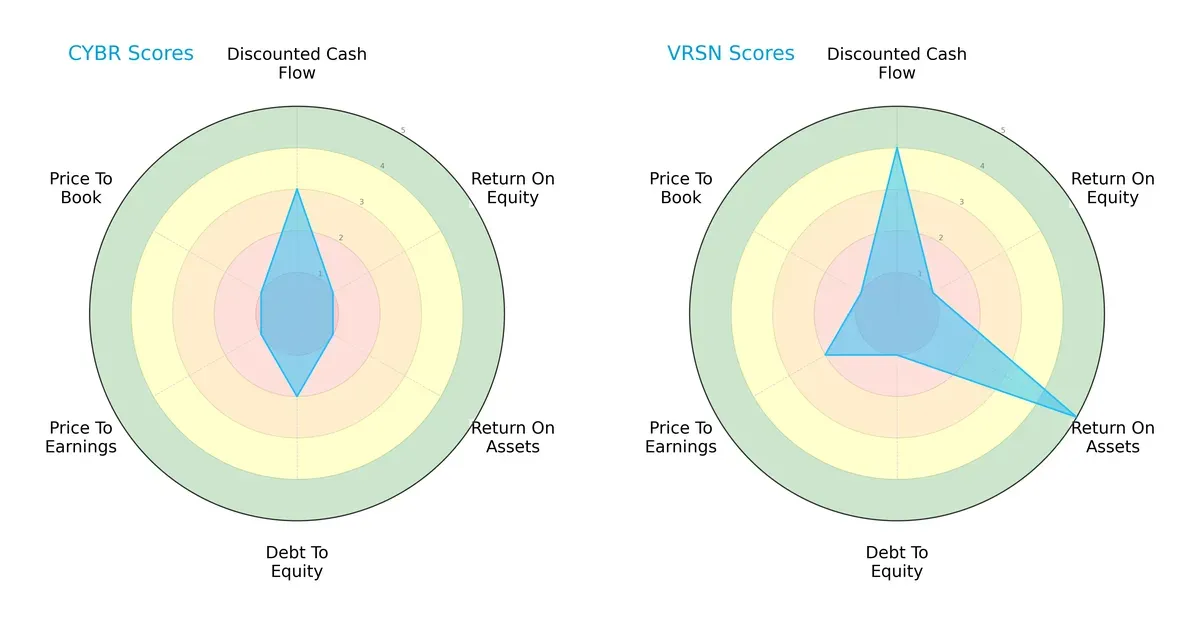
CyberArk shows moderate discounted cash flow strength (3) but struggles with returns on equity (1) and assets (1), paired with unfavorable debt and valuation scores. VeriSign excels in asset utilization (ROA score 5) and discounted cash flow (4) yet faces risks in debt management and valuation. VeriSign offers a more balanced profile with a clear cash flow edge, while CyberArk relies heavily on moderate DCF amid weaker profitability metrics.
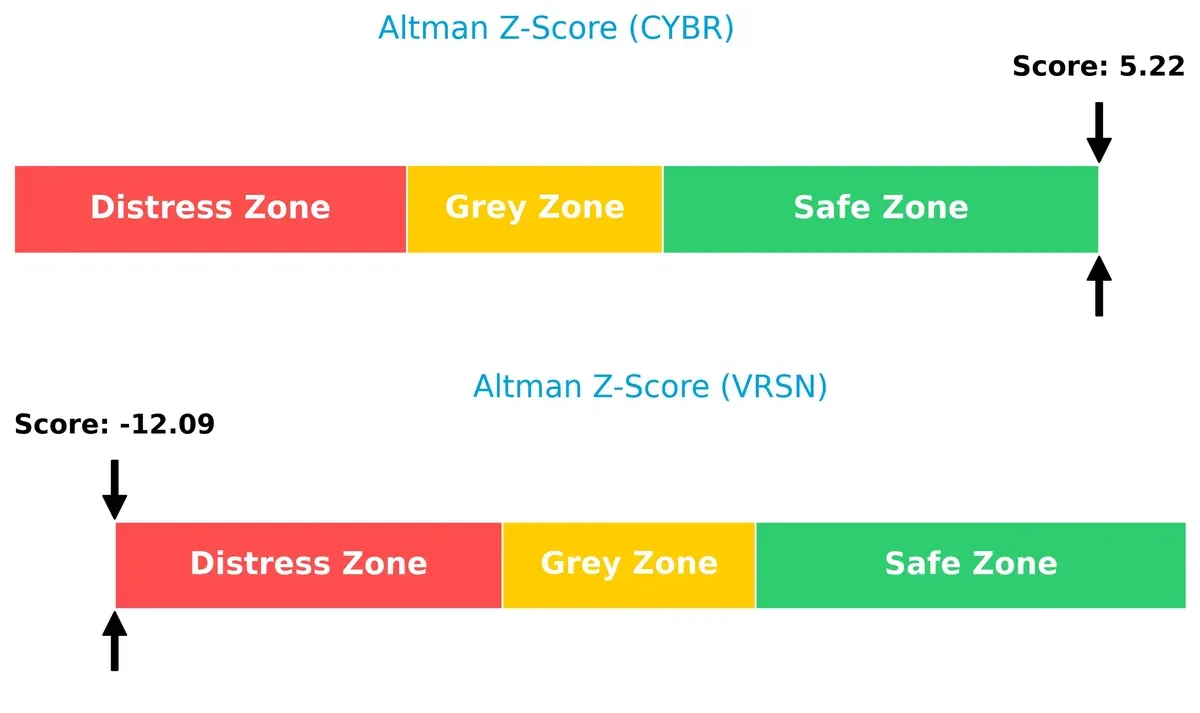
Bankruptcy Risk: Solvency Showdown
VeriSign’s Altman Z-Score plunges into the distress zone (-12.1), signaling severe bankruptcy risk, while CyberArk’s score (5.2) firmly places it in the safe zone. This stark contrast implies CyberArk’s stronger solvency and survival odds in this cycle:
Financial Health: Quality of Operations
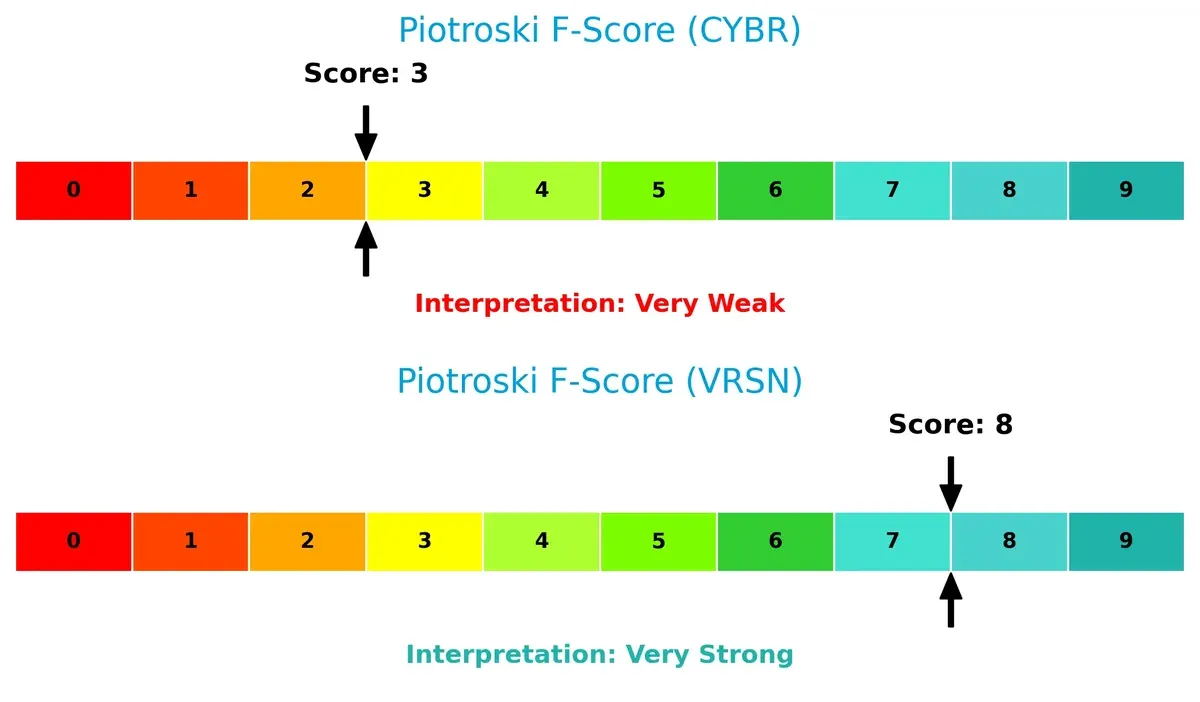
CyberArk’s Piotroski F-Score of 3 flags weak operational health, suggesting red flags in profitability and efficiency. VeriSign scores an impressive 8, reflecting robust financial quality and efficient internal metrics:
How are the two companies positioned?
This section dissects CyberArk and VeriSign’s operational DNA by comparing their revenue distribution and internal dynamics. The final goal is to confront their economic moats to identify which business model delivers a more resilient, sustainable competitive advantage.
Revenue Segmentation: The Strategic Mix
This visual comparison dissects how CyberArk Software Ltd. and VeriSign, Inc. diversify their income streams and where their primary sector bets lie:
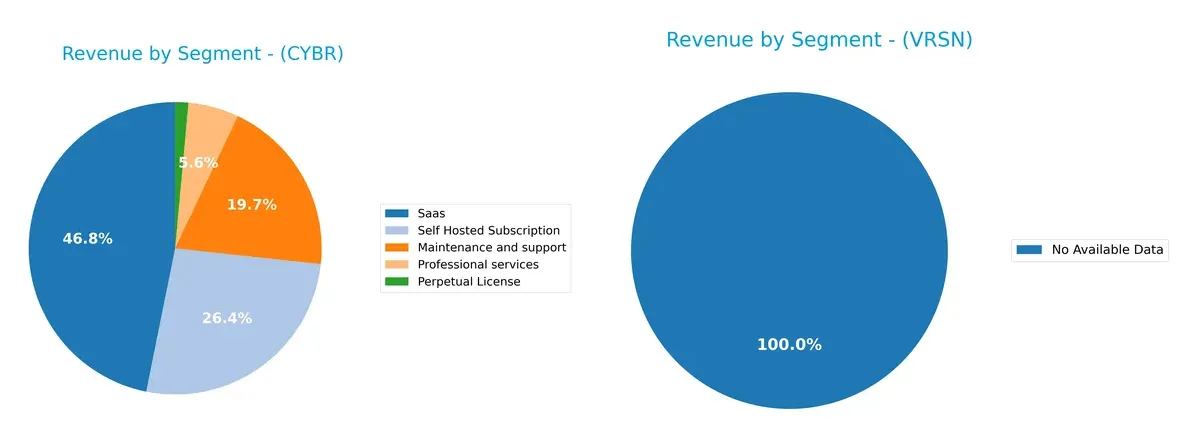
CyberArk leans on a diversified revenue base, with SaaS at $469M and Self Hosted Subscription at $265M anchoring growth. Maintenance and support also remains robust at $197M. VeriSign, lacking segment data, cannot be compared here. CyberArk’s mix suggests a strategic pivot toward recurring cloud services, reducing reliance on legacy licenses and professional services. This diversification lowers concentration risk and strengthens its ecosystem lock-in in cybersecurity.
Strengths and Weaknesses Comparison
This table compares the Strengths and Weaknesses of CyberArk and VeriSign based on diversification, profitability, financials, innovation, global presence, and market share:
CyberArk Strengths
- Strong SaaS revenue growth with 469M in 2024
- Diverse product lines including subscription and perpetual licenses
- Favorable current and quick ratios at 2.0
- Moderate debt to assets at 25.38%
- Broad geographic presence with 503M US and 243M EMEA revenues
VeriSign Strengths
- High net margin at 57.68%
- Favorable asset turnover at 2.46 and fixed asset turnover at 7.75
- Strong interest coverage at 14.81
- Favorable debt to equity ratio
- Large global footprint with 1.09B US and 279M EMEA revenues
CyberArk Weaknesses
- Negative profitability metrics: net margin -10.79%, ROE -6.11%, ROIC -2.74%
- Unfavorable interest coverage at 0
- High price-to-book ratio at 9.31
- Slightly unfavorable overall financial ratios
- Market share reliance on US and EMEA
VeriSign Weaknesses
- Negative ROE -64.84% and ROIC -151.96%
- Low current and quick ratios at 0.49
- Very high debt to assets at 265.55%
- Dividend yield below 1%
- Negative price-to-book ratio
Both companies show solid global presence and product diversification. CyberArk struggles with profitability and liquidity despite good operational metrics. VeriSign boasts strong margins and asset efficiency but faces risks from high leverage and weak returns. These contrasting profiles suggest different strategic priorities in managing growth and financial health.
The Moat Duel: Analyzing Competitive Defensibility
A structural moat is the only reliable shield that protects long-term profits from relentless competitive pressure and market disruption:
CyberArk Software Ltd.: Adaptive Privilege Security Moat
CyberArk’s primary moat stems from high switching costs embedded in its privileged access management solutions. Its financials show growing ROIC, signaling improving profitability despite current value destruction. Expansion into cloud entitlements in 2026 could deepen its moat.
VeriSign, Inc.: Internet Infrastructure Network Moat
VeriSign dominates with network effects via control of critical domain registries (.com, .net). Unlike CyberArk, it shows declining ROIC and value destruction, but exceptional margin stability and cash flow underpin its entrenched position. Future disruptions in internet protocols pose a risk.
Privileged Access vs. Internet Backbone: Which Moat Holds Stronger?
CyberArk’s adaptive security moat is gaining strength with innovation and expanding markets. VeriSign’s entrenched network effects offer durability but face margin pressure and declining returns. I see CyberArk better positioned to defend and grow its market share in 2026.
Which stock offers better returns?
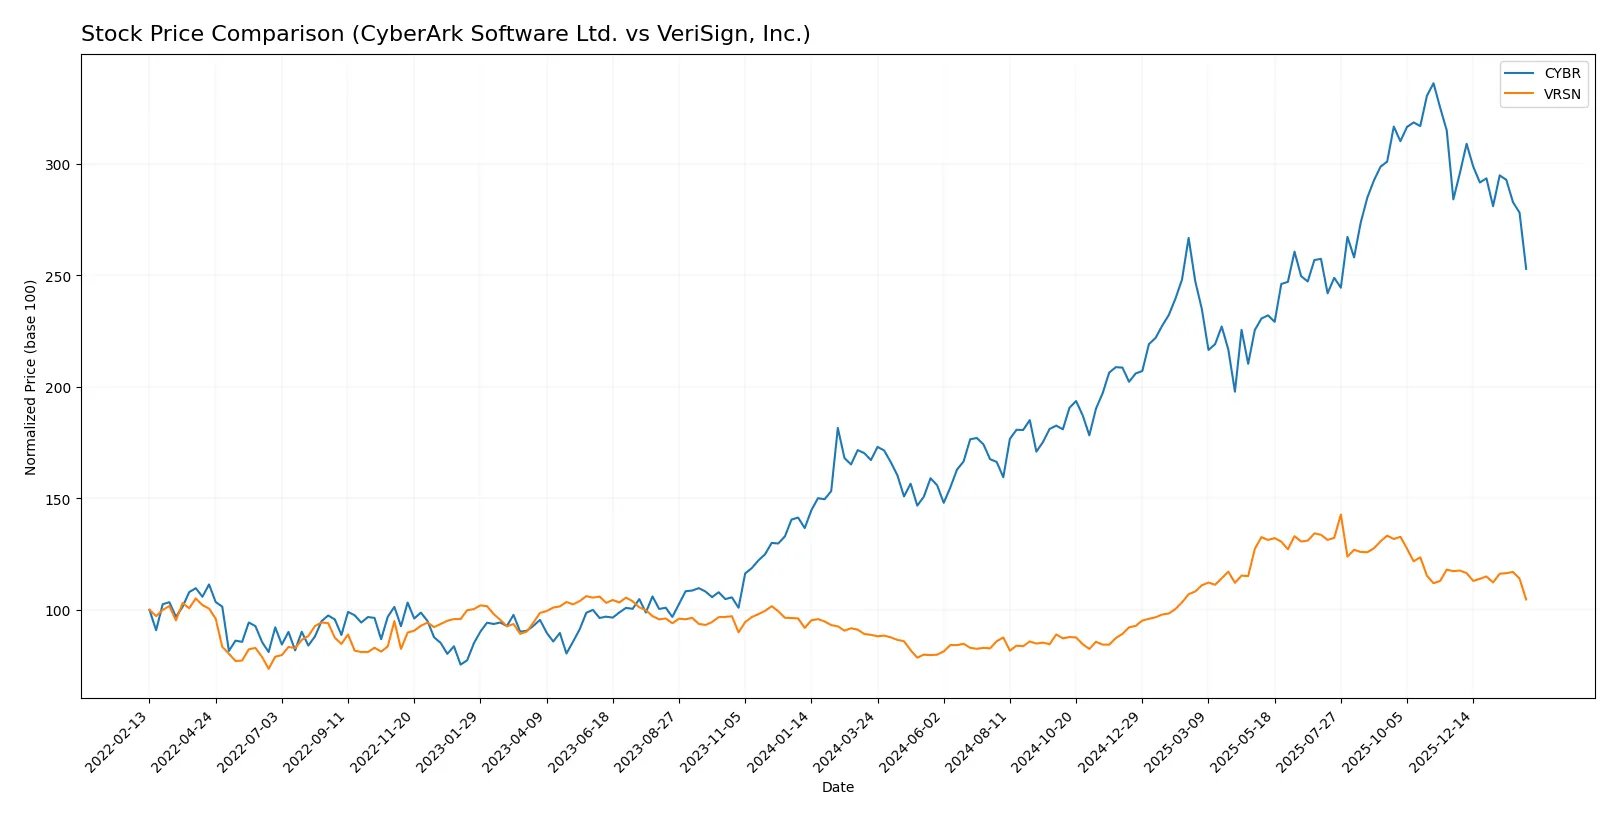
The past year shows marked bullish momentum for both stocks, with CyberArk Software Ltd. surging sharply before recent deceleration, while VeriSign, Inc. posted steadier gains with modest slowing.
Trend Comparison
CyberArk’s stock gained 51.27% over the past year, a strong bullish trend with deceleration. It ranged from 227.32 to a high of 520.78, showing volatility with an 81.97 standard deviation.
VeriSign’s stock rose 17.83% in the same period, also bullish but with decelerating momentum. Its price ranged from 168.32 to 305.79, exhibiting lower volatility at a 40.67 standard deviation.
CyberArk outperformed VeriSign overall, delivering higher returns despite recent short-term declines in both stocks from late 2025 to early 2026.
Target Prices
Analysts set a bullish consensus for CyberArk Software Ltd. and a steady outlook for VeriSign, Inc.
| Company | Target Low | Target High | Consensus |
|---|---|---|---|
| CyberArk Software Ltd. | 411 | 502 | 466.17 |
| VeriSign, Inc. | 325 | 325 | 325 |
CyberArk’s target consensus at $466 exceeds its current price of $392, suggesting upside potential. VeriSign’s target of $325 also surpasses its current $224 price, indicating room for growth despite recent declines.

Don’t Let Luck Decide Your Entry Point
Optimize your entry points with our advanced ProRealTime indicators. You’ll get efficient buy signals with precise price targets for maximum performance. Start outperforming now!
How do institutions grade them?
CyberArk Software Ltd. Grades
Here are the recent grades assigned by reputable grading companies for CyberArk Software Ltd.:
| Grading Company | Action | New Grade | Date |
|---|---|---|---|
| Oppenheimer | Maintain | Outperform | 2024-10-22 |
| Keybanc | Maintain | Overweight | 2024-10-18 |
| Mizuho | Maintain | Outperform | 2024-10-17 |
| BTIG | Maintain | Buy | 2024-10-09 |
| Barclays | Maintain | Overweight | 2024-10-07 |
| Wedbush | Maintain | Outperform | 2024-10-01 |
| Jefferies | Maintain | Buy | 2024-09-24 |
| Keybanc | Maintain | Overweight | 2024-08-09 |
| Citigroup | Maintain | Buy | 2024-08-09 |
| Susquehanna | Maintain | Positive | 2024-08-09 |
VeriSign, Inc. Grades
Below are the recent grades issued by reliable grading companies for VeriSign, Inc.:
| Grading Company | Action | New Grade | Date |
|---|---|---|---|
| JP Morgan | Maintain | Neutral | 2026-01-06 |
| Baird | Maintain | Outperform | 2025-07-01 |
| Baird | Maintain | Outperform | 2025-04-25 |
| Baird | Maintain | Outperform | 2025-04-01 |
| Citigroup | Maintain | Buy | 2025-02-04 |
| Citigroup | Maintain | Buy | 2025-01-03 |
| Baird | Upgrade | Outperform | 2024-12-09 |
| Baird | Maintain | Neutral | 2024-06-27 |
| Baird | Maintain | Neutral | 2024-04-26 |
| Citigroup | Maintain | Buy | 2024-04-02 |
Which company has the best grades?
CyberArk Software Ltd. consistently receives high marks, mostly Outperform and Buy ratings. VeriSign, Inc. shows a mix of Neutral and Outperform grades, with fewer Buy ratings recently. Investors might view CyberArk’s stronger consensus as a signal of greater confidence from analysts.
Risks specific to each company
The following categories identify the critical pressure points and systemic threats facing both firms in the 2026 market environment:
1. Market & Competition
CyberArk Software Ltd.
- Faces intense competition in cybersecurity, requiring continuous innovation to maintain its niche.
VeriSign, Inc.
- Dominates domain registry with strong market position but faces risks from alternative internet infrastructure solutions.
2. Capital Structure & Debt
CyberArk Software Ltd.
- Moderate leverage with debt-to-assets at 25%, interest coverage weak at 0, indicating potential liquidity risks.
VeriSign, Inc.
- High debt-to-assets at 265%, but strong interest coverage at 14.8, showing ability to service debt despite capital structure risks.
3. Stock Volatility
CyberArk Software Ltd.
- Beta of 0.93 suggests moderate volatility, with a recent positive price change of +2.63%.
VeriSign, Inc.
- Lower beta at 0.75 indicates less volatility, but recent sharp price drop of -7.6% signals market concerns.
4. Regulatory & Legal
CyberArk Software Ltd.
- Operates globally with exposure to cybersecurity regulations; compliance costs may rise sharply.
VeriSign, Inc.
- Subject to internet governance and DNS regulations, with potential legal challenges around domain management.
5. Supply Chain & Operations
CyberArk Software Ltd.
- Relies on software delivery; risks include cloud service dependencies and cyber threats.
VeriSign, Inc.
- Infrastructure-heavy operations depend on maintaining distributed servers; hardware failures or attacks pose risks.
6. ESG & Climate Transition
CyberArk Software Ltd.
- Faces pressure to enhance data privacy and security governance amid ESG investor scrutiny.
VeriSign, Inc.
- Increasing demand for sustainable internet infrastructure, but energy use of servers is a growing concern.
7. Geopolitical Exposure
CyberArk Software Ltd.
- Headquarters in Israel expose it to Middle East geopolitical risks affecting operations and supply chains.
VeriSign, Inc.
- US-based with global reach, sensitive to international trade policies and cyberwarfare risks.
Which company shows a better risk-adjusted profile?
CyberArk’s most impactful risk lies in its weak profitability and liquidity, reflected by a negative net margin and zero interest coverage. VeriSign faces significant leverage challenges but benefits from strong cash flow and interest coverage. VeriSign’s stable stock volatility and superior Piotroski score (8 vs. CyberArk’s 3) indicate better operational strength. However, VeriSign’s Altman Z-score deep in distress zone signals financial distress risk. Overall, VeriSign offers a slightly better risk-adjusted profile thanks to its robust cash flows and market position, despite its heavy debt load. CyberArk’s recent steady price gains mask underlying financial weaknesses that warrant caution.
Final Verdict: Which stock to choose?
CyberArk’s superpower lies in its accelerating revenue growth and solid liquidity, suggesting strong operational momentum. However, its persistent value destruction and weak profitability are points of vigilance. This stock might suit investors seeking aggressive growth with tolerance for turnaround risk.
VeriSign commands a strategic moat through its dominant high-margin recurring revenue and exceptional cash flow efficiency. It offers better financial stability compared to CyberArk, despite a concerning liquidity position. VeriSign appears more fitting for growth-at-a-reasonable-price (GARP) investors who value durability.
If you prioritize high-growth potential and can stomach volatility, CyberArk’s improving operational metrics might outshine VeriSign’s steadiness. However, if you seek better stability and a proven cash machine with a strong moat, VeriSign offers a more secure analytical scenario — albeit at a premium.
Disclaimer: Investment carries a risk of loss of initial capital. The past performance is not a reliable indicator of future results. Be sure to understand risks before making an investment decision.
Go Further
I encourage you to read the complete analyses of CyberArk Software Ltd. and VeriSign, Inc. to enhance your investment decisions: