In the fast-evolving world of software infrastructure, CyberArk Software Ltd. and UiPath Inc. stand out as key players driving innovation in security and automation. CyberArk specializes in privileged access management, while UiPath leads in robotic process automation—both critical to enterprise efficiency and risk reduction. This article compares their market positions, growth strategies, and potential risks to help you decide which company is the more compelling investment opportunity in 2026.

Table of contents
Companies Overview
I will begin the comparison between CyberArk Software Ltd. and UiPath Inc. by providing an overview of these two companies and their main differences.
CyberArk Software Ltd. Overview
CyberArk Software Ltd. develops and markets software-based security solutions globally, focusing on privileged access management and identity services. Its products protect against cyberattacks involving privileged credentials across various industries, including financial services and healthcare. Founded in 1999 and headquartered in Petah Tikva, Israel, CyberArk operates through direct sales and partners, positioning itself as a leader in infrastructure security software.
UiPath Inc. Overview
UiPath Inc. provides an end-to-end robotic process automation (RPA) platform designed to automate business workflows using AI and low-code tools. Its software suite enables organizations to build, run, and manage automations, serving sectors like banking, healthcare, and government. Founded in 2005 and based in New York City, UiPath focuses on enhancing operational efficiency through automation and offers professional services to support adoption.
Key similarities and differences
Both CyberArk and UiPath operate in the technology sector within the software infrastructure industry, serving large enterprise clients across regulated industries. CyberArk specializes in cybersecurity solutions for privileged access, while UiPath focuses on automation through RPA technology. Each company employs around 3.8K employees and trades on major U.S. exchanges, with CyberArk listed on NASDAQ and UiPath on NYSE, reflecting distinct but complementary business models.
Income Statement Comparison
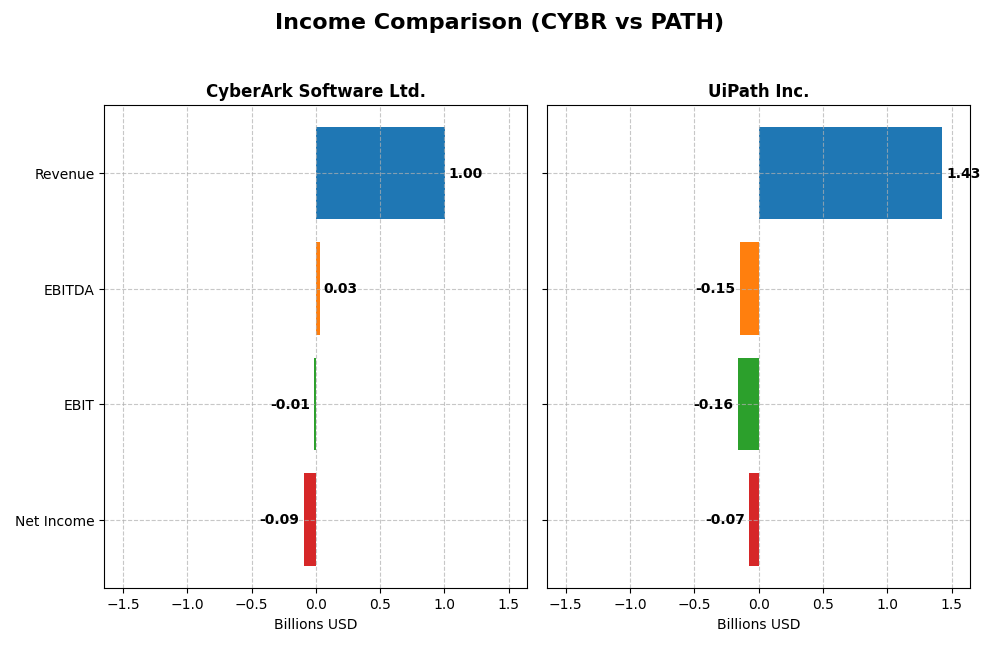
This table presents a side-by-side comparison of key income statement metrics for CyberArk Software Ltd. and UiPath Inc. for their most recent fiscal years.
| Metric | CyberArk Software Ltd. (CYBR) | UiPath Inc. (PATH) |
|---|---|---|
| Market Cap | 22.9B | 7.7B |
| Revenue | 1.00B | 1.43B |
| EBITDA | 28.7M | -145.3M |
| EBIT | -13.3M | -162.6M |
| Net Income | -93.5M | -73.7M |
| EPS | -2.12 | -0.13 |
| Fiscal Year | 2024 | 2025 |
Income Statement Interpretations
CyberArk Software Ltd.
CyberArk showed strong revenue growth from 2020 to 2024, with a 115% increase, yet net income deteriorated significantly, recording a -1523% decline over the same period. Gross margins remained favorable at around 79%, but EBIT and net margins were negative and unfavorable. In 2024, revenue surged 33%, improving EBIT by 78%, though net margin and EPS continued to decline, reflecting ongoing profitability challenges.
UiPath Inc.
UiPath experienced consistent revenue growth, up 135% from 2021 to 2025, alongside a notable 20% rise in net income. Gross margins were strong at 83%, but EBIT margins stayed negative, albeit less so than CyberArk’s. The 2025 fiscal year saw revenue growth moderate to 9.3%, with net margin and EPS improving significantly, highlighting progress toward enhanced operational efficiency and profitability.
Which one has the stronger fundamentals?
UiPath’s income statement reveals a more favorable overall performance, with higher gross margins, positive net income growth, and improving net margins over time. CyberArk’s financials show solid revenue gains but persistent net losses and negative margins. UiPath’s balanced growth and margin improvements indicate comparatively stronger fundamentals based solely on income statement metrics.
Financial Ratios Comparison
The table below presents a side-by-side comparison of key financial ratios for CyberArk Software Ltd. and UiPath Inc. based on their most recent fiscal year data.
| Ratios | CyberArk Software Ltd. (CYBR) | UiPath Inc. (PATH) |
|---|---|---|
| ROE | -3.94% | -3.99% |
| ROIC | -2.85% | -7.41% |
| P/E | -157.5 | -108.0 |
| P/B | 6.21 | 4.31 |
| Current Ratio | 1.48 | 2.93 |
| Quick Ratio | 1.48 | 2.93 |
| D/E (Debt-to-Equity) | 0.012 | 0.042 |
| Debt-to-Assets | 0.009 | 0.027 |
| Interest Coverage | -17.9 | 0 |
| Asset Turnover | 0.30 | 0.50 |
| Fixed Asset Turnover | 51.11 | 14.41 |
| Payout ratio | 0 | 0 |
| Dividend yield | 0 | 0 |
Interpretation of the Ratios
CyberArk Software Ltd.
CyberArk’s ratios present a mixed picture with 35.7% favorable and 50% unfavorable indicators, leading to a slightly unfavorable overall view. Key concerns include negative net margin (-9.34%) and return on equity (-3.94%), along with weak asset turnover (0.3). The company does not pay dividends, likely reflecting a reinvestment strategy or growth phase without shareholder returns via payouts.
UiPath Inc.
UiPath shows 42.9% favorable ratios and 50% unfavorable, also resulting in a slightly unfavorable rating. While liquidity ratios are strong (current and quick ratio at 2.93), profitability metrics such as net margin (-5.15%) and return on invested capital (-7.41%) remain weak. UiPath does not distribute dividends, consistent with its focus on reinvestment and growth priorities.
Which one has the best ratios?
Both companies face profitability challenges and share a slightly unfavorable overall ratio evaluation. UiPath has stronger liquidity and leverage ratios, whereas CyberArk’s fixed asset turnover is notably higher. Given these mixed strengths and weaknesses, neither company distinctly outperforms the other in ratio quality.
Strategic Positioning
This section compares the strategic positioning of CyberArk Software Ltd. and UiPath Inc., including market position, key segments, and exposure to technological disruption:
CyberArk Software Ltd.
- Market leader in software-based security solutions under competitive pressure from infrastructure software peers.
- Focuses on privileged access management, identity services, and SaaS/cloud security across multiple industries globally.
- Faces disruption risks from evolving cloud security needs and identity management technology advancements.
UiPath Inc.
- Provides robotic process automation (RPA) platform amid competitive automation software landscape.
- Concentrates on end-to-end automation with AI-driven RPA primarily in banking, healthcare, and government sectors.
- Exposure to AI and automation technology shifts, leveraging low-code and AI integration for workflow automation.
CyberArk vs UiPath Positioning
CyberArk pursues a diversified security software approach across various industries, benefiting from broad market applications but facing intense competition. UiPath adopts a concentrated automation platform strategy with strong AI integration, offering focused innovation but narrower segment exposure.
Which has the best competitive advantage?
Neither company currently demonstrates a strong economic moat, with both shedding value; however, UiPath shows improving ROIC trends, suggesting potential for increasing competitive advantage over CyberArk’s declining profitability.
Stock Comparison
The stock prices of CyberArk Software Ltd. (CYBR) and UiPath Inc. (PATH) over the past 12 months show contrasting trajectories, with CYBR experiencing a strong bullish trend despite recent deceleration, while PATH faces a sustained bearish trend with accelerating declines.

Trend Analysis
CyberArk Software Ltd. (CYBR) posted a 77.27% price increase over the past year, signaling a bullish trend with deceleration. The stock ranged from 227.32 to 520.78, showing high volatility with an 82.45 standard deviation.
UiPath Inc. (PATH) declined by 38.53% in the same period, reflecting a bearish trend with accelerating downward momentum. Price fluctuations were narrower, between 10.04 and 23.66, with a 3.33 standard deviation.
Comparing both, CYBR delivered the highest market performance with a strong bullish gain, while PATH showed a significant bearish decline over the last year.
Target Prices
The current analyst consensus indicates a positive outlook for both CyberArk Software Ltd. and UiPath Inc.
| Company | Target High | Target Low | Consensus |
|---|---|---|---|
| CyberArk Software Ltd. | 520 | 440 | 479.22 |
| UiPath Inc. | 19 | 14 | 16.6 |
Analysts expect CyberArk’s stock to appreciate moderately from its current price of 453.65 USD, while UiPath’s consensus target suggests potential upside from the present 14.34 USD price.
Analyst Opinions Comparison
This section compares analysts’ ratings and grades for CyberArk Software Ltd. and UiPath Inc.:
Rating Comparison
CyberArk Rating
- Rating: C- with a very favorable status, indicating mixed analyst sentiment.
- Discounted Cash Flow Score: 3, rated moderate, suggesting fair valuation outlook.
- ROE Score: 1, very unfavorable, showing weak profit generation from equity.
- ROA Score: 1, very unfavorable, reflecting poor asset utilization.
- Debt To Equity Score: 2, moderate, implying moderate financial risk.
- Overall Score: 1, very unfavorable, suggesting weak overall financial health.
UiPath Rating
- Rating: B+ with a very favorable status, reflecting generally positive opinions.
- Discounted Cash Flow Score: 3, rated moderate, indicating fair valuation outlook.
- ROE Score: 4, favorable, indicating strong profit generation from equity.
- ROA Score: 4, favorable, indicating effective asset utilization.
- Debt To Equity Score: 4, favorable, indicating lower financial risk.
- Overall Score: 3, moderate, indicating decent overall financial health.
Which one is the best rated?
UiPath holds a superior rating of B+ and outperforms CyberArk in key financial metrics such as ROE, ROA, debt-to-equity, and overall score. CyberArk’s ratings and scores are generally lower, indicating weaker financial performance based on the provided data.
Scores Comparison
Here is a comparison of the Altman Z-Score and Piotroski Score for CyberArk and UiPath:
CyberArk Scores
- Altman Z-Score: 6.52, indicating the company is in the safe zone with low bankruptcy risk.
- Piotroski Score: 3, rated very weak, suggesting weak financial strength.
UiPath Scores
- Altman Z-Score: 5.27, the company is also in the safe zone with low bankruptcy risk.
- Piotroski Score: 7, rated strong, indicating good financial strength.
Which company has the best scores?
UiPath has a lower Altman Z-Score than CyberArk but both are in the safe zone. However, UiPath’s Piotroski Score of 7 is significantly stronger than CyberArk’s very weak score of 3, reflecting better financial health based on the data provided.
Grades Comparison
The following presents a comparison of recent grades assigned to CyberArk Software Ltd. and UiPath Inc.:
CyberArk Software Ltd. Grades
This table summarizes recent grades from reputable financial institutions for CyberArk Software Ltd.:
| Grading Company | Action | New Grade | Date |
|---|---|---|---|
| Oppenheimer | Maintain | Outperform | 2024-10-22 |
| Keybanc | Maintain | Overweight | 2024-10-18 |
| Mizuho | Maintain | Outperform | 2024-10-17 |
| BTIG | Maintain | Buy | 2024-10-09 |
| Barclays | Maintain | Overweight | 2024-10-07 |
| Wedbush | Maintain | Outperform | 2024-10-01 |
| Jefferies | Maintain | Buy | 2024-09-24 |
| DA Davidson | Maintain | Buy | 2024-08-09 |
| Rosenblatt | Maintain | Buy | 2024-08-09 |
| Susquehanna | Maintain | Positive | 2024-08-09 |
Overall, CyberArk’s grades consistently indicate a strong buy and outperform stance from multiple reputable firms, reflecting positive analyst sentiment.
UiPath Inc. Grades
This table presents recent grades from reputable financial institutions for UiPath Inc.:
| Grading Company | Action | New Grade | Date |
|---|---|---|---|
| Barclays | Maintain | Equal Weight | 2026-01-12 |
| RBC Capital | Maintain | Sector Perform | 2026-01-05 |
| RBC Capital | Maintain | Sector Perform | 2025-12-10 |
| Morgan Stanley | Maintain | Equal Weight | 2025-12-09 |
| DA Davidson | Maintain | Neutral | 2025-12-05 |
| Canaccord Genuity | Maintain | Buy | 2025-12-04 |
| Mizuho | Maintain | Neutral | 2025-12-04 |
| RBC Capital | Maintain | Sector Perform | 2025-12-04 |
| Wells Fargo | Maintain | Equal Weight | 2025-12-04 |
| Evercore ISI Group | Maintain | In Line | 2025-12-04 |
UiPath’s grades mostly range from neutral to sector perform and equal weight, with one buy rating, indicating moderate analyst confidence.
Which company has the best grades?
CyberArk Software Ltd. has received significantly stronger and more positive grades than UiPath Inc., which shows a mix of neutral and moderate ratings. This disparity may influence investors toward CyberArk due to its more favorable analyst outlook.
Strengths and Weaknesses
Below is a comparative table highlighting key strengths and weaknesses of CyberArk Software Ltd. (CYBR) and UiPath Inc. (PATH) based on recent financial and operational data:
| Criterion | CyberArk Software Ltd. (CYBR) | UiPath Inc. (PATH) |
|---|---|---|
| Diversification | Moderate: Diverse revenue streams including SaaS (468.7M), Self Hosted Subscription (264.6M), and Maintenance & Support (197.0M) | Good: Balanced revenue from License (587.2M), Subscription Services (802.0M), and Professional Services (70.7M) |
| Profitability | Weak: Negative net margin (-9.34%) and ROIC (-2.85%), with declining profitability and value destruction | Weak but improving: Negative net margin (-5.15%) and ROIC (-7.41%), yet ROIC is trending upward indicating improving profitability |
| Innovation | Moderate: Strong in self-hosted and SaaS security solutions but facing profitability challenges | Moderate to strong: Focused on automation software with growing ROIC suggesting increasing operational efficiency |
| Global presence | Established global player in cybersecurity with steady revenue growth in subscription models | Strong global footprint in robotic process automation with growing subscription revenue and expanding market presence |
| Market Share | Niche leader in privileged access management but challenged by competition and shrinking margins | Rapidly growing market share in automation software, capitalizing on expanding subscription services |
Key takeaways: CyberArk shows a diversified revenue mix but struggles with declining profitability and value destruction, signaling caution for investors. UiPath, while also unprofitable currently, exhibits improving returns and expanding market presence, suggesting potential for future value creation. Both require careful risk assessment given their financial challenges.
Risk Analysis
Below is a comparative table of key risk metrics for CyberArk Software Ltd. (CYBR) and UiPath Inc. (PATH) as of the most recent fiscal years:
| Metric | CyberArk Software Ltd. (CYBR) | UiPath Inc. (PATH) |
|---|---|---|
| Market Risk | Beta 0.915 (moderate volatility) | Beta 1.079 (slightly higher volatility) |
| Debt level | Debt/Equity 0.01 (very low) | Debt/Equity 0.04 (low) |
| Regulatory Risk | Moderate (operates globally with compliance demands) | Moderate (US and international exposure) |
| Operational Risk | Moderate (software infrastructure complexity) | Moderate (automation platform scalability) |
| Environmental Risk | Low (software sector, limited direct impact) | Low (software sector, limited direct impact) |
| Geopolitical Risk | Elevated (headquartered in Israel, geopolitical tensions) | Moderate (US-based, global operations) |
In summary, both companies present moderate operational and regulatory risks typical for technology firms. CyberArk’s geopolitical risk is more pronounced due to its Israeli base amid regional tensions, while UiPath faces slightly higher market volatility. Both maintain very low debt levels, which mitigates financial risk. Investors should closely monitor CyberArk’s geopolitical environment and UiPath’s market fluctuations as the most impactful risks.
Which Stock to Choose?
CyberArk Software Ltd. (CYBR) shows a significant revenue growth of 33.1% in 2024, with a strong gross margin of 79.18%. However, profitability remains negative with unfavorable net margin and returns on equity and invested capital. Debt levels are low, and financial ratios are slightly unfavorable overall, while the rating is very favorable but with weak profitability scores.
UiPath Inc. (PATH) experienced moderate revenue growth of 9.3% in 2025 and a higher gross margin of 82.73%. Profitability metrics are also negative but improving, with net margin growth and EPS growth showing favorable trends. PATH has slightly higher debt but favorable liquidity ratios and a very favorable rating with stronger profitability and financial stability scores.
For investors prioritizing growth and improving profitability, PATH might appear more favorable given its positive income statement trends and stronger rating. Conversely, those focused on lower debt and a very favorable rating despite weaker profitability might view CYBR as a different profile choice. The decision could thus depend on the investor’s risk tolerance and investment strategy.
Disclaimer: Investment carries a risk of loss of initial capital. The past performance is not a reliable indicator of future results. Be sure to understand risks before making an investment decision.
Go Further
I encourage you to read the complete analyses of CyberArk Software Ltd. and UiPath Inc. to enhance your investment decisions: