In today’s fast-evolving tech landscape, choosing the right software infrastructure company is key for investors seeking growth and innovation. Synopsys, Inc. (SNPS) and CyberArk Software Ltd. (CYBR) both operate in this critical sector, with Synopsys focusing on electronic design automation and embedded security, while CyberArk specializes in privileged access management and identity security. This article will help you determine which company presents the most compelling investment opportunity.
Table of contents
Companies Overview
I will begin the comparison between Synopsys and CyberArk by providing an overview of these two companies and their main differences.
Synopsys Overview
Synopsys, Inc. is a leading provider of electronic design automation software products, specializing in tools for designing and testing integrated circuits. The company’s offerings include platforms for digital design implementation, verification, FPGA prototyping, and a broad range of intellectual property solutions. Synopsys serves diverse sectors such as electronics, financial services, automotive, and energy, positioning itself as a critical infrastructure software provider with a market cap near 99B USD.
CyberArk Overview
CyberArk Software Ltd. develops and markets software security solutions focused on privileged access management and identity access management services. Its portfolio includes risk-based credential security, cloud entitlement management, and adaptive multi-factor authentication, targeting industries like financial services, healthcare, manufacturing, and government agencies. Headquartered in Israel, CyberArk maintains a market cap of approximately 23B USD and employs under 4,000 staff, emphasizing cybersecurity as its core mission.
Key similarities and differences
Both Synopsys and CyberArk operate in the Software – Infrastructure industry, targeting enterprise clients with specialized software solutions. Synopsys focuses on electronic design automation and IP for integrated circuits, serving a broad range of tech-driven sectors, while CyberArk concentrates on cybersecurity services around privileged access and identity management. Their market caps and employee counts differ significantly, reflecting Synopsys’s broader scale and product diversity versus CyberArk’s cybersecurity niche and smaller footprint.
Income Statement Comparison
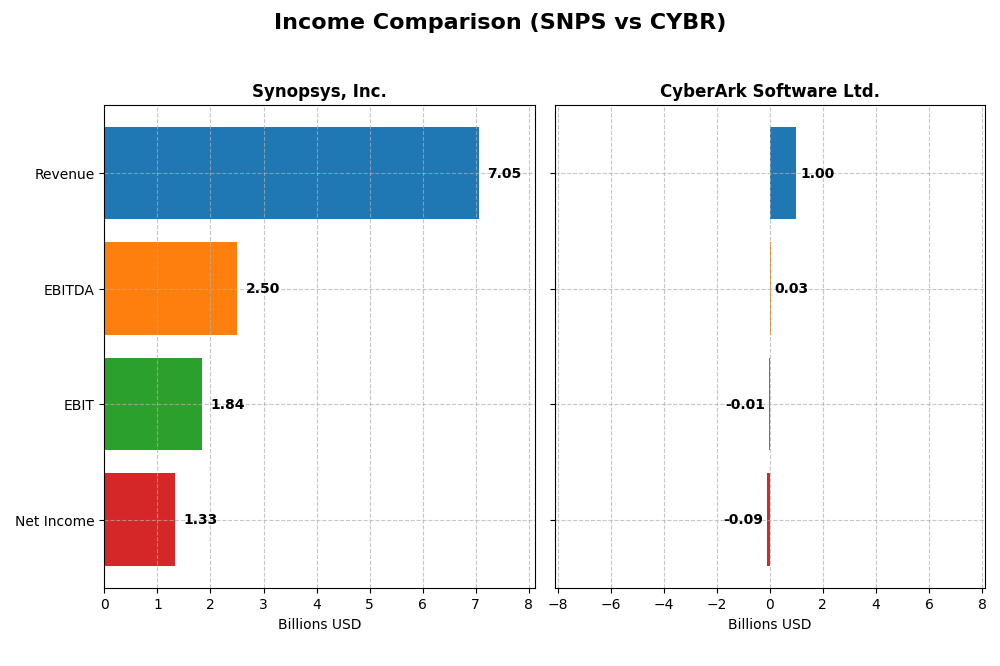
Below is a comparison of the most recent fiscal year income statement metrics for Synopsys, Inc. and CyberArk Software Ltd.
| Metric | Synopsys, Inc. (SNPS) | CyberArk Software Ltd. (CYBR) |
|---|---|---|
| Market Cap | 98.8B | 22.9B |
| Revenue | 7.05B | 1.00B |
| EBITDA | 2.50B | 29M |
| EBIT | 1.84B | -13M |
| Net Income | 1.33B | -93M |
| EPS | 8.13 | -2.12 |
| Fiscal Year | 2025 | 2024 |
Income Statement Interpretations
Synopsys, Inc.
Synopsys demonstrated consistent revenue growth from $4.2B in 2021 to $7.1B in 2025, with net income rising from $757M to $1.33B. Margins remained largely favorable, with a gross margin of 77% and an EBIT margin above 26% in 2025. However, net margin and EPS declined in 2025 despite healthy revenue and EBIT growth, signaling margin pressure in the latest year.
CyberArk Software Ltd.
CyberArk’s revenue expanded significantly from $464M in 2020 to $1.0B in 2024, but net income remained negative, widening to a loss of $93M in 2024. While the gross margin stayed strong at 79%, EBIT and net margins were negative, reflecting ongoing profitability challenges. The most recent year showed robust revenue and EBIT growth but continued net losses and declining EPS.
Which one has the stronger fundamentals?
Synopsys exhibits stronger fundamentals with sustained revenue and net income growth, favorable gross and EBIT margins, and a solid overall income statement evaluation. In contrast, CyberArk shows impressive revenue gains but persistent net losses and unfavorable profitability metrics, resulting in a neutral income statement opinion. The stability and profitability trends favor Synopsys in this comparison.
Financial Ratios Comparison
The table below presents a side-by-side comparison of key financial ratios for Synopsys, Inc. (SNPS) and CyberArk Software Ltd. (CYBR) based on the most recent fiscal year data available.
| Ratios | Synopsys, Inc. (SNPS) 2025 | CyberArk Software Ltd. (CYBR) 2024 |
|---|---|---|
| ROE | 4.72% | -3.94% |
| ROIC | 1.97% | -2.85% |
| P/E | 54.36 | -157.49 |
| P/B | 2.57 | 6.21 |
| Current Ratio | 1.62 | 1.48 |
| Quick Ratio | 1.52 | 1.48 |
| D/E | 0.50 | 0.01 |
| Debt-to-Assets | 29.6% | 0.88% |
| Interest Coverage | 2.05 | -17.90 |
| Asset Turnover | 0.15 | 0.30 |
| Fixed Asset Turnover | 5.04 | 51.11 |
| Payout Ratio | 0 | 0 |
| Dividend Yield | 0% | 0% |
Interpretation of the Ratios
Synopsys, Inc.
Synopsys shows a mixed ratio profile with strengths in net margin (18.96%) and liquidity ratios (current ratio 1.62, quick ratio 1.52), indicating solid operational efficiency and short-term financial health. However, its low return on equity (4.72%) and return on invested capital (1.97%) raise concerns about profitability and capital efficiency. The company does not pay dividends, reflecting a possible focus on reinvestment and growth rather than immediate shareholder returns.
CyberArk Software Ltd.
CyberArk’s financial ratios reveal challenges, with negative net margin (-9.34%) and returns (ROE -3.94%, ROIC -2.85%), signaling ongoing profitability issues. Favorable debt metrics like debt to equity (0.01) and debt to assets (0.88%) suggest low leverage. The lack of dividends aligns with its negative earnings and potential prioritization of R&D and expansion efforts over shareholder payouts.
Which one has the best ratios?
Comparing both, Synopsys presents a more balanced and financially stable set of ratios with favorable profitability and liquidity, despite some weaknesses in returns. CyberArk struggles with profitability and interest coverage but benefits from low leverage. Overall, Synopsys demonstrates relatively stronger financial health, while CyberArk’s ratios indicate higher risk and operational challenges.
Strategic Positioning
This section compares the strategic positioning of Synopsys and CyberArk, focusing on market position, key segments, and exposure to technological disruption:
Synopsys, Inc.
- Leading in electronic design automation with strong market presence and competitive pressure in tech infrastructure software.
- Key segments include License and Maintenance, Technology Services, and extensive IP solutions for various electronics sectors.
- Exposed to disruption via advances in chip design tools, FPGA prototyping, and security testing within software development lifecycles.
CyberArk Software Ltd.
- Focused on software-based security solutions, facing competitive pressure in cybersecurity and privileged access management.
- Key segments are SaaS, Self-Hosted Subscription, Maintenance, and Professional Services in identity and access management.
- Exposed to disruption through evolving cloud security, SaaS, and adaptive identity management technologies.
Synopsys vs CyberArk Positioning
Synopsys pursues a diversified approach across electronic design automation and IP products, while CyberArk focuses on concentrated cybersecurity and identity solutions. Synopsys’s broad portfolio spans multiple industries, contrasting with CyberArk’s specialized security market focus.
Which has the best competitive advantage?
Both companies show very unfavorable MOAT evaluations with declining ROIC trends, indicating shedding value and decreasing profitability, suggesting neither currently holds a sustainable competitive advantage based on capital efficiency.
Stock Comparison
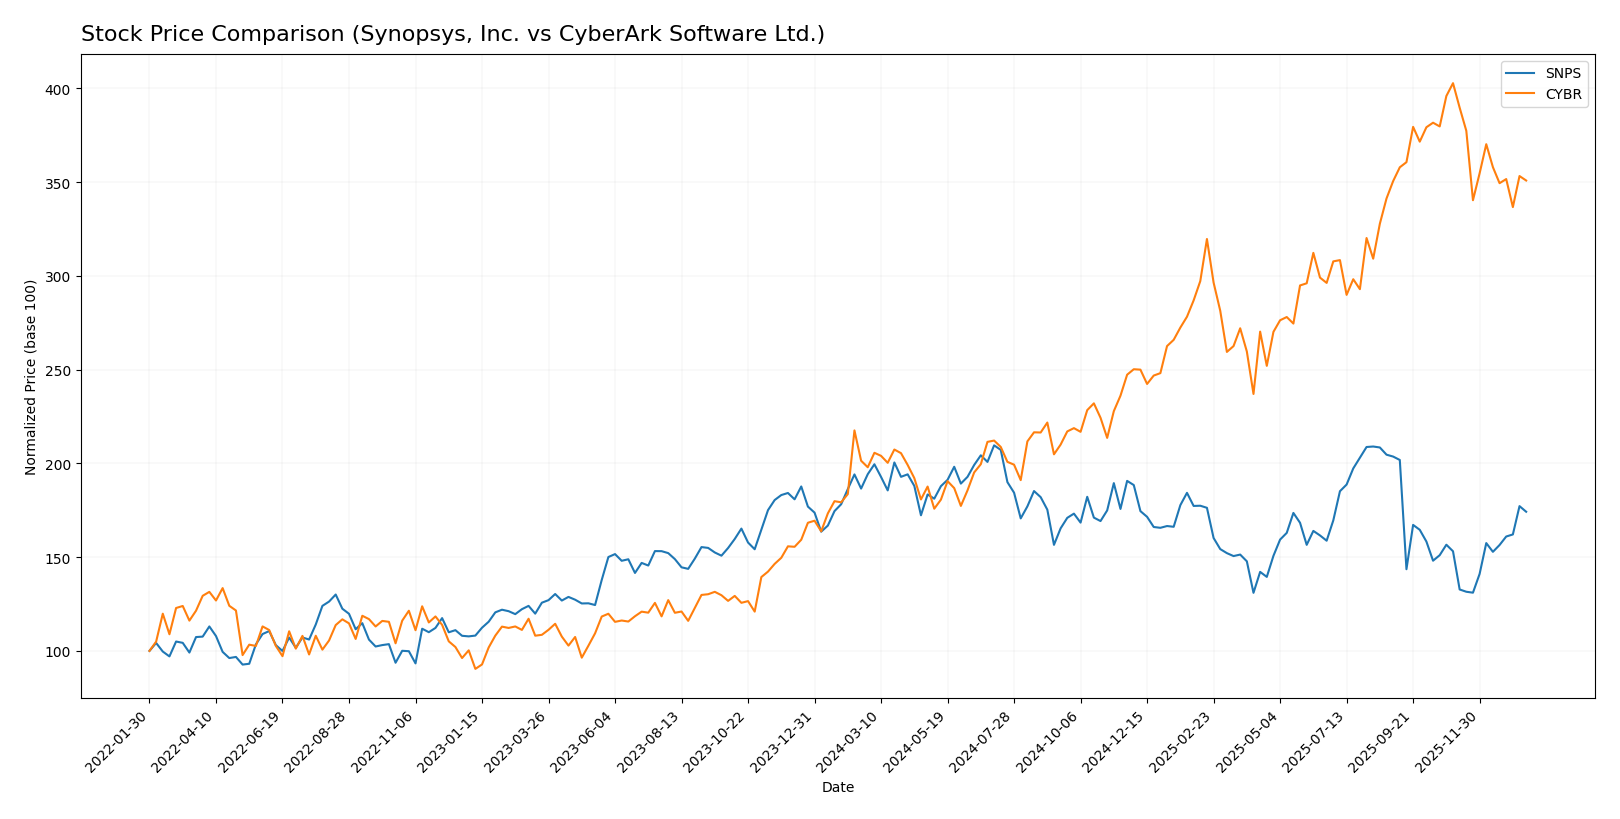
The chart illustrates a divergent trajectory over the past year with Synopsys, Inc. (SNPS) experiencing a bearish trend marked by an accelerating decline, while CyberArk Software Ltd. (CYBR) shows a strong bullish trend despite recent deceleration and volatility.
Trend Analysis
Synopsys, Inc. (SNPS) has undergone a 10.31% price decline over the last 12 months, indicating a bearish trend with accelerating downward momentum. The stock fluctuated between 388.13 and 621.3, exhibiting substantial volatility (std deviation 58.85).
CyberArk Software Ltd. (CYBR) recorded a 77.27% price increase during the same period, reflecting a bullish trend with decelerating growth. Its price ranged from 227.32 to 520.78 with higher volatility (std deviation 82.45).
Comparatively, CyberArk delivered the highest market performance, outperforming Synopsys by a significant margin in the 12-month period analyzed.
Target Prices
The current analyst consensus shows optimistic target prices for both Synopsys, Inc. and CyberArk Software Ltd.
| Company | Target High | Target Low | Consensus |
|---|---|---|---|
| Synopsys, Inc. | 600 | 425 | 530 |
| CyberArk Software Ltd. | 520 | 440 | 479.22 |
Analysts expect Synopsys shares to rise slightly above the current price of $516.31, while CyberArk’s consensus target price of $479.22 suggests a modest upside from the current $453.65. These targets indicate generally positive sentiment with moderate growth potential.
Analyst Opinions Comparison
This section compares analysts’ ratings and grades for Synopsys, Inc. and CyberArk Software Ltd.:
Rating Comparison
SNPS Rating
- Overall rating is B- with a very favorable status from analysts.
- Discounted Cash Flow Score is 3, indicating a moderate valuation based on future cash flows.
- Return on Equity Score is 3, reflecting moderate efficiency in generating profit from equity.
- Return on Assets Score is 3, showing moderate effectiveness in asset utilization.
- Debt To Equity Score is 2, representing moderate financial risk and balance sheet strength.
- Overall Score is 3, conveying a moderate overall financial standing.
CYBR Rating
- Overall rating is C- with a very favorable status from analysts.
- Discounted Cash Flow Score is also 3, showing a moderate valuation similarly.
- Return on Equity Score is 1, signaling very unfavorable efficiency in profit generation from equity.
- Return on Assets Score is 1, indicating very unfavorable asset utilization.
- Debt To Equity Score is 2, also reflecting moderate financial risk and balance sheet strength.
- Overall Score is 1, indicating a very unfavorable overall financial standing.
Which one is the best rated?
Based strictly on the provided data, Synopsys holds a higher overall rating (B-) and better scores in ROE, ROA, and overall financial standing compared to CyberArk’s C- rating and weaker scores. Both share moderate DCF and debt-to-equity scores.
Scores Comparison
Here is the comparison of the Altman Z-Score and Piotroski Score for Synopsys and CyberArk:
Synopsys Scores
- Altman Z-Score: 3.54, indicating a safe zone with low bankruptcy risk.
- Piotroski Score: 4, classified as average financial strength.
CyberArk Scores
- Altman Z-Score: 6.52, indicating a safe zone with very low bankruptcy risk.
- Piotroski Score: 3, classified as very weak financial strength.
Which company has the best scores?
CyberArk has a higher Altman Z-Score, suggesting stronger bankruptcy safety, but Synopsys shows a better Piotroski Score, indicating relatively stronger financial health. Overall, each excels in different score categories.
Grades Comparison
The comparison of grades from multiple reputable grading companies for Synopsys, Inc. and CyberArk Software Ltd. is as follows:
Synopsys, Inc. Grades
This table summarizes recent grade changes and maintenance by recognized grading firms for Synopsys, Inc.:
| Grading Company | Action | New Grade | Date |
|---|---|---|---|
| Piper Sandler | Downgrade | Neutral | 2026-01-13 |
| Morgan Stanley | Maintain | Overweight | 2025-12-12 |
| Rosenblatt | Maintain | Buy | 2025-12-11 |
| Keybanc | Maintain | Overweight | 2025-12-11 |
| Piper Sandler | Maintain | Overweight | 2025-12-11 |
| Needham | Maintain | Buy | 2025-12-11 |
| B of A Securities | Upgrade | Buy | 2025-12-11 |
| JP Morgan | Maintain | Overweight | 2025-12-11 |
| Wells Fargo | Maintain | Equal Weight | 2025-12-11 |
| Rosenblatt | Upgrade | Buy | 2025-12-09 |
Synopsys shows mostly stable or upgraded grades with a recent slight downgrade by Piper Sandler, reflecting a generally positive consensus.
CyberArk Software Ltd. Grades
This table presents consistent grades maintained by respected analysts for CyberArk Software Ltd.:
| Grading Company | Action | New Grade | Date |
|---|---|---|---|
| Oppenheimer | Maintain | Outperform | 2024-10-22 |
| Keybanc | Maintain | Overweight | 2024-10-18 |
| Mizuho | Maintain | Outperform | 2024-10-17 |
| BTIG | Maintain | Buy | 2024-10-09 |
| Barclays | Maintain | Overweight | 2024-10-07 |
| Wedbush | Maintain | Outperform | 2024-10-01 |
| Jefferies | Maintain | Buy | 2024-09-24 |
| DA Davidson | Maintain | Buy | 2024-08-09 |
| Rosenblatt | Maintain | Buy | 2024-08-09 |
| Susquehanna | Maintain | Positive | 2024-08-09 |
CyberArk’s grades are uniformly positive with no recent changes, indicating strong and consistent analyst confidence.
Which company has the best grades?
Both Synopsys and CyberArk hold a consensus “Buy” rating, but CyberArk displays a higher proportion of “Outperform” and “Buy” grades without recent downgrades, suggesting stronger analyst endorsement. This could influence investor perception of relative growth potential and risk profiles.
Strengths and Weaknesses
Below is a comparison table highlighting the key strengths and weaknesses of Synopsys, Inc. (SNPS) and CyberArk Software Ltd. (CYBR) based on recent financial and operational data.
| Criterion | Synopsys, Inc. (SNPS) | CyberArk Software Ltd. (CYBR) |
|---|---|---|
| Diversification | Strong revenue streams from License & Maintenance (3.49B) and Technology Services (1.55B) | Revenue spread across SaaS (469M), Self Hosted Subscription (265M), and Maintenance (197M) |
| Profitability | Positive net margin (18.96%), but declining ROIC (1.97%) below WACC (8.3%) | Negative net margin (-9.34%) and negative ROIC (-2.85%) below WACC (8.15%) |
| Innovation | Moderate asset turnover (0.15) but strong fixed asset turnover (5.04) indicates efficient use of technology assets | High fixed asset turnover (51.11) shows operational efficiency, but negative profitability signals risk |
| Global presence | Well-established global player in electronic design automation | Growing global footprint with focus on cybersecurity SaaS and subscriptions |
| Market Share | Significant market share in semiconductor design tools | Niche cybersecurity market with expanding SaaS offerings but limited scale compared to peers |
In summary, Synopsys benefits from diversified, high-value revenue streams and solid profitability metrics but struggles with declining capital efficiency and value creation. CyberArk shows operational efficiency and SaaS growth potential but faces challenges in profitability and value destruction. Investors should weigh these factors carefully, considering risk tolerance and market dynamics.
Risk Analysis
Below is a comparative risk overview for Synopsys, Inc. (SNPS) and CyberArk Software Ltd. (CYBR) based on the most recent available data:
| Metric | Synopsys, Inc. (SNPS) | CyberArk Software Ltd. (CYBR) |
|---|---|---|
| Market Risk | Moderate beta (1.12), sensitive to tech market swings | Lower beta (0.92), less volatile but still exposed to tech sector risks |
| Debt level | Moderate debt-to-equity (0.5), manageable leverage | Very low debt-to-equity (0.01), strong balance sheet |
| Regulatory Risk | Moderate, US-based with global operations | Moderate, Israeli-based with exposure to international regulations |
| Operational Risk | Complexity in diverse product lines and services | Focused on cybersecurity, operational risks tied to innovation pace |
| Environmental Risk | Low, primarily software company with minimal direct environmental impact | Low, similar software industry profile |
| Geopolitical Risk | Moderate, global supply chains and US-China tech tensions | Elevated, Israeli base and international sales expose it to geopolitical uncertainties |
Synopsys faces moderate market and operational risks due to its wide product range and tech market exposure, but maintains manageable debt and solid liquidity. CyberArk exhibits very low financial leverage but suffers from weak profitability and higher geopolitical risk, reflecting its Israeli headquarters and international footprint. The most impactful risks for investors are Synopsys’s market sensitivity and CyberArk’s operational challenges combined with geopolitical exposure.
Which Stock to Choose?
Synopsys, Inc. (SNPS) has shown favorable income growth over 2021-2025, with a 67.79% revenue increase and a solid 18.89% net margin in 2025. Its financial ratios are mixed, with strengths in liquidity and debt management but weaknesses in ROE and P/E. Profitability remains moderate, debt levels are controlled, and it holds a very favorable B- rating.
CyberArk Software Ltd. (CYBR) experienced a strong 33.1% revenue growth in 2024 but suffers from negative profitability indicators, including a -9.34% net margin and declining returns. Its financial ratios reveal several unfavorable metrics, though it benefits from low debt and a very favorable C- rating, despite weak overall financial health.
For investors prioritizing stable income growth and balanced financial metrics, Synopsys might appear more favorable due to its consistent profitability and moderate leverage. Conversely, those willing to accept higher risk for potential growth could see CyberArk’s rapid revenue expansion and strong rating as suggestive of future opportunity, albeit with caution due to its value destruction trends.
Disclaimer: Investment carries a risk of loss of initial capital. The past performance is not a reliable indicator of future results. Be sure to understand risks before making an investment decision.
Go Further
I encourage you to read the complete analyses of Synopsys, Inc. and CyberArk Software Ltd. to enhance your investment decisions: