In the dynamic world of technology, CyberArk Software Ltd. and StoneCo Ltd. stand out as prominent players in the software infrastructure sector. CyberArk focuses on cybersecurity solutions, while StoneCo excels in financial technology for electronic commerce in Brazil. Their overlapping market presence and innovative approaches make them intriguing contenders. This article will explore which company offers the most compelling investment opportunity for your portfolio.

Table of contents
Companies Overview
I will begin the comparison between CyberArk Software Ltd. and StoneCo Ltd. by providing an overview of these two companies and their main differences.
CyberArk Overview
CyberArk Software Ltd. focuses on developing and marketing software-based security solutions globally, including privileged access management and identity services. Positioned in the technology sector, it serves diverse industries such as financial services, healthcare, retail, and government agencies. Founded in 1999 and headquartered in Israel, CyberArk emphasizes risk-based credential security and cloud environment privilege management.
StoneCo Overview
StoneCo Ltd. operates in the financial technology sector, providing electronic commerce solutions primarily to merchants and integrated partners in Brazil. It serves over 1.7M clients, mainly small and medium businesses, through proprietary Stone Hubs and direct sales teams. Founded in 2000 and based in the Cayman Islands, StoneCo focuses on enabling transactions across in-store, online, and mobile channels as a subsidiary of HR Holdings, LLC.
Key similarities and differences
Both CyberArk and StoneCo belong to the technology sector and offer software infrastructure solutions, but their business models differ significantly. CyberArk specializes in cybersecurity and identity management services across various industries worldwide, while StoneCo concentrates on fintech payment solutions tailored to the Brazilian market. Their client bases, geographic focuses, and product offerings reflect distinct operational strategies.
Income Statement Comparison
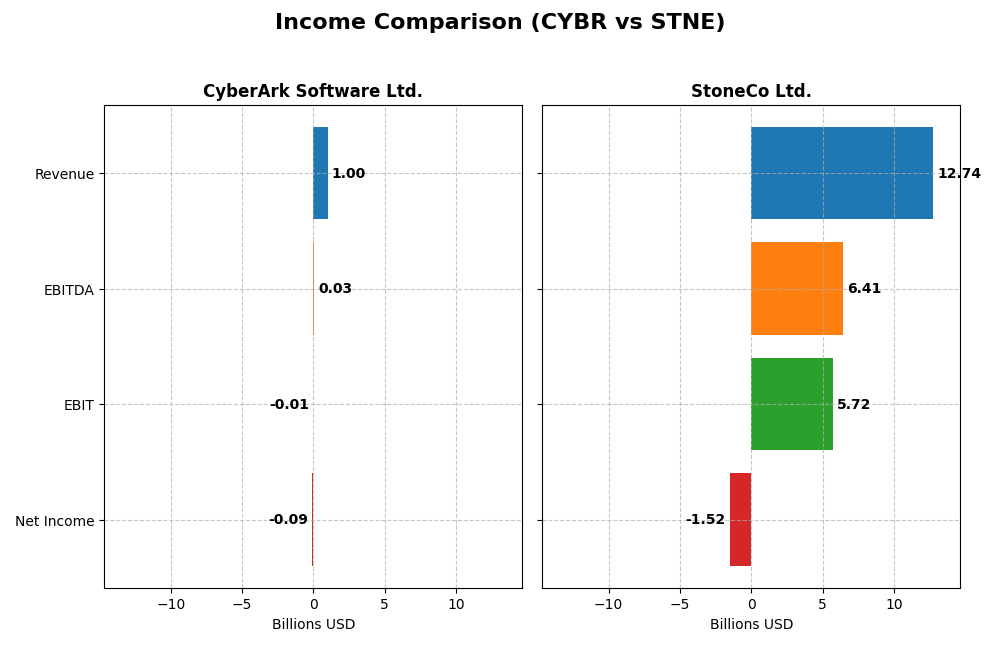
This table presents a side-by-side comparison of key income statement metrics for CyberArk Software Ltd. and StoneCo Ltd. for the fiscal year 2024, highlighting their financial scale and profitability.
| Metric | CyberArk Software Ltd. (CYBR) | StoneCo Ltd. (STNE) |
|---|---|---|
| Market Cap | 22.9B USD | 3.9B USD |
| Revenue | 1.00B USD | 12.7B BRL |
| EBITDA | 29M USD | 6.41B BRL |
| EBIT | -13M USD | 5.72B BRL |
| Net Income | -93M USD | -1.52B BRL |
| EPS | -2.12 USD | -5.02 BRL |
| Fiscal Year | 2024 | 2024 |
Income Statement Interpretations
CyberArk Software Ltd.
CyberArk’s revenue showed a strong upward trend, rising 115.48% from 2020 to 2024, with a 33.1% increase in the latest year. Gross margins remained robust around 79%, indicating stable core profitability. However, net income consistently remained negative, with a worsening net margin of -9.34% in 2024. Despite improved EBIT growth of 78.17%, the company reported a net income loss of $-93M in 2024, reflecting ongoing profitability challenges.
StoneCo Ltd.
StoneCo experienced significant revenue growth of 302.29% over five years, with a 12.1% increase in 2024 to BRL 12.7B. Gross margin held steady at 73.4%, while EBIT margin was strong and positive at 44.86%. Net income, however, was negative for 2024 at BRL -1.52B, with a declining net margin of -11.89%. Despite these losses, StoneCo’s operating profits and revenue growth remain favorable, though net margin contraction persists.
Which one has the stronger fundamentals?
Both companies demonstrate strong revenue growth and favorable gross margins, yet neither achieved positive net income in 2024. CyberArk shows a higher gross margin but consistent net losses and negative EPS growth. StoneCo presents a positive EBIT margin and large revenue base, but net losses and high interest expense temper its results. Overall, both companies face profitability headwinds despite top-line strength, signaling cautious fundamentals.
Financial Ratios Comparison
The table below presents a side-by-side comparison of key financial ratios for CyberArk Software Ltd. (CYBR) and StoneCo Ltd. (STNE) based on their most recent fiscal year data from 2024.
| Ratios | CyberArk Software Ltd. (CYBR) | StoneCo Ltd. (STNE) |
|---|---|---|
| ROE | -3.94% | -12.87% |
| ROIC | -2.85% | 22.41% |
| P/E | -157.49 | -9.84 |
| P/B | 6.21 | 1.27 |
| Current Ratio | 1.48 | 1.37 |
| Quick Ratio | 1.48 | 1.37 |
| D/E | 0.01 | 1.10 |
| Debt-to-Assets | 0.88% | 23.53% |
| Interest Coverage | -17.90 | 5.57 |
| Asset Turnover | 0.30 | 0.23 |
| Fixed Asset Turnover | 51.11 | 6.95 |
| Payout ratio | 0 | 0 |
| Dividend yield | 0 | 0 |
Interpretation of the Ratios
CyberArk Software Ltd.
CyberArk’s financial ratios present a mixed picture with 35.7% favorable and 50% unfavorable metrics, resulting in a slightly unfavorable overall evaluation. Key concerns include negative net margin (-9.34%), return on equity (-3.94%), and return on invested capital (-2.85%). The company maintains a low debt level and strong quick ratio, but interest coverage is negative. CyberArk does not pay dividends, likely due to ongoing losses and reinvestment focus.
StoneCo Ltd.
StoneCo shows a slightly favorable ratio profile with 50% favorable and 42.9% unfavorable ratios. Notable strengths include a positive return on invested capital (22.41%), favorable price-to-book (1.27), and strong interest coverage (5.41). Weaknesses include negative net margin (-11.89%) and return on equity (-12.87%), alongside a relatively high debt-to-equity ratio (1.1). StoneCo also does not pay dividends, probably reflecting reinvestment in growth and operational scaling.
Which one has the best ratios?
StoneCo exhibits a more favorable overall ratio assessment compared to CyberArk, supported by stronger returns on invested capital, interest coverage, and price-to-book metrics. However, both companies face profitability challenges with negative margins and returns on equity. CyberArk’s lower leverage contrasts with StoneCo’s higher debt, reflecting differing financial strategies amid operational pressures.
Strategic Positioning
This section compares the strategic positioning of CyberArk and StoneCo, focusing on Market position, Key segments, and Exposure to technological disruption:
CyberArk Software Ltd.
- Established software security leader with global presence; faces competitive pressure in cybersecurity market.
- Key segments include SaaS, self-hosted subscriptions, maintenance, and professional services across industries.
- Operates in a technology-driven sector with evolving cybersecurity threats requiring constant innovation.
StoneCo Ltd.
- Fintech provider focused on Brazilian merchants; competes in electronic commerce payment solutions.
- Serves mainly small-medium businesses with payment solutions through proprietary Stone Hubs and digital channels.
- Exposed to fintech innovations and digital payment disruptions in Brazil’s rapidly evolving market.
CyberArk vs StoneCo Positioning
CyberArk has a diversified revenue base across multiple security software segments and global markets, while StoneCo concentrates on fintech solutions for Brazilian merchants, focusing on hyper-local sales and digital commerce. CyberArk’s broader industry reach contrasts with StoneCo’s regional specialization.
Which has the best competitive advantage?
StoneCo shows a very favorable MOAT with growing ROIC and efficient capital use, indicating a durable competitive advantage. CyberArk’s declining ROIC and value destruction suggest weaker competitive positioning over 2020-2024.
Stock Comparison
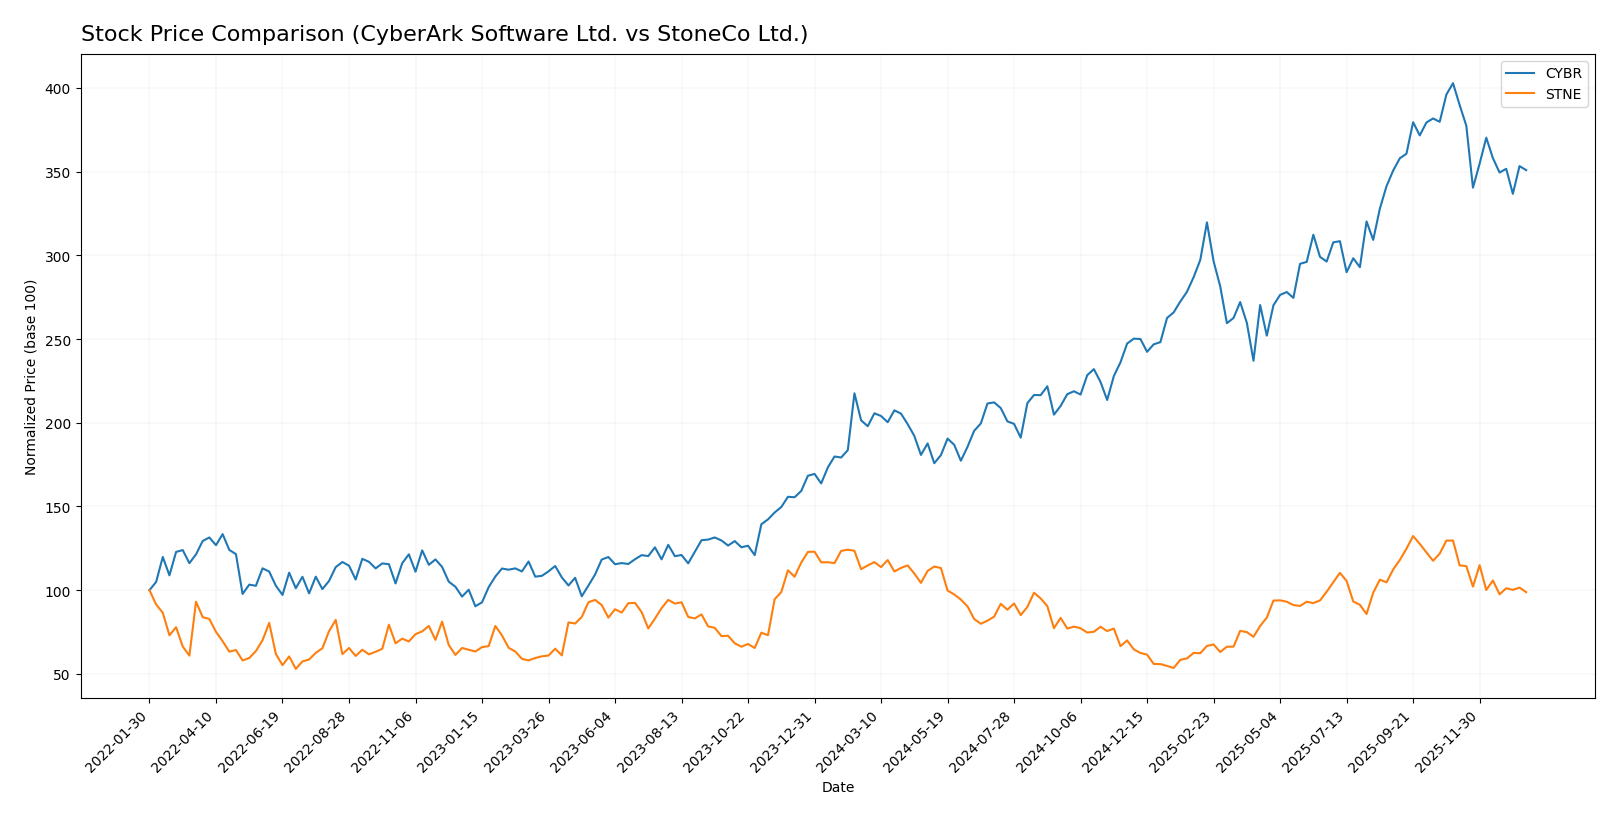
The stock price movements of CyberArk Software Ltd. and StoneCo Ltd. over the past year reveal contrasting trends, with CyberArk showing significant gains and StoneCo experiencing a decline, both exhibiting decelerating momentum.
Trend Analysis
CyberArk Software Ltd. recorded a 77.27% price increase over the past 12 months, indicating a bullish trend with decelerating acceleration. The stock peaked at 520.78 and hit a low of 227.32, showing high volatility with an 82.45 std deviation.
StoneCo Ltd. showed a bearish trend with a 13.9% price decline over the same period. The trend also decelerated, with the highest price reaching 19.4 and the lowest at 7.85, accompanied by low volatility and a 2.92 std deviation.
Comparing these stocks reveals CyberArk delivered the highest market performance over the past year, contrasting StoneCo’s downward trajectory.
Target Prices
The current analyst consensus indicates a moderate upside potential for CyberArk Software Ltd. and a stable outlook for StoneCo Ltd.
| Company | Target High | Target Low | Consensus |
|---|---|---|---|
| CyberArk Software Ltd. | 520 | 440 | 479.22 |
| StoneCo Ltd. | 20 | 20 | 20 |
Analysts expect CyberArk’s stock to trade modestly above its current price of 453.65 USD, suggesting cautious optimism. StoneCo’s target prices indicate a stable valuation well above its current 14.49 USD price, implying potential upside.
Analyst Opinions Comparison
This section compares analysts’ ratings and grades for CyberArk Software Ltd. and StoneCo Ltd.:
Rating Comparison
CyberArk Software Ltd. Rating
- Rating: C- with a very favorable evaluation
- Discounted Cash Flow Score: 3, indicating moderate valuation
- ROE Score: 1, very unfavorable for efficient profit generation
- ROA Score: 1, very unfavorable asset utilization
- Debt To Equity Score: 2, moderate financial risk
- Overall Score: 1, very unfavorable financial standing
StoneCo Ltd. Rating
- Rating: C with a very favorable evaluation
- Discounted Cash Flow Score: 3, indicating moderate valuation
- ROE Score: 1, very unfavorable for efficient profit generation
- ROA Score: 1, very unfavorable asset utilization
- Debt To Equity Score: 1, very unfavorable financial risk
- Overall Score: 2, moderate financial standing
Which one is the best rated?
StoneCo Ltd. holds a higher overall score (2 vs. 1) and a slightly lower rating grade (C vs. C-), indicating it is better rated overall. However, StoneCo’s debt-to-equity score is worse, reflecting higher financial risk compared to CyberArk.
Scores Comparison
Here is a comparison of the key financial scores for CyberArk Software Ltd. and StoneCo Ltd.:
CyberArk Scores
- Altman Z-Score: 6.52, indicating a safe zone status.
- Piotroski Score: 3, categorized as very weak financial strength.
StoneCo Scores
- Altman Z-Score: 1.02, indicating a distress zone.
- Piotroski Score: 5, categorized as average financial strength.
Which company has the best scores?
Based on the provided data, CyberArk has a significantly better Altman Z-Score, indicating lower bankruptcy risk, but StoneCo has a higher Piotroski Score, showing stronger financial health. Each company leads in one key metric.
Grades Comparison
Here is a detailed comparison of the recent grades given to CyberArk Software Ltd. and StoneCo Ltd.:
CyberArk Software Ltd. Grades
The following table summarizes recent grades assigned by reputable grading companies to CyberArk Software Ltd.:
| Grading Company | Action | New Grade | Date |
|---|---|---|---|
| Oppenheimer | Maintain | Outperform | 2024-10-22 |
| Keybanc | Maintain | Overweight | 2024-10-18 |
| Mizuho | Maintain | Outperform | 2024-10-17 |
| BTIG | Maintain | Buy | 2024-10-09 |
| Barclays | Maintain | Overweight | 2024-10-07 |
| Wedbush | Maintain | Outperform | 2024-10-01 |
| Jefferies | Maintain | Buy | 2024-09-24 |
| DA Davidson | Maintain | Buy | 2024-08-09 |
| Rosenblatt | Maintain | Buy | 2024-08-09 |
| Susquehanna | Maintain | Positive | 2024-08-09 |
Overall, the grades for CyberArk Software Ltd. consistently indicate strong positive sentiment, with most ratings at Buy, Outperform, or Overweight.
StoneCo Ltd. Grades
The following table summarizes recent grades assigned by reputable grading companies to StoneCo Ltd.:
| Grading Company | Action | New Grade | Date |
|---|---|---|---|
| Goldman Sachs | Maintain | Buy | 2025-10-14 |
| B of A Securities | Maintain | Buy | 2025-09-09 |
| UBS | Maintain | Buy | 2025-08-29 |
| JP Morgan | Maintain | Overweight | 2025-07-16 |
| Barclays | Maintain | Equal Weight | 2025-05-12 |
| Barclays | Maintain | Equal Weight | 2025-04-23 |
| Citigroup | Upgrade | Buy | 2025-04-22 |
| Barclays | Maintain | Equal Weight | 2025-03-21 |
| Morgan Stanley | Maintain | Underweight | 2025-03-21 |
| Goldman Sachs | Maintain | Buy | 2025-02-06 |
The grades for StoneCo Ltd. show a generally positive outlook with several Buy ratings, but also include some Equal Weight and one Underweight, indicating a more mixed consensus.
Which company has the best grades?
CyberArk Software Ltd. has received consistently higher and more uniform grades, mostly Buy and Outperform, compared to StoneCo Ltd., which shows a more varied range including Equal Weight and Underweight. This suggests CyberArk is viewed more favorably by analysts, potentially implying stronger confidence from the investment community.
Strengths and Weaknesses
Below is a comparison of key strengths and weaknesses for CyberArk Software Ltd. (CYBR) and StoneCo Ltd. (STNE) based on their recent financial performance and market positioning.
| Criterion | CyberArk Software Ltd. (CYBR) | StoneCo Ltd. (STNE) |
|---|---|---|
| Diversification | Moderate; revenue split between SaaS (469M), Self-Hosted Subscription (265M), and Maintenance (197M) | Limited data; primarily focused on digital payment solutions in Brazil |
| Profitability | Negative net margin (-9.34%), negative ROE (-3.94%), ROIC below WACC (-2.85%) indicating value destruction | Negative net margin (-11.89%) and ROE (-12.87%), but strong ROIC (22.41%) above WACC shows value creation |
| Innovation | High, with strong SaaS growth from 166M (2022) to 469M (2024) | Moderate; growing ROIC suggests operational improvements, but innovation pace unclear |
| Global presence | Strong global footprint in cybersecurity sector | Mainly Brazil-focused fintech company |
| Market Share | Leading in privileged access management niche | Significant player in Brazilian payment processing market |
Key takeaways: StoneCo shows a durable competitive advantage with growing profitability despite current losses, while CyberArk struggles with declining returns and value destruction. Investors should weigh StoneCo’s growth potential against CyberArk’s challenges in profitability and capital efficiency.
Risk Analysis
Below is a comparative table highlighting key risks for CyberArk Software Ltd. (CYBR) and StoneCo Ltd. (STNE) based on the most recent 2024 data:
| Metric | CyberArk Software Ltd. (CYBR) | StoneCo Ltd. (STNE) |
|---|---|---|
| Market Risk | Beta 0.915 (moderate volatility) | Beta 1.835 (high volatility) |
| Debt level | Very low debt-to-equity 0.01 (favorable) | High debt-to-equity 1.1 (unfavorable) |
| Regulatory Risk | Moderate (operates globally with some regulatory complexity) | Elevated (Brazilian fintech sector with evolving regulations) |
| Operational Risk | Moderate (software infrastructure, security risks) | Moderate to high (payment processing, tech platform risks) |
| Environmental Risk | Low (technology sector, limited direct impact) | Low (financial tech, limited direct impact) |
| Geopolitical Risk | Medium (based in Israel, global sales exposure) | High (headquartered in Cayman Islands, operates mainly in Brazil with political and economic instability) |
The most impactful risks are StoneCo’s high market volatility and significant debt, raising financial vulnerability, along with heightened geopolitical and regulatory risks tied to the Brazilian market. CyberArk benefits from low debt but faces operational and geopolitical risks due to its global software security business. Investors should weigh StoneCo’s distress zone Altman Z-Score and CyberArk’s weak profitability indicators carefully before investing.
Which Stock to Choose?
CyberArk Software Ltd. (CYBR) shows strong revenue growth of 33.1% in 2024, but profitability remains negative with a -9.34% net margin and declining returns on equity and invested capital. Debt levels are low, and the rating is very favorable, despite some unfavorable financial ratios.
StoneCo Ltd. (STNE) presents moderate revenue growth of 12.1% in 2024 and a positive EBIT margin of 44.86%, though net margin is negative at -11.89%. The company creates value with a favorable ROIC above WACC and a very favorable rating, but carries higher debt and exhibits mixed financial ratio results.
For risk-tolerant investors seeking growth, CYBR’s expanding top line and low debt might appear attractive despite profitability challenges. Conversely, STNE’s value creation and stronger profitability metrics could be more appealing to investors prioritizing quality and financial durability.
Disclaimer: Investment carries a risk of loss of initial capital. The past performance is not a reliable indicator of future results. Be sure to understand risks before making an investment decision.
Go Further
I encourage you to read the complete analyses of CyberArk Software Ltd. and StoneCo Ltd. to enhance your investment decisions: