In today’s fast-evolving cybersecurity landscape, choosing the right investment requires a clear understanding of key players. Palo Alto Networks, Inc. (PANW) and CyberArk Software Ltd. (CYBR) both operate in the software infrastructure industry, focusing on innovative security solutions to protect enterprises worldwide. Their overlapping market presence and distinct approaches to innovation make this comparison essential. Join me as we explore which company offers the most compelling opportunity for your portfolio.

Table of contents
Companies Overview
I will begin the comparison between Palo Alto Networks, Inc. and CyberArk Software Ltd. by providing an overview of these two companies and their main differences.
Palo Alto Networks Overview
Palo Alto Networks, Inc. specializes in cybersecurity solutions, offering firewall appliances, software, and cloud security services. The company provides a broad range of subscription services including threat prevention, malware protection, and security analytics. Founded in 2005 and based in Santa Clara, California, it serves medium to large enterprises and government entities across various industries worldwide.
CyberArk Software Overview
CyberArk Software Ltd. focuses on software-based security solutions, particularly privileged access management and identity access services. It delivers SaaS products that secure credentials, endpoint privileges, and cloud entitlements. Founded in 1999 and headquartered in Petah Tikva, Israel, CyberArk markets its products globally to sectors such as financial services, healthcare, and government agencies through a diverse sales network.
Key similarities and differences
Both companies operate in the software infrastructure industry with a focus on cybersecurity, targeting enterprise clients globally. Palo Alto Networks offers a wider range of firewall and cloud security solutions, while CyberArk emphasizes privileged access and identity management software. Additionally, Palo Alto Networks is larger with over 15K employees compared to CyberArk’s 3.7K, reflecting differences in scale and product breadth.
Income Statement Comparison
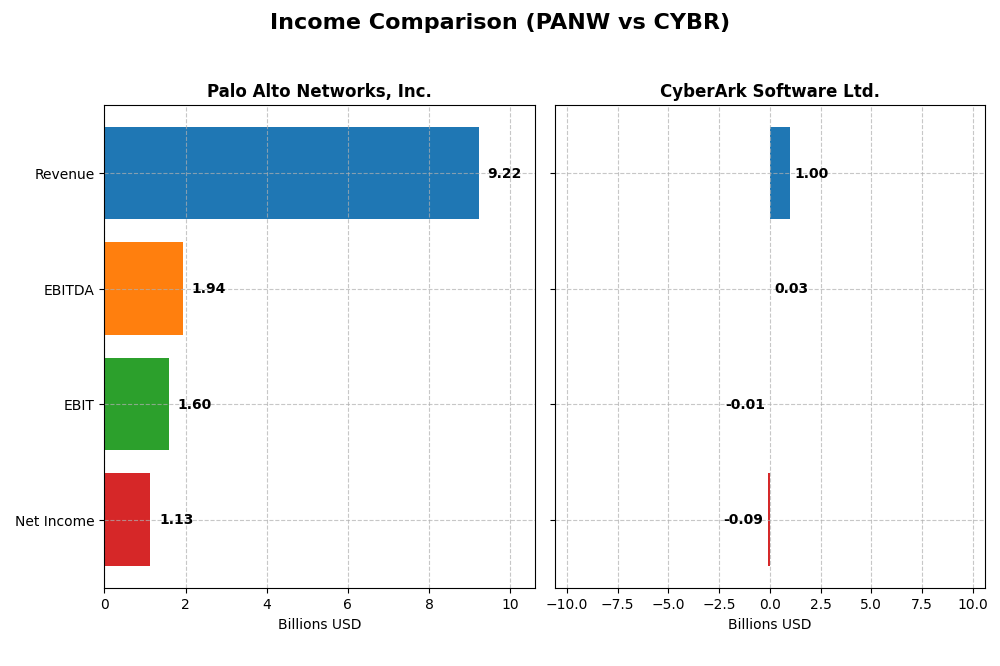
The table below compares the most recent fiscal year income statement metrics for Palo Alto Networks, Inc. and CyberArk Software Ltd.
| Metric | Palo Alto Networks, Inc. | CyberArk Software Ltd. |
|---|---|---|
| Market Cap | 128.4B | 22.9B |
| Revenue | 9.22B | 1.00B |
| EBITDA | 1.94B | 28.7M |
| EBIT | 1.60B | -13.3M |
| Net Income | 1.13B | -93.5M |
| EPS | 1.71 | -2.12 |
| Fiscal Year | 2025 | 2024 |
Income Statement Interpretations
Palo Alto Networks, Inc.
Palo Alto Networks exhibited strong revenue and net income growth from 2021 to 2025, with revenue more than doubling to $9.22B and net income surging by over 300%. Margins remained robust, with a gross margin at 73.41% and EBIT margin at 17.32% in 2025. The latest year showed favorable revenue and EBIT growth, though net margin and EPS declined, signaling some pressure on profitability.
CyberArk Software Ltd.
CyberArk’s revenue increased steadily from $464M in 2020 to over $1B in 2024, reflecting a 33.1% rise in the last year. However, the company reported negative net income and EBIT margins, with a net margin of -9.34% in 2024. Despite strong top-line growth and improving EBIT, net income and EPS trends remain unfavorable, indicating ongoing challenges in profitability.
Which one has the stronger fundamentals?
Palo Alto Networks demonstrates stronger fundamentals with favorable growth in revenue, net income, and margins across the period, supported by high gross and EBIT margins. In contrast, CyberArk shows solid revenue growth but persistent net losses and negative margins, resulting in a balanced but less favorable overall income statement evaluation.
Financial Ratios Comparison
This table presents the most recent key financial ratios for Palo Alto Networks, Inc. (PANW) and CyberArk Software Ltd. (CYBR), allowing a straightforward side-by-side comparison.
| Ratios | Palo Alto Networks, Inc. (2025 FY) | CyberArk Software Ltd. (2024 FY) |
|---|---|---|
| ROE | 14.49% | -3.94% |
| ROIC | 5.17% | -2.85% |
| P/E | 101.4 | -157.5 |
| P/B | 14.70 | 6.21 |
| Current Ratio | 0.89 | 1.48 |
| Quick Ratio | 0.89 | 1.48 |
| D/E | 0.04 | 0.01 |
| Debt-to-Assets | 1.43% | 0.88% |
| Interest Coverage | 414.3 | -17.9 |
| Asset Turnover | 0.39 | 0.30 |
| Fixed Asset Turnover | 12.56 | 51.11 |
| Payout ratio | 0% | 0% |
| Dividend yield | 0% | 0% |
Interpretation of the Ratios
Palo Alto Networks, Inc.
Palo Alto Networks shows a mixed profile with favorable net margin (12.3%) and strong interest coverage (532.53), but weak liquidity indicated by a current ratio below 1 at 0.89. High valuation multiples such as a PE of 101.43 and PB of 14.7 suggest market optimism but raise caution. The company does not pay dividends, likely reinvesting earnings into growth and R&D.
CyberArk Software Ltd.
CyberArk’s ratios reveal challenges with negative net margin (-9.34%), negative ROE (-3.94%), and poor interest coverage at -3.27, reflecting financial strain. Conversely, its low debt levels (debt to assets 0.88%) and strong fixed asset turnover (51.11) are favorable. CyberArk also does not pay dividends, possibly prioritizing reinvestment and product development amid losses.
Which one has the best ratios?
Palo Alto Networks has a slightly favorable overall ratio profile, benefiting from profitability and solvency strengths, despite valuation and liquidity concerns. CyberArk’s ratios are slightly unfavorable, hindered by consistent losses and weak profitability metrics. Overall, Palo Alto Networks presents a more balanced and stronger ratio set relative to CyberArk.
Strategic Positioning
This section compares the strategic positioning of Palo Alto Networks, Inc. and CyberArk Software Ltd., including market position, key segments, and exposure to technological disruption:
Palo Alto Networks, Inc.
- Leading cybersecurity provider with large market cap facing competitive pressure in infrastructure software
- Diverse revenue streams: products, subscriptions, and support across broad industries and cloud security
- Invests in cloud security, threat intelligence, and automation to counter evolving cyber threats
CyberArk Software Ltd.
- Smaller market cap with focused cybersecurity niche facing competitive pressures in privileged access management
- Concentrated on privileged access, SaaS, and identity management serving multiple sectors globally
- Focuses on SaaS solutions, privileged access security, and cloud entitlement management to mitigate risks
Palo Alto Networks, Inc. vs CyberArk Software Ltd. Positioning
Palo Alto Networks pursues a diversified approach with a broad product portfolio and multiple industry targets, offering stability but increased complexity. CyberArk concentrates on niche privileged access and identity solutions, enabling specialization but limiting market breadth.
Which has the best competitive advantage?
Both companies currently shed value relative to their cost of capital, but Palo Alto Networks shows improving profitability trends, while CyberArk experiences declining returns, indicating a relatively weaker competitive advantage.
Stock Comparison
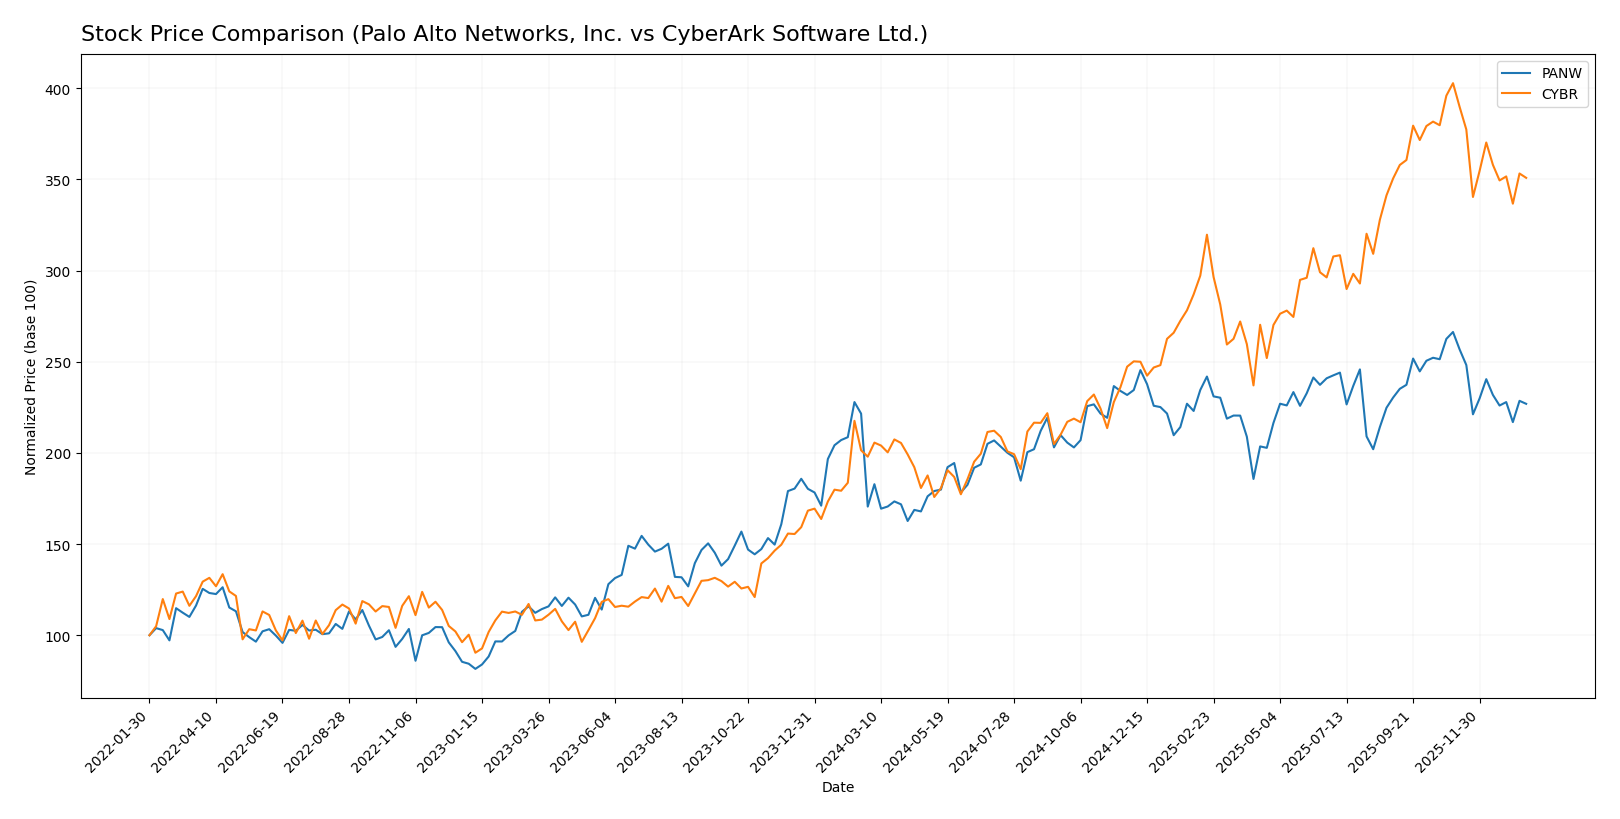
The stock price movements of Palo Alto Networks, Inc. (PANW) and CyberArk Software Ltd. (CYBR) over the past 12 months reveal significant bullish trends with notable deceleration, alongside recent short-term declines reflecting seller dominance.
Trend Analysis
Palo Alto Networks, Inc. (PANW) experienced a 33.05% price increase over the past year, indicating a bullish trend with deceleration. The stock ranged between 134.51 and 220.24, showing moderate volatility with an 19.95 std deviation.
CyberArk Software Ltd. (CYBR) delivered a stronger bullish trend, rising 77.27% in the same period but also showing deceleration. Its price fluctuated broadly from 227.32 to 520.78, accompanied by higher volatility at 82.45 std deviation.
Comparing both stocks, CYBR outperformed PANW in market performance over the past year, despite both facing recent short-term declines and bearish trading dynamics from November 2025 to January 2026.
Target Prices
The current analyst consensus presents a positive outlook for both Palo Alto Networks, Inc. and CyberArk Software Ltd.
| Company | Target High | Target Low | Consensus |
|---|---|---|---|
| Palo Alto Networks, Inc. | 265 | 157 | 231.07 |
| CyberArk Software Ltd. | 520 | 440 | 479.22 |
Analysts expect Palo Alto Networks’ stock to appreciate from its current price of about 188 USD to a consensus target near 231 USD. CyberArk’s consensus target of 479 USD suggests potential upside compared to its current price around 454 USD.
Analyst Opinions Comparison
This section compares analysts’ ratings and financial grades for Palo Alto Networks, Inc. and CyberArk Software Ltd.:
Rating Comparison
Palo Alto Networks, Inc. Rating
- Rating: B, indicating a very favorable assessment by analysts.
- Discounted Cash Flow Score: 4, considered favorable valuation.
- ROE Score: 4, showing strong profit generation from equity.
- ROA Score: 3, a moderate level of asset utilization effectiveness.
- Debt To Equity Score: 4, suggesting low financial risk.
- Overall Score: 3, a moderate overall financial standing.
CyberArk Software Ltd. Rating
- Rating: C-, also categorized as very favorable by analysts.
- Discounted Cash Flow Score: 3, indicating a moderate valuation.
- ROE Score: 1, reflecting very unfavorable profit efficiency.
- ROA Score: 1, indicating very unfavorable asset utilization.
- Debt To Equity Score: 2, a moderate level of financial risk.
- Overall Score: 1, indicating a very unfavorable overall standing.
Which one is the best rated?
Based on the provided data, Palo Alto Networks, Inc. holds better ratings and stronger financial scores across most categories compared to CyberArk Software Ltd., which shows notably lower scores in key profitability and asset utilization metrics.
Scores Comparison
Here is a comparison of the Altman Z-Score and Piotroski Score for Palo Alto Networks and CyberArk Software:
Palo Alto Networks Scores
- Altman Z-Score: 5.95, indicating a safe zone from bankruptcy risk.
- Piotroski Score: 6, reflecting average financial strength.
CyberArk Software Scores
- Altman Z-Score: 6.52, indicating a safe zone from bankruptcy risk.
- Piotroski Score: 3, indicating very weak financial strength.
Which company has the best scores?
CyberArk has a slightly higher Altman Z-Score, both in the safe zone, suggesting strong financial stability. Palo Alto Networks outperforms in Piotroski Score, showing better overall financial strength.
Grades Comparison
Here is a detailed comparison of the latest available grades from reputable grading companies for both companies:
Palo Alto Networks, Inc. Grades
This table summarizes recent grades and actions from reliable grading companies for Palo Alto Networks, Inc.:
| Grading Company | Action | New Grade | Date |
|---|---|---|---|
| UBS | Maintain | Neutral | 2026-01-13 |
| Piper Sandler | Maintain | Overweight | 2026-01-05 |
| Guggenheim | Upgrade | Neutral | 2026-01-05 |
| Morgan Stanley | Maintain | Overweight | 2025-12-18 |
| Goldman Sachs | Maintain | Buy | 2025-11-21 |
| HSBC | Downgrade | Reduce | 2025-11-21 |
| Needham | Maintain | Buy | 2025-11-20 |
| WestPark Capital | Maintain | Hold | 2025-11-20 |
| Bernstein | Maintain | Outperform | 2025-11-20 |
| DA Davidson | Maintain | Buy | 2025-11-20 |
Overall, Palo Alto Networks shows a mixed but generally positive trend in grades, with several buy and overweight ratings, although a downgrade to reduce by HSBC stands out.
CyberArk Software Ltd. Grades
This table summarizes recent grades and actions from reliable grading companies for CyberArk Software Ltd.:
| Grading Company | Action | New Grade | Date |
|---|---|---|---|
| Oppenheimer | Maintain | Outperform | 2024-10-22 |
| Keybanc | Maintain | Overweight | 2024-10-18 |
| Mizuho | Maintain | Outperform | 2024-10-17 |
| BTIG | Maintain | Buy | 2024-10-09 |
| Barclays | Maintain | Overweight | 2024-10-07 |
| Wedbush | Maintain | Outperform | 2024-10-01 |
| Jefferies | Maintain | Buy | 2024-09-24 |
| DA Davidson | Maintain | Buy | 2024-08-09 |
| Rosenblatt | Maintain | Buy | 2024-08-09 |
| Susquehanna | Maintain | Positive | 2024-08-09 |
CyberArk Software Ltd. consistently receives positive ratings, predominantly buy and outperform, with no downgrades reported in the sample.
Which company has the best grades?
Both Palo Alto Networks and CyberArk Software have a consensus “Buy” rating. However, CyberArk’s ratings are uniformly positive with multiple outperform and buy grades and no recent downgrades, suggesting a more consistently favorable outlook. Palo Alto Networks shows a broader range of opinions, including one notable downgrade, which could indicate higher perceived risk or uncertainty for investors.
Strengths and Weaknesses
Below is a comparative table summarizing the key strengths and weaknesses of Palo Alto Networks, Inc. (PANW) and CyberArk Software Ltd. (CYBR) based on the most recent financial and operational data available in 2026.
| Criterion | Palo Alto Networks, Inc. (PANW) | CyberArk Software Ltd. (CYBR) |
|---|---|---|
| Diversification | High: Strong subscription, product, and support revenue streams totaling over 9B USD in 2025 | Moderate: Mix of SaaS, self-hosted subscriptions, and licenses with growing SaaS segment (~470M USD in 2024) |
| Profitability | Moderate: Net margin 12.3%, ROIC 5.67%, but ROIC below WACC (7.37%) indicating slight value destruction | Weak: Negative net margin (-9.34%), negative ROIC (-2.85%), and ROIC well below WACC (8.15%), showing value erosion |
| Innovation | Strong: Significant growth in ROIC (+224%), robust product and subscription growth | Weak: Declining ROIC (-728%), struggling profitability, but high fixed asset turnover suggests operational agility |
| Global presence | Extensive: Large market share in cybersecurity with global subscription sales exceeding 4.9B USD | Moderate: Focused niche in privileged access management with SaaS expansion but smaller scale |
| Market Share | Large: Leading in network security and cybersecurity solutions | Niche: Specialist in privileged access and identity security within cybersecurity |
Key takeaways: Palo Alto Networks shows strong diversification and innovation with growing profitability metrics despite slightly unfavorable value creation. CyberArk faces significant challenges with declining profitability and value destruction, though it maintains a niche market presence and operational efficiency in fixed assets. Investors should weigh Palo Alto’s growth potential against CyberArk’s riskier profile.
Risk Analysis
Below is a comparative overview of key risks facing Palo Alto Networks, Inc. (PANW) and CyberArk Software Ltd. (CYBR) as of the most recent fiscal years.
| Metric | Palo Alto Networks, Inc. (PANW) | CyberArk Software Ltd. (CYBR) |
|---|---|---|
| Market Risk | Moderate (beta 0.75, stable tech sector exposure) | Moderate-High (beta 0.92, more volatile valuation) |
| Debt level | Low debt (Debt-to-Equity 0.04, favorable) | Very low debt (Debt-to-Equity 0.01, favorable) |
| Regulatory Risk | Moderate (US-based, subject to national cybersecurity regulations) | Moderate (Israeli-based, international compliance challenges) |
| Operational Risk | Moderate (large scale operations, complex product suite) | Moderate-High (smaller scale, but high reliance on niche products) |
| Environmental Risk | Low (software sector, minimal direct impact) | Low (software sector, minimal direct impact) |
| Geopolitical Risk | Moderate (global operations, US-China tensions possible) | Higher (Israel base, exposure to Middle East geopolitical tensions) |
The most impactful risks are the geopolitical exposure for CyberArk due to its location and international reach, and valuation-related market risk for both companies, especially given CyberArk’s unfavorable profitability ratios. Palo Alto Networks shows strong financial health with very low debt and a solid Altman Z-score, mitigating bankruptcy risk.
Which Stock to Choose?
Palo Alto Networks, Inc. (PANW) shows a favorable income evolution with 14.87% revenue growth in 2025, strong profitability metrics including a 12.3% net margin, and low debt levels. Its financial ratios are slightly favorable overall, supported by a robust rating of B and strong liquidity despite a current ratio below 1.
CyberArk Software Ltd. (CYBR) exhibits a mixed income profile with 33.1% revenue growth but negative net margin and profitability ratios. Financial ratios lean slightly unfavorable, reflecting challenges in return metrics and interest coverage, despite a very favorable overall rating of C- and a stronger current ratio above 1.4.
Considering ratings and overall financials, PANW might appear more favorable for investors seeking growth supported by improving profitability and solid ratings, while CYBR’s profile could be interpreted as appealing for those tolerant of risk and focused on potential turnaround or value opportunities amid operational challenges.
Disclaimer: Investment carries a risk of loss of initial capital. The past performance is not a reliable indicator of future results. Be sure to understand risks before making an investment decision.
Go Further
I encourage you to read the complete analyses of Palo Alto Networks, Inc. and CyberArk Software Ltd. to enhance your investment decisions: