Home > Comparison > Technology > PLTR vs CYBR
The strategic rivalry between Palantir Technologies Inc. and CyberArk Software Ltd. shapes the future of software infrastructure. Palantir operates as a data integration and analytics powerhouse, while CyberArk specializes in cybersecurity solutions for privileged access management. This head-to-head contrasts Palantir’s expansive platform approach with CyberArk’s focused security expertise. This analysis aims to identify which company offers a superior risk-adjusted return for diversified portfolios navigating the evolving technology landscape.

Table of contents
Companies Overview
Palantir Technologies and CyberArk Software both hold critical roles in the software infrastructure landscape, shaping data security and intelligence operations globally.
Palantir Technologies Inc.: Data-Driven Intelligence Platform
Palantir dominates as a software platform provider focused on intelligence and data analytics. Its revenue stems from deploying Gotham for intelligence agencies and Foundry for enterprise data integration. In 2026, Palantir’s strategy emphasizes expanding AI capabilities through its Artificial Intelligence Platform, aiming to unify data processing and operational decision-making worldwide.
CyberArk Software Ltd.: Privileged Access Security Leader
CyberArk specializes in privileged access management and identity security, generating revenue by securing credentials and access across cloud and on-premises environments. The 2026 focus strengthens cloud entitlements and endpoint privilege management to reduce risk from excessive privileges, targeting diverse sectors like finance and healthcare with adaptive, identity-centric security solutions.
Strategic Collision: Similarities & Divergences
Both companies operate in software infrastructure but diverge sharply in focus: Palantir builds comprehensive data ecosystems, while CyberArk zeroes in on access control and identity security. Their competitive battlefield lies in enterprise cybersecurity and data governance. Palantir’s broad AI-driven platform contrasts with CyberArk’s specialized security suite, shaping distinct investment profiles based on scale versus niche expertise.
Income Statement Comparison
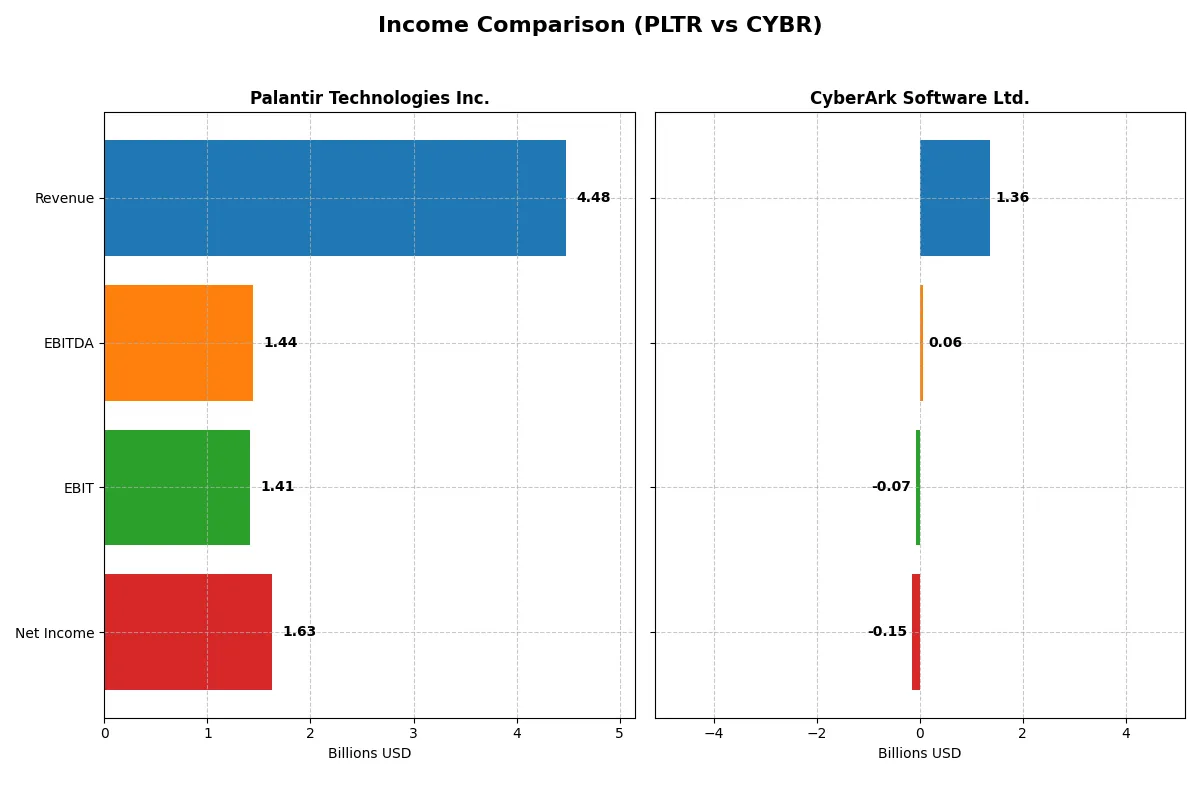
This data dissects the core profitability and scalability of both corporate engines to reveal who dominates the bottom line:
| Metric | Palantir Technologies Inc. (PLTR) | CyberArk Software Ltd. (CYBR) |
|---|---|---|
| Revenue | 4.48B | 1.36B |
| Cost of Revenue | 789M | 350M |
| Operating Expenses | 2.27B | 1.12B |
| Gross Profit | 3.69B | 1.01B |
| EBITDA | 1.44B | 59M |
| EBIT | 1.41B | -69M |
| Interest Expense | 0 | 0 |
| Net Income | 1.63B | -147M |
| EPS | 0.69 | -2.93 |
| Fiscal Year | 2025 | 2025 |
Income Statement Analysis: The Bottom-Line Duel
Comparing income statements reveals which company operates its business more efficiently and delivers stronger profitability.
Palantir Technologies Inc. Analysis
Palantir’s revenue surged from 1.54B in 2021 to 4.48B in 2025, with net income jumping from a loss of 520M to a profit of 1.63B. Gross margin remains robust at 82.4%, while net margin expanded to 36.3%, reflecting significant operational leverage and momentum in 2025’s strong earnings growth.
CyberArk Software Ltd. Analysis
CyberArk’s revenue grew steadily from 503M in 2021 to 1.36B in 2025, but net income remained negative, widening from -84M to -147M. Gross margin holds at a healthy 74.3%, yet EBIT and net margins stayed negative, showing persistent profitability challenges despite top-line progress.
Profit Leadership vs. Growth Challenges
Palantir clearly outperforms CyberArk in profitability and margin expansion, turning strong revenue growth into substantial net income. CyberArk’s revenue growth is solid but fails to translate into profits, reflecting operational strain. For investors prioritizing earnings efficiency, Palantir’s profile offers a more compelling fundamental foundation.
Financial Ratios Comparison
These vital ratios act as a diagnostic tool to expose the underlying fiscal health, valuation premiums, and capital efficiency of these companies:
| Ratios | Palantir Technologies Inc. (PLTR) | CyberArk Software Ltd. (CYBR) |
|---|---|---|
| ROE | 22.0% | -6.1% |
| ROIC | 17.9% | -2.7% |
| P/E | 259.2 | -152.2 |
| P/B | 57.0 | 9.3 |
| Current Ratio | 7.1 | 2.0 |
| Quick Ratio | 7.1 | 2.0 |
| D/E | 0.03 | 0.51 |
| Debt-to-Assets | 2.6% | 25.4% |
| Interest Coverage | 0 | 0 |
| Asset Turnover | 0.50 | 0.28 |
| Fixed Asset Turnover | 17.8 | 32.7 |
| Payout Ratio | 0 | 0 |
| Dividend Yield | 0% | 0% |
| Fiscal Year | 2025 | 2025 |
Efficiency & Valuation Duel: The Vital Signs
Financial ratios act as a company’s DNA, exposing hidden risks and operational strengths critical for investment decisions.
Palantir Technologies Inc.
Palantir shows strong profitability with a 22% ROE and a robust 36.3% net margin, indicating operational efficiency. However, its valuation appears stretched, with a P/E of 259 and a high P/B of 57. The company reinvests heavily in R&D rather than paying dividends, signaling a growth-focused capital allocation strategy.
CyberArk Software Ltd.
CyberArk reports negative profitability with a -6.1% ROE and a -10.8% net margin, reflecting operational challenges. Its valuation is more reasonable, with a negative P/E and a P/B of 9.3, but cash flow coverage and asset turnover remain weak. The firm currently does not return capital via dividends, likely prioritizing restructuring or growth investments.
Premium Valuation vs. Operational Safety
Palantir balances high profitability and aggressive growth investment but at a markedly expensive valuation. CyberArk presents operational weaknesses and negative returns, though with more moderate valuation metrics. Investors seeking growth may lean toward Palantir, while those wary of valuation risk might find CyberArk’s profile more cautious.
Which one offers the Superior Shareholder Reward?
Palantir (PLTR) pays no dividends but boasts strong free cash flow (0.89/share in 2025) and a robust buyback potential with a high current ratio (7.1), signaling financial flexibility. CyberArk (CYBR) also pays no dividends, reinvesting heavily in R&D amid negative profit margins and higher debt (debt/equity 0.51). Both skip dividends, focusing on growth, but Palantir’s cash-rich balance sheet and superior margins suggest a more sustainable distribution via buybacks. I favor Palantir for its healthier capital structure and stronger free cash flow, offering a superior total return profile in 2026.
Comparative Score Analysis: The Strategic Profile
The radar chart reveals the fundamental DNA and trade-offs of Palantir Technologies Inc. and CyberArk Software Ltd.:
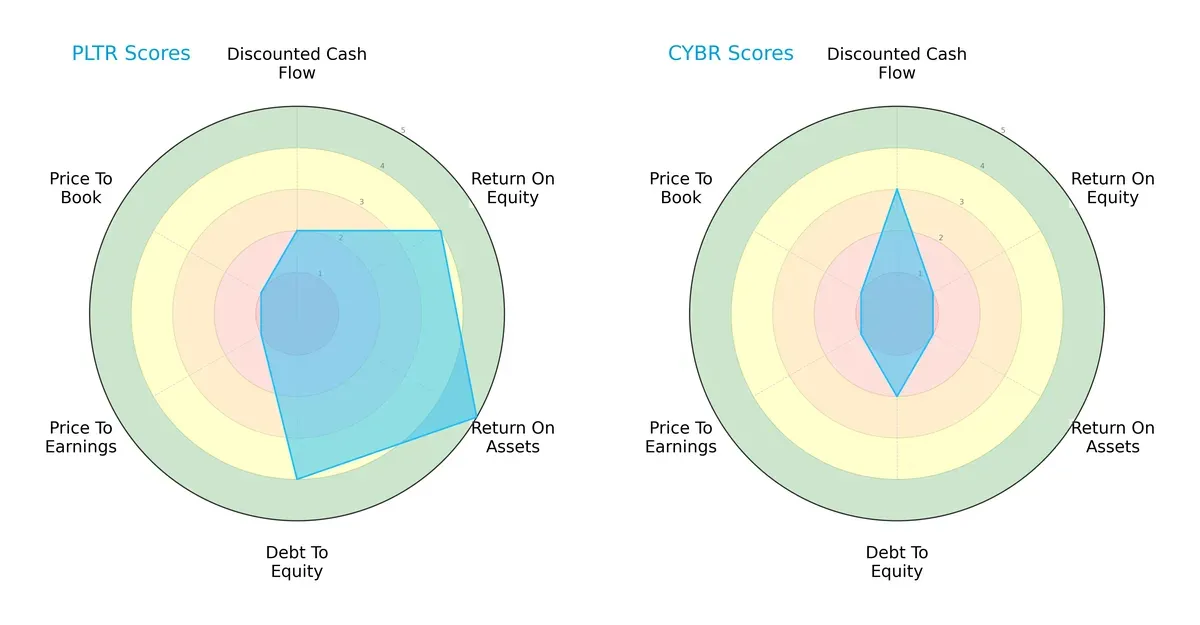
Palantir demonstrates strengths in ROE (4) and ROA (5), indicating efficient profit and asset use. It also maintains a solid debt-to-equity score (4), reflecting financial stability. However, its DCF score (2) and valuation metrics (PE and PB at 1) signal potential overvaluation risks. CyberArk shows a moderate DCF score (3) but lags significantly in profitability metrics (ROE and ROA at 1) and financial leverage (debt-to-equity at 2). Palantir holds a more balanced profile, while CyberArk depends on a moderate DCF edge despite weaker fundamentals.
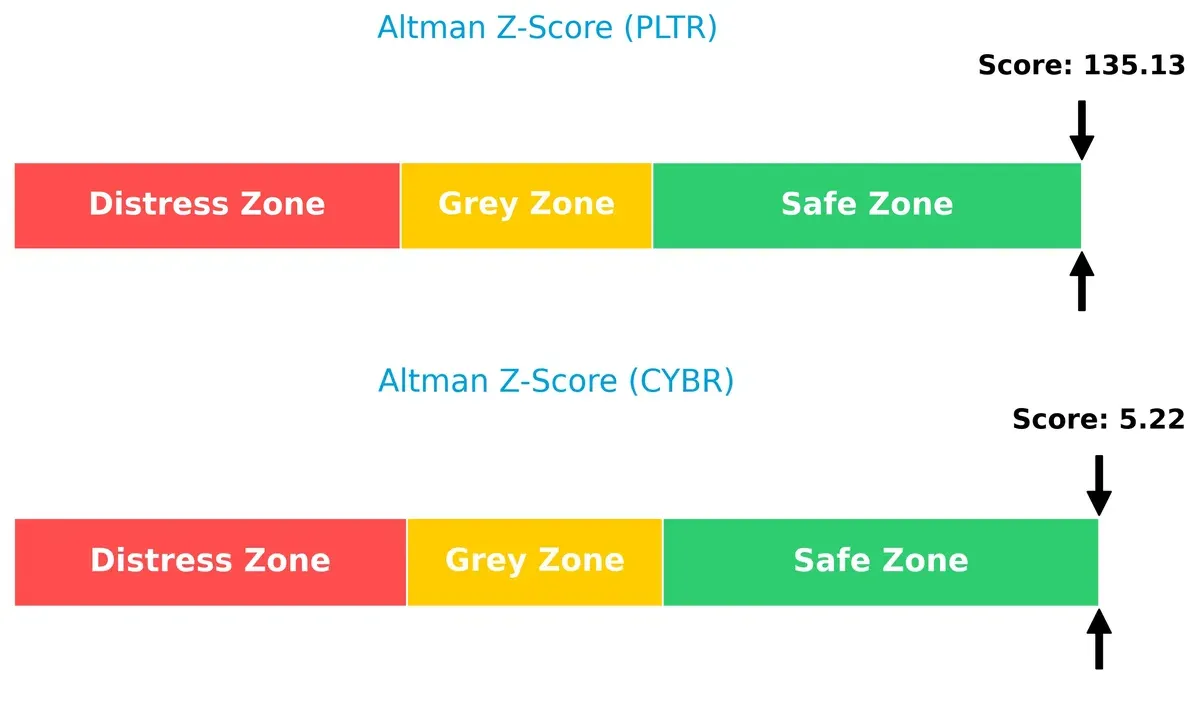
Bankruptcy Risk: Solvency Showdown
Palantir’s Altman Z-Score of 135.13 vastly outpaces CyberArk’s 5.22, placing both in the safe zone but highlighting Palantir’s exceptional solvency buffer in this cycle:
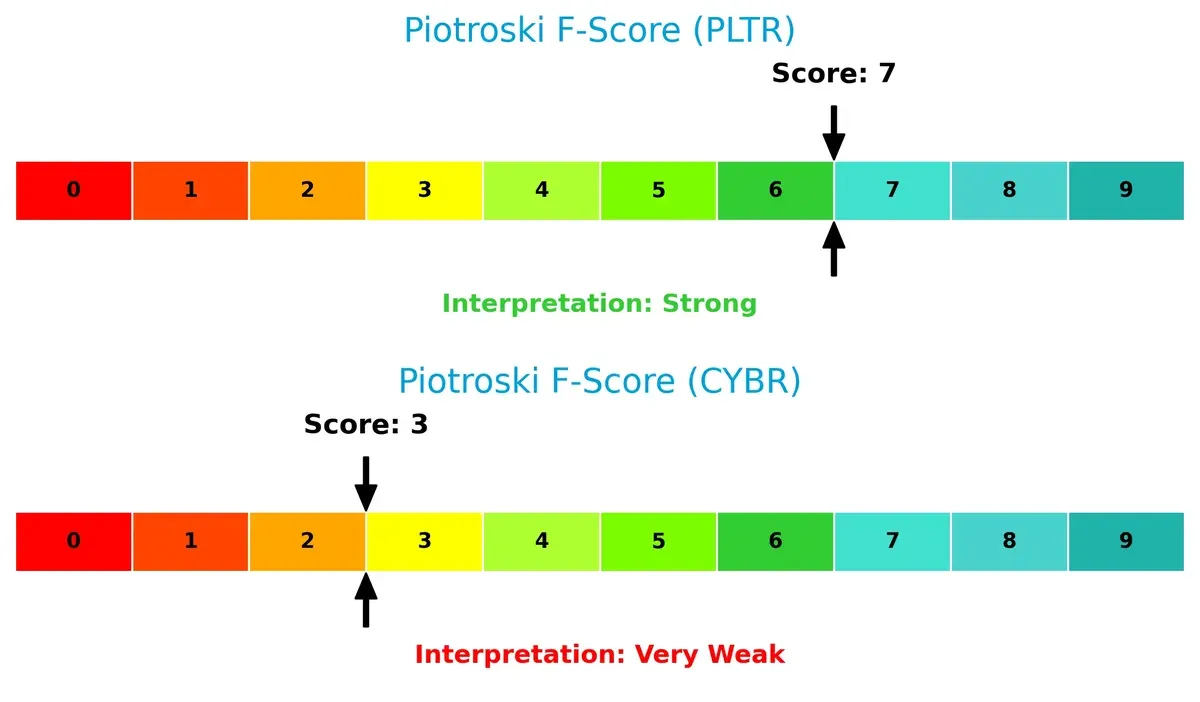
Financial Health: Quality of Operations
Palantir’s Piotroski F-Score of 7 signals strong financial health and operational quality. CyberArk’s score of 3 raises red flags on internal metrics and financial robustness:
How are the two companies positioned?
This section dissects the operational DNA of Palantir and CyberArk by comparing their revenue distribution and internal dynamics. The goal is to confront their economic moats and identify which model offers the most durable competitive advantage today.
Revenue Segmentation: The Strategic Mix
This visual comparison dissects how Palantir Technologies and CyberArk diversify their income streams and where their primary sector bets lie:
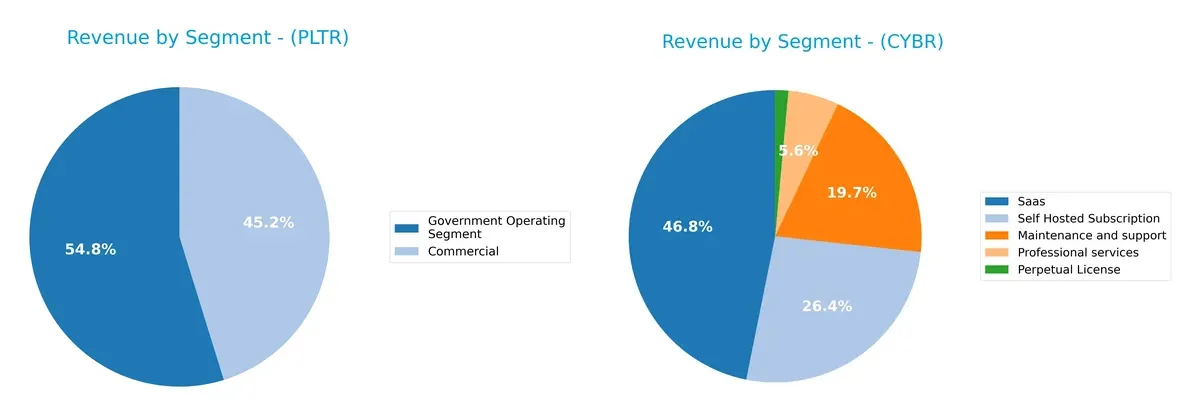
Palantir anchors its revenue in two clear segments: Government ($1.57B) and Commercial ($1.30B) in 2024, showing moderate diversification but heavy government reliance. CyberArk presents a more diversified mix with SaaS ($469M), Self-Hosted Subscription ($265M), Maintenance ($197M), and smaller licenses, reducing concentration risk while pivoting toward recurring revenue streams. Palantir’s government focus implies ecosystem lock-in; CyberArk’s spread supports resilience amid competitive pressures.
Strengths and Weaknesses Comparison
This table compares the strengths and weaknesses of Palantir Technologies Inc. and CyberArk Software Ltd.:
Palantir Strengths
- Strong profitability with 36.3% net margin
- High ROE at 22% and ROIC at 17.95%
- Low debt levels with 0.03 D/E and 2.58% debt-to-assets
- Robust global presence, revenue from US, UK, and Rest of World
- Diverse revenue streams in Commercial and Government sectors
- Favorable fixed asset turnover at 17.76
CyberArk Strengths
- Favorable WACC at 7.88% indicating efficient capital cost
- Positive current and quick ratios at 2.0 suggest liquidity
- Favorable fixed asset turnover of 32.73
- Diverse product revenue including SaaS, subscriptions, and licenses
- Significant geographic reach with US, EMEA, Israel, and others
- Moderate debt-to-assets at 25.38%, manageable leverage
Palantir Weaknesses
- Unfavorable high P/E of 259 and P/B of 57.02 suggest overvaluation
- Extremely high current ratio at 7.11 may indicate inefficient asset use
- WACC at 11.72% higher than ROIC, reducing capital efficiency
- No dividend yield, limiting income appeal
- Neutral asset turnover at 0.5, room for operational improvement
CyberArk Weaknesses
- Negative net margin (-10.79%), ROE (-6.11%), and ROIC (-2.74%) show unprofitability
- Interest coverage ratio of 0 raises solvency concerns
- Unfavorable asset turnover at 0.28 signals low operational efficiency
- Unfavorable P/B at 9.31
- No dividend yield, limiting shareholder returns
Palantir demonstrates strong profitability and low leverage but faces valuation and capital efficiency concerns. CyberArk shows liquidity and capital cost advantages but struggles with profitability and operational efficiency. These contrasts reflect differing strategic and financial challenges in their sectors.
The Moat Duel: Analyzing Competitive Defensibility
A structural moat is the only reliable shield protecting long-term profits from relentless competitive erosion in dynamic markets:
Palantir Technologies Inc.: Data Integration Moat
Palantir’s moat stems from deep switching costs embedded in its data platform, reflected in a robust 36% net margin and soaring ROIC. Expansion into AI-driven analytics in 2026 should deepen this advantage.
CyberArk Software Ltd.: Privileged Access Security Moat
CyberArk’s moat relies on specialized cybersecurity expertise, contrasting Palantir’s data focus. Despite negative EBIT margins, its growing revenue and foothold in identity management signal potential, yet profitability challenges persist.
Data Dominance vs. Security Specialization: The Moat Showdown
Palantir boasts a wider, more sustainable moat, with a 6.2% excess ROIC over WACC and strong margin expansion. CyberArk’s moat is narrower and less profitable, making Palantir better positioned to defend and grow its market share.
Which stock offers better returns?
Over the past year, both Palantir Technologies Inc. and CyberArk Software Ltd. exhibited bullish trends with decelerating momentum and recent downward price pressures.
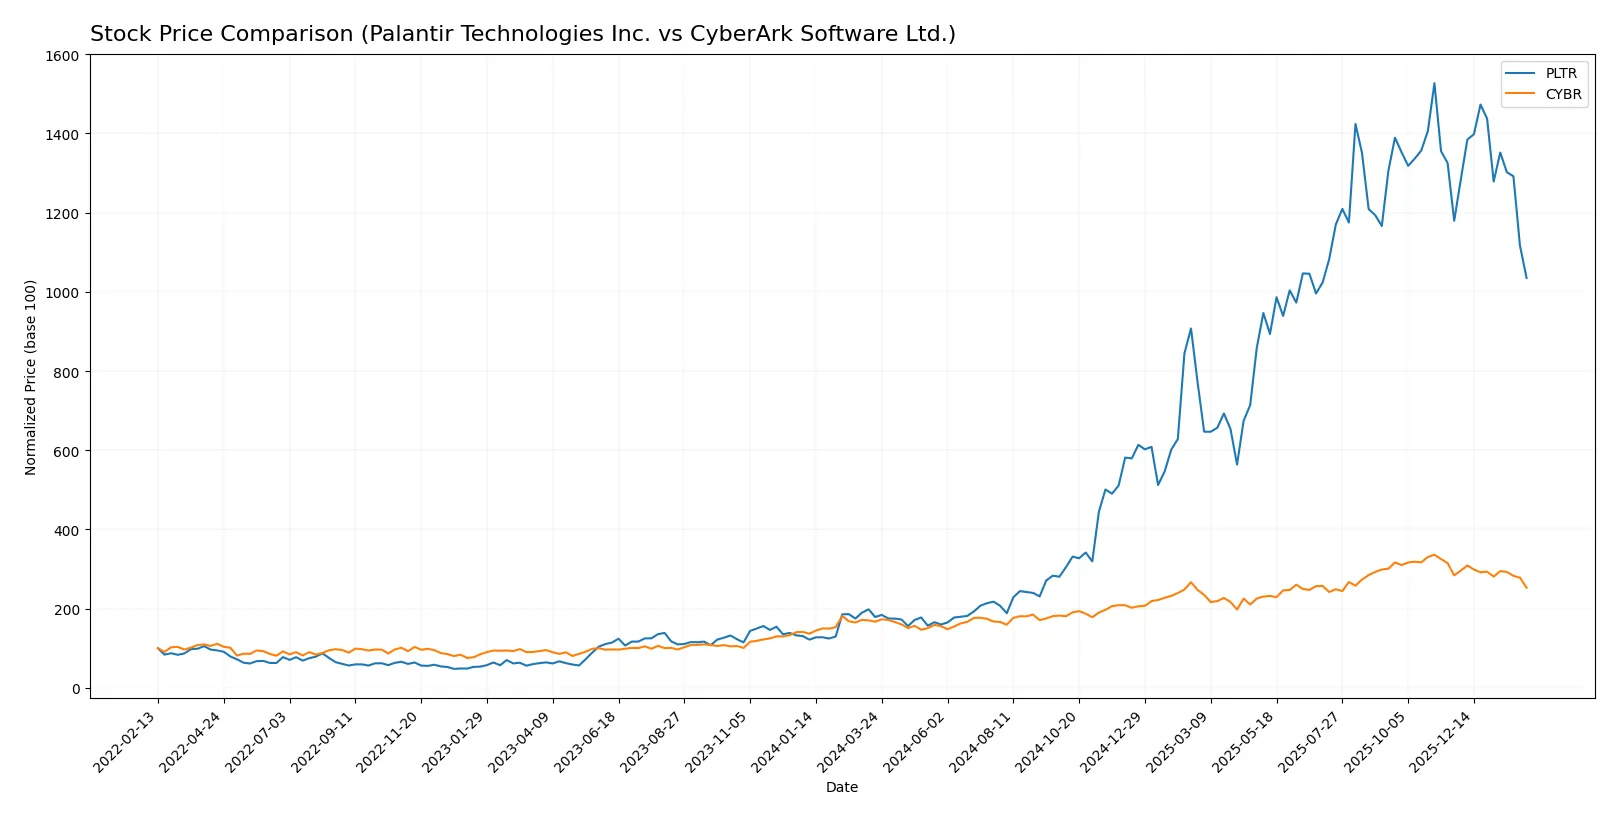
Trend Comparison
Palantir’s stock gained 478.54% over the past 12 months, signaling a strong bullish trend despite recent deceleration and a 12.24% drop between November 2025 and February 2026.
CyberArk’s stock rose 51.27% over the past year, also bullish but with deceleration. It faced a 10.98% decline in the recent three-month period ending February 2026.
Palantir outperformed CyberArk markedly in total returns despite both showing recent short-term weakness.
Target Prices
Analysts show strong confidence in Palantir Technologies Inc. and CyberArk Software Ltd., with bullish target price ranges.
| Company | Target Low | Target High | Consensus |
|---|---|---|---|
| Palantir Technologies Inc. | 180 | 230 | 200.15 |
| CyberArk Software Ltd. | 411 | 502 | 466.17 |
Palantir’s consensus target of 200.15 significantly exceeds its current price of 135.9, signaling substantial upside. CyberArk’s consensus target of 466.17 also well surpasses its current 391.77, reflecting strong analyst optimism.

Don’t Let Luck Decide Your Entry Point
Optimize your entry points with our advanced ProRealTime indicators. You’ll get efficient buy signals with precise price targets for maximum performance. Start outperforming now!
How do institutions grade them?
The following tables present recent institutional grades for Palantir Technologies Inc. and CyberArk Software Ltd.:
Palantir Technologies Inc. Grades
Here are the latest institutional grades issued for Palantir Technologies Inc.:
| Grading Company | Action | New Grade | Date |
|---|---|---|---|
| UBS | Maintain | Neutral | 2026-02-03 |
| Citigroup | Maintain | Buy | 2026-02-03 |
| DA Davidson | Maintain | Neutral | 2026-02-03 |
| Citigroup | Upgrade | Buy | 2026-01-12 |
| DA Davidson | Maintain | Neutral | 2025-11-04 |
| RBC Capital | Maintain | Underperform | 2025-11-04 |
| Baird | Maintain | Neutral | 2025-11-04 |
| Goldman Sachs | Maintain | Neutral | 2025-11-04 |
| Mizuho | Maintain | Neutral | 2025-11-04 |
| Morgan Stanley | Maintain | Equal Weight | 2025-11-04 |
CyberArk Software Ltd. Grades
Below are the recent institutional grades recorded for CyberArk Software Ltd.:
| Grading Company | Action | New Grade | Date |
|---|---|---|---|
| Oppenheimer | Maintain | Outperform | 2024-10-22 |
| Keybanc | Maintain | Overweight | 2024-10-18 |
| Mizuho | Maintain | Outperform | 2024-10-17 |
| BTIG | Maintain | Buy | 2024-10-09 |
| Barclays | Maintain | Overweight | 2024-10-07 |
| Wedbush | Maintain | Outperform | 2024-10-01 |
| Jefferies | Maintain | Buy | 2024-09-24 |
| Keybanc | Maintain | Overweight | 2024-08-09 |
| Citigroup | Maintain | Buy | 2024-08-09 |
| Susquehanna | Maintain | Positive | 2024-08-09 |
Which company has the best grades?
CyberArk consistently receives higher grades such as Outperform and Overweight from multiple firms. Palantir’s grades center around Neutral, with some Underperform ratings. This divergence may influence investor perception of relative strength and risk.
Risks specific to each company
The following categories identify the critical pressure points and systemic threats facing both firms in the 2026 market environment:
1. Market & Competition
Palantir Technologies Inc.
- Operates in a highly competitive software infrastructure space with strong government contracts but faces pressure from tech giants entering analytics.
CyberArk Software Ltd.
- Faces intense competition in cybersecurity, a rapidly evolving sector, with pressure to innovate against larger, diversified rivals.
2. Capital Structure & Debt
Palantir Technologies Inc.
- Maintains a very low debt-to-equity ratio (0.03), signaling conservative leverage and strong balance sheet discipline.
CyberArk Software Ltd.
- Holds moderate leverage (D/E 0.51), increasing financial risk amid negative profitability and interest coverage concerns.
3. Stock Volatility
Palantir Technologies Inc.
- Exhibits high beta (1.687), indicating considerable stock price volatility relative to the market (NASDAQ).
CyberArk Software Ltd.
- Displays lower beta (0.928), reflecting more stable stock movements but limited growth impulse.
4. Regulatory & Legal
Palantir Technologies Inc.
- Faces regulatory scrutiny due to government contracts and data privacy laws, which can impact project timelines and costs.
CyberArk Software Ltd.
- Cybersecurity regulation is stringent and evolving; non-compliance risks could lead to fines and reputational damage.
5. Supply Chain & Operations
Palantir Technologies Inc.
- Relies heavily on software delivery platforms; operational risks stem from deployment complexity and client adoption rates.
CyberArk Software Ltd.
- Dependent on cloud and SaaS delivery; operational risks include maintaining uptime and managing multi-tenant security.
6. ESG & Climate Transition
Palantir Technologies Inc.
- Faces increasing pressure to demonstrate data ethics and sustainable corporate governance practices amid tech sector ESG trends.
CyberArk Software Ltd.
- Must ensure cybersecurity resilience as part of ESG, with climate transition risks tied to energy-efficient data centers and cloud services.
7. Geopolitical Exposure
Palantir Technologies Inc.
- Significant exposure to US and allied governments; geopolitical tensions could disrupt contracts or increase compliance costs.
CyberArk Software Ltd.
- Operates globally with exposure to geopolitical risks, especially given its Israeli base and international client base.
Which company shows a better risk-adjusted profile?
Palantir’s primary risk lies in its high stock volatility and regulatory scrutiny linked to government contracts. CyberArk’s most impactful risk is its weak profitability combined with moderate leverage and poor interest coverage. I see Palantir as having a better risk-adjusted profile given its strong balance sheet, favorable profitability metrics, and robust Altman Z-score of 135, indicating financial safety. CyberArk’s negative margins and a Piotroski score of 3 highlight operational and financial weakness. Recent data confirms Palantir’s superior capital efficiency and lower financial risk, justifying my cautious preference.
Final Verdict: Which stock to choose?
Palantir Technologies Inc. (PLTR) wields unmatched efficiency as a cash-generating powerhouse, delivering impressive profitability and steadily growing returns on invested capital. Its high valuation multiples and elevated current ratio remain points of vigilance. PLTR suits investors aiming for aggressive growth in a dynamic tech landscape.
CyberArk Software Ltd. (CYBR) offers a strategic moat through its niche in cybersecurity with recurring revenue streams. While it lacks Palantir’s profitability, it displays greater financial stability and a more moderate valuation profile. CYBR fits well within a GARP (Growth at a Reasonable Price) portfolio seeking exposure to cybersecurity innovation with risk control.
If you prioritize aggressive growth and value creation backed by strong operating returns, Palantir outshines with its robust profitability and expanding moat. However, if you seek better stability and a more defensible niche in cybersecurity, CyberArk offers a compelling scenario despite weaker earnings. Both appeal to distinct investor avatars, warranting caution on valuation and execution risks.
Disclaimer: Investment carries a risk of loss of initial capital. The past performance is not a reliable indicator of future results. Be sure to understand risks before making an investment decision.
Go Further
I encourage you to read the complete analyses of Palantir Technologies Inc. and CyberArk Software Ltd. to enhance your investment decisions: