Oracle Corporation and CyberArk Software Ltd. both operate in the software infrastructure sector but target different niches within enterprise technology. Oracle is a global giant in cloud computing and database solutions, while CyberArk specializes in cybersecurity, focusing on privileged access management. Comparing these companies reveals contrasting growth strategies and innovation approaches. In this article, I will help you determine which company offers the most compelling investment opportunity in 2026.

Table of contents
Companies Overview
I will begin the comparison between Oracle Corporation and CyberArk Software Ltd. by providing an overview of these two companies and their main differences.
Oracle Overview
Oracle Corporation, founded in 1977 and headquartered in Austin, Texas, is a major player in the technology sector focused on software infrastructure. Its mission centers on delivering comprehensive enterprise IT solutions, including cloud software applications like ERP and human capital management, alongside database technologies and middleware. Oracle serves a wide array of industries globally, offering both cloud-based and hardware products, supported by a large workforce of 159K employees.
CyberArk Overview
CyberArk Software Ltd., established in 1999 and based in Petah Tikva, Israel, specializes in software-based security solutions, particularly in privileged access management. CyberArk’s mission is to secure identity and access for enterprises worldwide, providing SaaS offerings such as endpoint privilege management and cloud entitlements management. With a focused workforce of 3.8K employees, it delivers security solutions across multiple industries including financial services and healthcare, utilizing a mix of direct sales and channel partners.
Key similarities and differences
Both companies operate in the software infrastructure industry and focus on enterprise IT, but Oracle’s scope is broader, encompassing diverse cloud applications, database, and hardware products. CyberArk is more specialized, targeting security in privileged access and identity management. Oracle’s market cap is significantly larger at $549B compared to CyberArk’s $23B, reflecting their different scale and market reach. Both use direct and indirect sales channels but cater to somewhat distinct segments within enterprise technology.
Income Statement Comparison
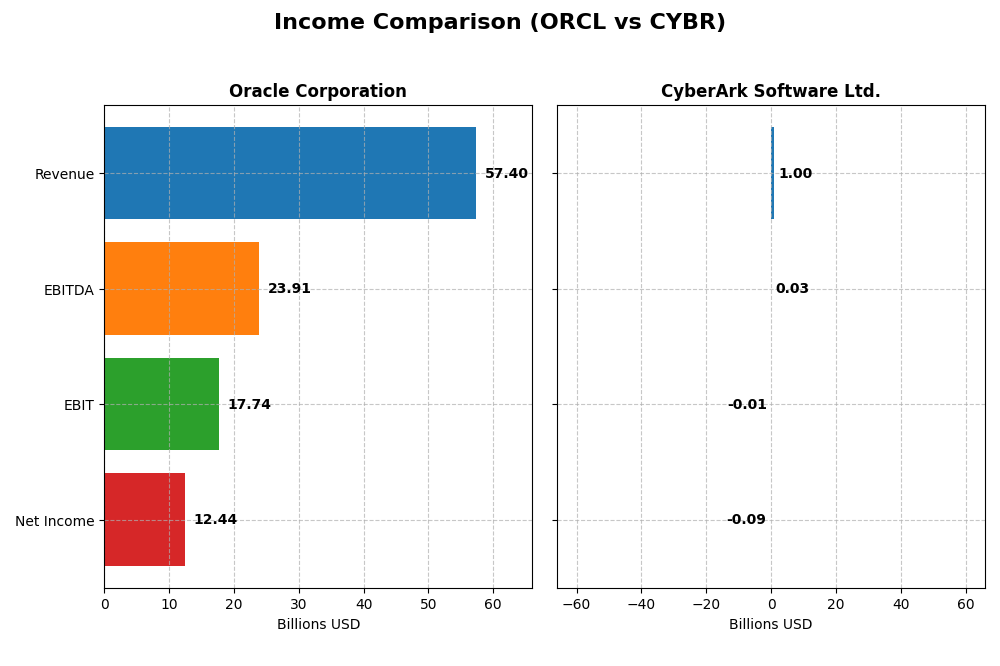
The table below provides a side-by-side comparison of the latest fiscal year income statement metrics for Oracle Corporation and CyberArk Software Ltd.
| Metric | Oracle Corporation | CyberArk Software Ltd. |
|---|---|---|
| Market Cap | 549B | 23B |
| Revenue | 57.4B | 1.0B |
| EBITDA | 23.9B | 29M |
| EBIT | 17.7B | -13M |
| Net Income | 12.4B | -93M |
| EPS | 4.46 | -2.12 |
| Fiscal Year | 2025 | 2024 |
Income Statement Interpretations
Oracle Corporation
Oracle’s revenue demonstrated a steady upward trend from 40.5B in 2021 to 57.4B in 2025, reflecting a 41.8% growth overall. Net income, however, declined by 9.5% over the same period, despite reaching 12.4B in 2025. Margins improved, with a gross margin of 70.5% and net margin of 21.7% in the latest year, indicating favorable profitability and operational efficiency gains.
CyberArk Software Ltd.
CyberArk’s revenue grew significantly from 464M in 2020 to 1.0B in 2024, a 115.5% increase, signaling rapid expansion. Despite this, net income remained negative throughout, with a widening loss of 93M in 2024. While the gross margin was strong at 79.2%, both EBIT and net margins were negative, reflecting ongoing challenges in reaching profitability despite revenue growth.
Which one has the stronger fundamentals?
Oracle displays stronger fundamentals with consistent revenue growth, positive net income, and improving margins, supported by a favorable income statement evaluation. CyberArk shows impressive revenue expansion but struggles with persistent net losses and negative margins, resulting in a neutral overall income statement opinion. Oracle’s established profitability contrasts with CyberArk’s growth-at-a-losses profile.
Financial Ratios Comparison
The table below presents the most recent key financial ratios for Oracle Corporation and CyberArk Software Ltd., providing a snapshot of their profitability, liquidity, valuation, and leverage metrics for 2025 and 2024 respectively.
| Ratios | Oracle Corporation (2025) | CyberArk Software Ltd. (2024) |
|---|---|---|
| ROE | 60.8% | -3.94% |
| ROIC | 10.9% | -2.85% |
| P/E | 37.1 | -157.5 |
| P/B | 22.6 | 6.21 |
| Current Ratio | 0.75 | 1.48 |
| Quick Ratio | 0.75 | 1.48 |
| D/E (Debt-to-Equity) | 5.09 | 0.012 |
| Debt-to-Assets | 61.8% | 0.88% |
| Interest Coverage | 4.94 | -17.9 |
| Asset Turnover | 0.34 | 0.30 |
| Fixed Asset Turnover | 1.32 | 51.1 |
| Payout Ratio | 38.1% | 0% |
| Dividend Yield | 1.03% | 0% |
Interpretation of the Ratios
Oracle Corporation
Oracle shows strong profitability ratios, including a favorable net margin of 21.68% and an impressive return on equity (ROE) of 60.84%. However, several liquidity and leverage ratios are weak, such as a low current ratio of 0.75 and a high debt-to-equity ratio of 5.09, indicating potential financial risk. Oracle pays dividends with a modest 1.03% yield, reflecting a balanced approach without excessive payout concerns.
CyberArk Software Ltd.
CyberArk’s profitability ratios are weak, with a negative net margin of -9.34% and ROE at -3.94%, signaling ongoing losses and operational challenges. The company maintains a neutral to favorable liquidity position, including a current ratio of 1.48 and very low debt levels. CyberArk does not pay dividends, likely due to reinvestment in growth and prioritization of R&D, which is typical for software firms in expansion phases.
Which one has the best ratios?
Oracle’s ratios demonstrate stronger profitability and shareholder returns despite some liquidity and leverage weaknesses, while CyberArk faces challenges in profitability but benefits from better liquidity and low debt. Oracle’s dividend policy contrasts with CyberArk’s reinvestment strategy, reflecting different financial profiles. Overall, Oracle presents a more favorable profitability profile, whereas CyberArk shows signs of growth investment.
Strategic Positioning
This section compares the strategic positioning of Oracle Corporation and CyberArk Software Ltd., including their market position, key segments, and exposure to technological disruption:
Oracle Corporation
- Large market cap of $549B; faces competitive pressure in global enterprise IT software and cloud markets.
- Diversified revenue from cloud and license ($49B), hardware ($3B), and services ($5B) business segments.
- Exposed to cloud and infrastructure technology shifts including cloud computing, autonomous databases, and blockchain.
CyberArk Software Ltd.
- Smaller market cap of $23B; competing in niche cybersecurity software with moderate competitive pressure.
- Focused on security software with SaaS, subscriptions, maintenance, and professional services.
- Focused on cybersecurity innovation with SaaS and identity access management, adapting to cloud security trends.
Oracle Corporation vs CyberArk Software Ltd. Positioning
Oracle employs a diversified approach across cloud, hardware, and services, providing broad industry exposure. CyberArk concentrates on cybersecurity software with targeted SaaS and subscription offerings, which may limit diversification but allows specialized focus.
Which has the best competitive advantage?
Both companies show declining ROIC trends and are currently shedding value. Oracle’s slightly unfavorable moat contrasts with CyberArk’s very unfavorable status, indicating Oracle maintains a relatively stronger competitive advantage despite challenges.
Stock Comparison
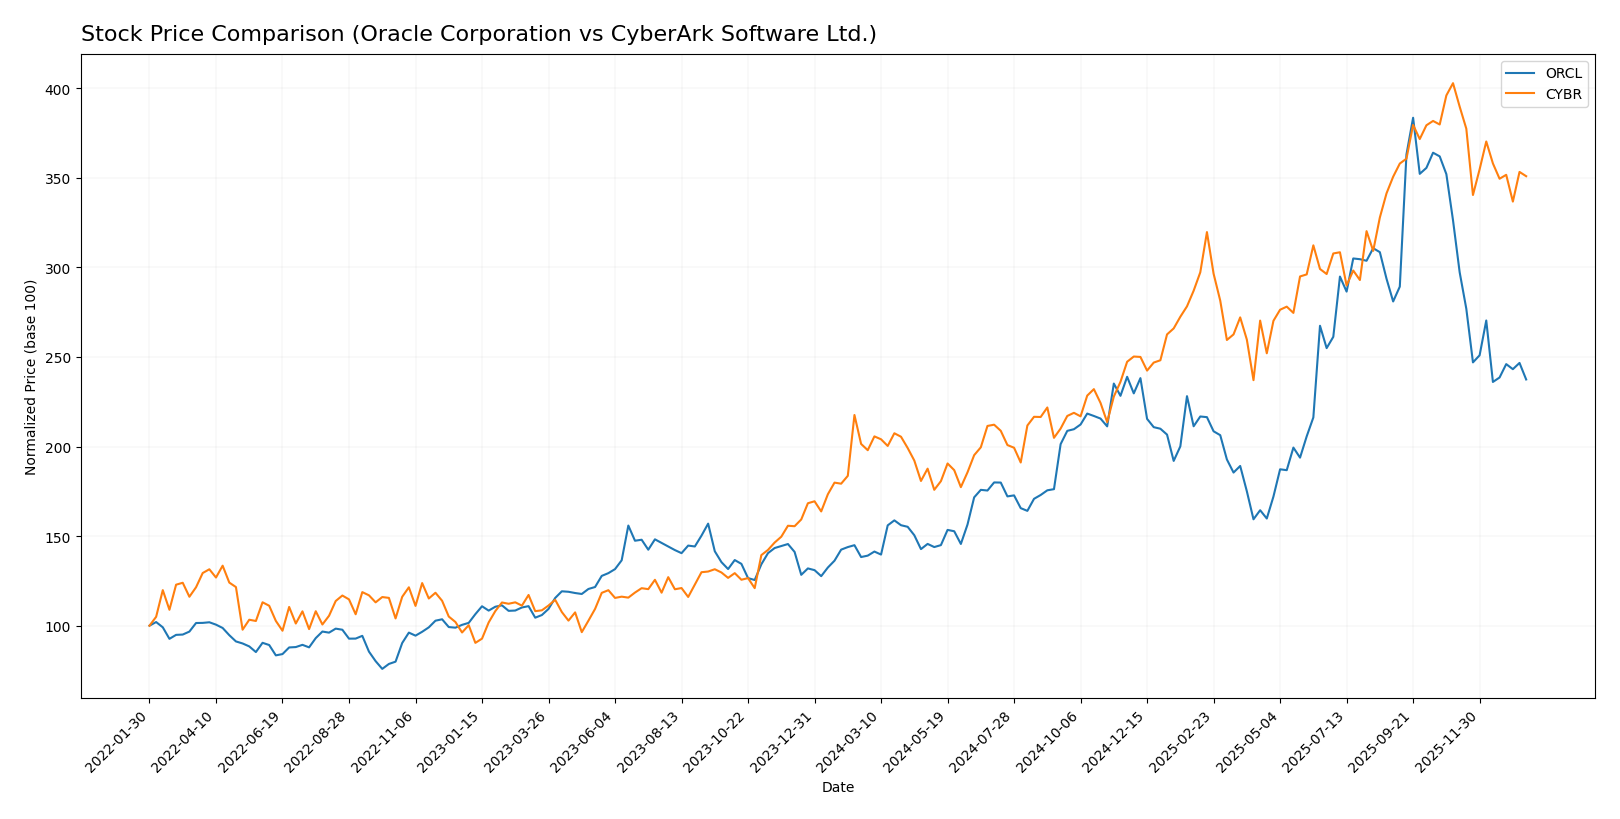
The stock price chart over the past year highlights significant bullish trends for both Oracle Corporation and CyberArk Software Ltd., with notable deceleration in momentum and recent declines in price.
Trend Analysis
Oracle Corporation’s stock demonstrated a strong bullish trend with a 70.69% increase over the past 12 months, despite a deceleration in growth and a recent 27.23% decline from November 2025 to January 2026.
CyberArk Software Ltd. showed a bullish trend as well, with a 77.27% price increase over the last year, experiencing deceleration and a recent 12.89% decline in the same recent period.
Comparing both, CyberArk delivered the highest overall market performance with a 77.27% gain versus Oracle’s 70.69% increase during the past 12 months.
Target Prices
The current analyst consensus presents a broad range of expected target prices for Oracle Corporation and CyberArk Software Ltd.
| Company | Target High | Target Low | Consensus |
|---|---|---|---|
| Oracle Corporation | 400 | 175 | 314.08 |
| CyberArk Software Ltd. | 520 | 440 | 479.22 |
Oracle’s target consensus of 314.08 indicates significant upside potential from its current price of 191.09. CyberArk’s consensus target of 479.22 also suggests moderate upside compared to its current price of 453.65, reflecting positive analyst sentiment.
Analyst Opinions Comparison
This section compares analysts’ ratings and grades for Oracle Corporation and CyberArk Software Ltd.:
Rating Comparison
Oracle Corporation Rating
- Rating: B, assessed as Very Favorable by analysts.
- Discounted Cash Flow Score: 3, indicating a Moderate valuation.
- ROE Score: 5, reflecting Very Favorable profitability.
- ROA Score: 4, showing Favorable asset utilization.
- Debt To Equity Score: 1, indicating Very Unfavorable financial risk.
- Overall Score: 3, categorized as Moderate overall standing.
CyberArk Software Ltd. Rating
- Rating: C-, also noted as Very Favorable despite lower grade.
- Discounted Cash Flow Score: 3, also Moderate valuation.
- ROE Score: 1, considered Very Unfavorable.
- ROA Score: 1, marked Very Unfavorable.
- Debt To Equity Score: 2, rated Moderate financial risk.
- Overall Score: 1, classified as Very Unfavorable overall.
Which one is the best rated?
Oracle Corporation holds a stronger overall rating and higher profitability scores compared to CyberArk Software Ltd., despite a less favorable debt-to-equity score. Oracle’s overall and return metrics suggest a better-rated financial standing.
Scores Comparison
The scores comparison between Oracle Corporation and CyberArk Software Ltd. is summarized as follows:
Oracle Corporation Scores
- Altman Z-Score: 2.43, in the grey zone indicating moderate bankruptcy risk.
- Piotroski Score: 5, average financial strength.
CyberArk Software Ltd. Scores
- Altman Z-Score: 6.52, in the safe zone indicating low bankruptcy risk.
- Piotroski Score: 3, very weak financial strength.
Which company has the best scores?
CyberArk has a significantly higher Altman Z-Score, suggesting stronger financial stability, but Oracle shows a higher Piotroski Score, indicating better financial strength. Each company excels in different metrics.
Grades Comparison
Here is a comparison of recent grades assigned to Oracle Corporation and CyberArk Software Ltd.:
Oracle Corporation Grades
This table shows recent grades from several reliable grading companies for Oracle Corporation.
| Grading Company | Action | New Grade | Date |
|---|---|---|---|
| UBS | Maintain | Buy | 2026-01-05 |
| RBC Capital | Maintain | Sector Perform | 2026-01-05 |
| Jefferies | Maintain | Buy | 2026-01-05 |
| Goldman Sachs | Maintain | Neutral | 2025-12-12 |
| Keybanc | Maintain | Overweight | 2025-12-11 |
| UBS | Maintain | Buy | 2025-12-11 |
| Citigroup | Maintain | Buy | 2025-12-11 |
| JP Morgan | Maintain | Neutral | 2025-12-11 |
| DA Davidson | Maintain | Neutral | 2025-12-11 |
| Scotiabank | Maintain | Sector Outperform | 2025-12-11 |
Oracle’s grades predominantly indicate a positive outlook, with most firms rating it as Buy or better, complemented by several Neutral and Sector Perform ratings.
CyberArk Software Ltd. Grades
This table presents recent grades from reputable grading companies for CyberArk Software Ltd.
| Grading Company | Action | New Grade | Date |
|---|---|---|---|
| Oppenheimer | Maintain | Outperform | 2024-10-22 |
| Keybanc | Maintain | Overweight | 2024-10-18 |
| Mizuho | Maintain | Outperform | 2024-10-17 |
| BTIG | Maintain | Buy | 2024-10-09 |
| Barclays | Maintain | Overweight | 2024-10-07 |
| Wedbush | Maintain | Outperform | 2024-10-01 |
| Jefferies | Maintain | Buy | 2024-09-24 |
| DA Davidson | Maintain | Buy | 2024-08-09 |
| Rosenblatt | Maintain | Buy | 2024-08-09 |
| Susquehanna | Maintain | Positive | 2024-08-09 |
CyberArk’s grades largely show an optimistic consensus, with a strong presence of Buy, Outperform, and Overweight ratings, suggesting robust confidence.
Which company has the best grades?
Both Oracle and CyberArk have a consensus rating of Buy, but CyberArk shows a higher proportion of Outperform and Overweight grades compared to Oracle’s more mixed Neutral and Sector Perform ratings. This difference may influence investors seeking stronger growth signals.
Strengths and Weaknesses
Below is a comparison of key strengths and weaknesses for Oracle Corporation and CyberArk Software Ltd. based on the latest available data.
| Criterion | Oracle Corporation | CyberArk Software Ltd. |
|---|---|---|
| Diversification | Highly diversified with Cloud, License, Hardware, and Services segments; Cloud revenue at $49.2B in 2025 | More focused; revenue mainly from SaaS, Self Hosted Subscription, and Maintenance; SaaS growing to $469M in 2024 |
| Profitability | Strong profitability: net margin 21.7%, ROE 60.8%, ROIC 10.9% (2025) | Negative profitability: net margin -9.3%, ROE -3.9%, ROIC -2.9% (2024) |
| Innovation | Moderate innovation; declining ROIC trend suggests challenges maintaining competitive edge | Innovation needed; very unfavorable MOAT and sharply declining ROIC indicate value destruction |
| Global presence | Extensive global presence, serving enterprises worldwide with a broad product portfolio | Niche global presence focused on cybersecurity sectors |
| Market Share | Large market share in database and cloud infrastructure markets | Smaller market share, competing in a specialized cybersecurity niche |
Key takeaways: Oracle shows solid profitability and broad diversification but faces declining returns on invested capital, signaling some operational challenges ahead. CyberArk struggles with negative profitability and value destruction despite promising growth in SaaS, indicating higher investment risk. Investors should weigh Oracle’s stability against CyberArk’s potential growth tempered by financial weaknesses.
Risk Analysis
Below is a comparative table summarizing key risk factors for Oracle Corporation (ORCL) and CyberArk Software Ltd. (CYBR) based on the most recent data available for 2025 and 2024.
| Metric | Oracle Corporation (ORCL) | CyberArk Software Ltd. (CYBR) |
|---|---|---|
| Market Risk | High beta 1.65 indicates elevated volatility versus market. | Moderate beta 0.92 suggests lower market volatility risk. |
| Debt level | High debt-to-equity (5.09) and debt-to-assets (61.83%) signal significant leverage. | Very low debt-to-equity (0.01) and debt-to-assets (0.88%) show minimal leverage risk. |
| Regulatory Risk | Moderate, US tech sector subject to data privacy and antitrust scrutiny. | Moderate, operating globally with exposure to international cybersecurity regulations. |
| Operational Risk | Large scale and complexity with 159K employees may increase operational risks. | Smaller size (~3.8K employees) but reliance on SaaS security solutions may expose to cyber threats. |
| Environmental Risk | Moderate, hardware manufacturing has some environmental impacts. | Low, primarily software-focused with limited direct environmental footprint. |
| Geopolitical Risk | US-based with global footprint; trade tensions could affect supply chains. | Based in Israel with international exposure; geopolitical tensions in Middle East could impact operations. |
Oracle’s elevated market risk and substantial leverage are the main concerns, potentially constraining financial flexibility. CyberArk’s biggest risks lie in operational challenges and geopolitical exposure, though its low debt level reduces financial risk significantly. The likelihood and impact of market volatility and leverage make Oracle riskier, while CyberArk’s risks are more operational and geopolitical in nature.
Which Stock to Choose?
Oracle Corporation (ORCL) shows favorable income evolution with an 8.38% revenue growth in 2025 and a strong net margin of 21.68%. Financial ratios reveal high profitability but unfavorable leverage and liquidity metrics. The company has a very favorable rating of B, though its economic moat is slightly unfavorable due to declining ROIC.
CyberArk Software Ltd. (CYBR) exhibits strong revenue growth at 33.1% in 2024 but suffers from negative net margin and profitability ratios. Its financial ratios are slightly unfavorable overall, with a very unfavorable economic moat reflecting declining profitability. CYBR holds a very favorable rating of C- despite challenges in earnings and cash flow.
Investors with a higher risk tolerance and focus on growth might find CyberArk’s rapid top-line expansion appealing despite profitability concerns. Conversely, those prioritizing established profitability and a strong rating may view Oracle’s stable income and better financial health as more suitable, acknowledging its slightly unfavorable moat.
Disclaimer: Investment carries a risk of loss of initial capital. The past performance is not a reliable indicator of future results. Be sure to understand risks before making an investment decision.
Go Further
I encourage you to read the complete analyses of Oracle Corporation and CyberArk Software Ltd. to enhance your investment decisions: