In today’s fast-evolving cybersecurity landscape, choosing the right company to invest in is crucial. CyberArk Software Ltd. and Okta, Inc. both operate in the Software – Infrastructure sector, specializing in identity and access management solutions that protect enterprises worldwide. Their overlapping market focus and innovative approaches make them prime candidates for comparison. Join me as we analyze which company stands out as the more compelling investment opportunity.

Table of contents
Companies Overview
I will begin the comparison between CyberArk Software Ltd. and Okta, Inc. by providing an overview of these two companies and their main differences.
CyberArk Overview
CyberArk Software Ltd. develops and markets software-based security solutions focused on privileged access management and identity security. Founded in 1999 and headquartered in Petah Tikva, Israel, CyberArk serves diverse industries including financial services, healthcare, and government agencies. Its solutions protect against cyberattacks by securing credentials and managing access across endpoints, cloud environments, and third-party vendors.
Okta Overview
Okta, Inc. provides identity solutions through its Okta Identity Cloud platform to enterprises, SMBs, universities, and government agencies globally. Founded in 2009 and based in San Francisco, California, Okta offers products like single sign-on, adaptive multi-factor authentication, and lifecycle management. Its comprehensive security platform supports cloud and on-premise systems and includes Auth0 for customizable login experiences.
Key similarities and differences
Both companies operate in the software infrastructure industry focusing on identity and access management and cybersecurity. CyberArk emphasizes privileged access security and credential management, while Okta offers a broader identity platform with lifecycle and API access management. CyberArk is smaller with 3.8K employees and a $22.9B market cap, whereas Okta has 5.9K employees and a $15.2B market cap, reflecting their differing scale and product scope.
Income Statement Comparison
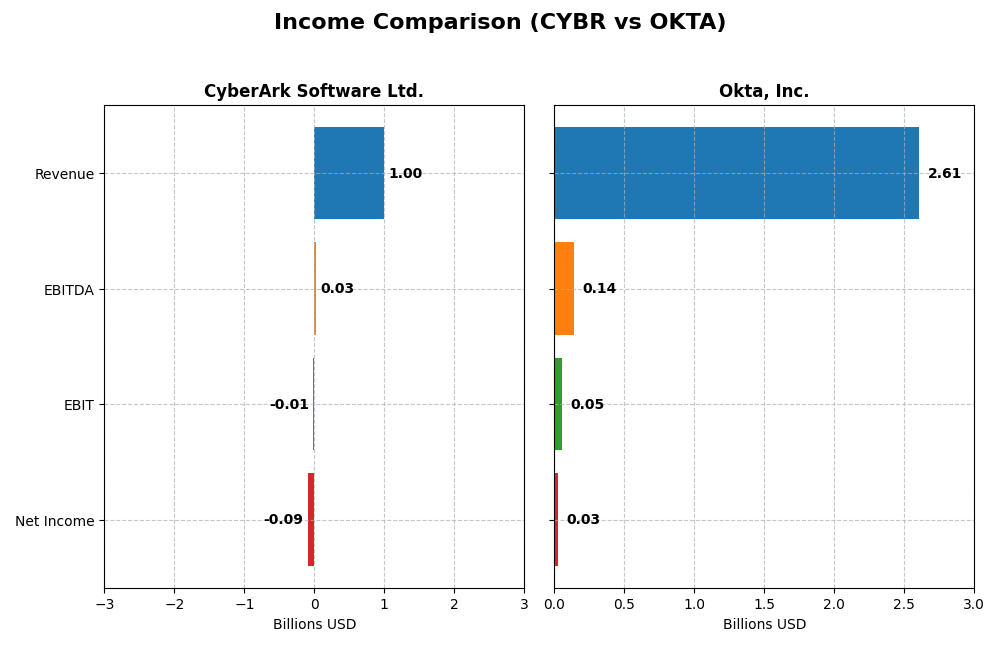
The table below compares the key income statement metrics for CyberArk Software Ltd. and Okta, Inc. for their most recent fiscal years, providing a snapshot of their financial performance.
| Metric | CyberArk Software Ltd. (CYBR) | Okta, Inc. (OKTA) |
|---|---|---|
| Market Cap | 22.9B | 15.2B |
| Revenue | 1.00B | 2.61B |
| EBITDA | 29M | 139M |
| EBIT | -13M | 51M |
| Net Income | -93M | 28M |
| EPS | -2.12 | 0.17 |
| Fiscal Year | 2024 | 2025 |
Income Statement Interpretations
CyberArk Software Ltd.
CyberArk’s revenue showed a strong increase from $464M in 2020 to $1.0B in 2024, representing a 115% growth over five years. However, net income remained negative, deteriorating from -$5.8M in 2020 to -$93.5M in 2024, with net margins declining to -9.3%. The 2024 gross margin stayed favorable at 79.2%, but operating and net losses persisted despite revenue growth acceleration.
Okta, Inc.
Okta displayed robust revenue growth from $835M in 2021 to $2.61B in 2025, a 213% increase. Net income improved from a loss of -$266M in 2021 to a positive $28M in 2025, with net margins turning slightly positive at 1.07%. The company maintained a favorable gross margin above 76%, and 2025 showed meaningful margin and earnings improvements, reflecting operational progress.
Which one has the stronger fundamentals?
Okta exhibits stronger fundamentals with consistent revenue growth, positive net income in 2025, and favorable margin trends, including improving EBIT and net margins. CyberArk, while growing revenues significantly, continues to report losses and negative margins, indicating challenges in profitability. Okta’s overall positive income statement evaluation contrasts with CyberArk’s neutral stance, favoring Okta’s financial health.
Financial Ratios Comparison
The table below presents the most recent financial ratios for CyberArk Software Ltd. and Okta, Inc., based on their fiscal year 2024 and January 2025 data respectively.
| Ratios | CyberArk Software Ltd. (2024) | Okta, Inc. (2025) |
|---|---|---|
| ROE | -3.94% | 0.44% |
| ROIC | -2.85% | -0.61% |
| P/E | -157.49 | 570.60 |
| P/B | 6.21 | 2.49 |
| Current Ratio | 1.48 | 1.35 |
| Quick Ratio | 1.48 | 1.35 |
| D/E (Debt-to-Equity) | 0.01 | 0.15 |
| Debt-to-Assets | 0.01 | 0.10 |
| Interest Coverage | -17.90 | -14.80 |
| Asset Turnover | 0.30 | 0.28 |
| Fixed Asset Turnover | 51.11 | 22.31 |
| Payout Ratio | 0 | 0 |
| Dividend Yield | 0 | 0 |
Interpretation of the Ratios
CyberArk Software Ltd.
CyberArk shows a mixed ratio profile with 35.7% favorable and 50% unfavorable ratios, leading to a slightly unfavorable overall view. Key weaknesses include negative net margin (-9.34%), ROE (-3.94%), and high price-to-book (6.21). The company has a neutral current ratio (1.48) and strong quick ratio (1.48). CyberArk pays no dividends, likely due to ongoing reinvestment and growth strategies.
Okta, Inc.
Okta presents a more balanced ratio picture, with 42.9% favorable and 42.9% unfavorable ratios, resulting in a neutral overall assessment. The firm has a low but positive net margin (1.07%) and ROE (0.44%), supported by strong interest coverage (10.2) and manageable debt ratios. Okta also does not pay dividends, prioritizing reinvestment and product development in a competitive sector.
Which one has the best ratios?
Okta’s ratios are generally more balanced and neutral, with better interest coverage and a favorable weighted average cost of capital. CyberArk’s profile is slightly unfavorable, mainly due to negative profitability metrics and high valuation multiples. Based on these factors alone, Okta holds a marginal advantage in its financial ratios compared to CyberArk.
Strategic Positioning
This section compares the strategic positioning of CyberArk Software Ltd. and Okta, Inc. including market position, key segments, and exposure to technological disruption:
CyberArk Software Ltd.
- Market position and competitive pressure
- Key segments and business drivers
- Exposure to technological disruption
Okta, Inc.
- MarketCap 23B, operates globally in security software, facing infrastructure sector competition.
- Revenue driven by SaaS (469M), Self Hosted Subscription (265M), plus maintenance, licenses, services.
- Focuses on privileged access, identity management, cloud entitlements, adapting to cloud security trends.
CyberArk vs Okta Positioning
CyberArk has a diversified product mix spanning SaaS, self-hosted subscriptions, and professional services, targeting multiple industries. Okta concentrates on cloud identity solutions with dominant subscription revenue, leveraging advanced authentication technologies. Each approach suits different market dynamics and customer needs.
Which has the best competitive advantage?
Both companies currently shed value as ROIC is below WACC. CyberArk shows declining ROIC and a very unfavorable moat status, while Okta’s ROIC is growing slightly despite still unfavorable moat, indicating improving capital efficiency and a potentially stronger competitive advantage over time.
Stock Comparison
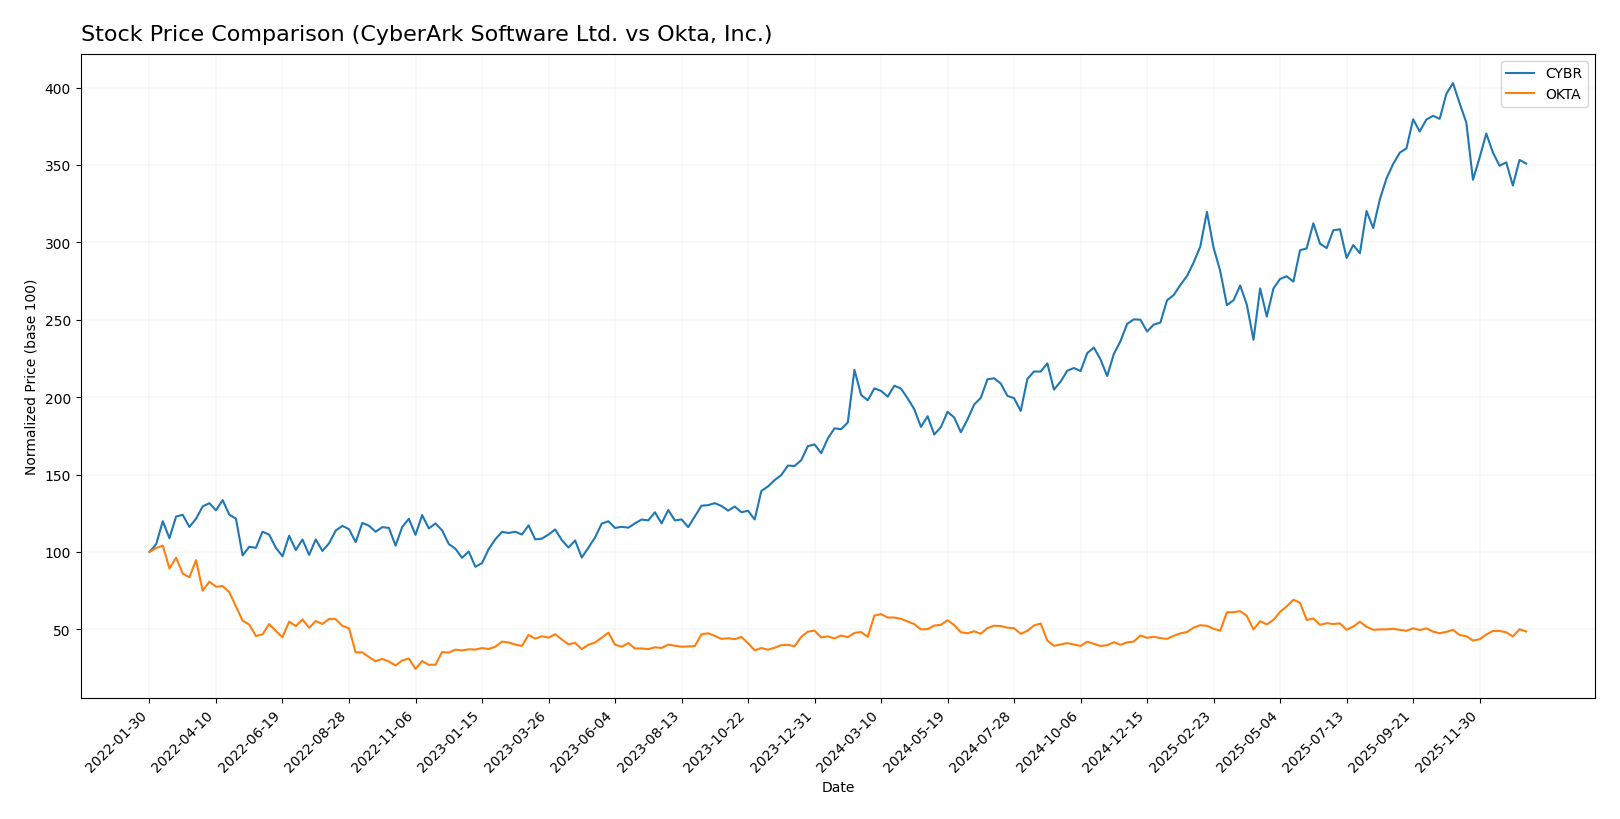
The past year has seen CyberArk Software Ltd. (CYBR) exhibit strong bullish momentum with a 77.27% price increase despite recent deceleration, while Okta, Inc. (OKTA) showed moderate bullish growth with acceleration and less volatility.
Trend Analysis
CyberArk Software Ltd. displayed a 77.27% bullish trend over the past 12 months, marked by high volatility (82.45 std deviation), a peak at 520.78, and a recent deceleration phase with a -12.89% decline.
Okta, Inc. recorded a 7.58% bullish trend in the same period with lower volatility (11.38 std deviation), accelerating price gains, and a slight recent dip of -2.16% without a clear negative slope.
Comparing both, CyberArk clearly delivered the highest market performance with significantly stronger price appreciation despite recent softness, whereas Okta’s growth was steadier and more moderate.
Target Prices
Here is the consensus target price outlook from verified analysts for the companies.
| Company | Target High | Target Low | Consensus |
|---|---|---|---|
| CyberArk Software Ltd. | 520 | 440 | 479.22 |
| Okta, Inc. | 140 | 60 | 110.67 |
Analysts expect CyberArk’s stock to appreciate from its current price of 453.65 USD, with a consensus near 479 USD. Okta’s consensus target of 110.67 USD also suggests upside potential compared to its current price around 89.55 USD.
Analyst Opinions Comparison
This section compares analysts’ ratings and grades for CyberArk Software Ltd. and Okta, Inc.:
Rating Comparison
CyberArk Software Ltd. Rating
- Rating: C- indicating a very favorable overall status.
- Discounted Cash Flow Score: 3, considered moderate.
- ROE Score: 1, showing very unfavorable efficiency.
- ROA Score: 1, very unfavorable asset utilization.
- Debt To Equity Score: 2, moderate financial risk.
- Overall Score: 1, very unfavorable summary assessment.
Okta, Inc. Rating
- Rating: B, also reflecting a very favorable overall status.
- Discounted Cash Flow Score: 4, regarded as favorable.
- ROE Score: 2, moderate efficiency in generating profit.
- ROA Score: 3, moderate effectiveness in using assets.
- Debt To Equity Score: 4, favorable low financial risk.
- Overall Score: 3, moderate overall financial standing.
Which one is the best rated?
Based on the provided data, Okta holds higher scores across most financial metrics, including discounted cash flow, ROE, ROA, debt-to-equity, and overall score, indicating a comparatively better rating than CyberArk.
Scores Comparison
The comparison of scores for CyberArk Software Ltd. and Okta, Inc. is as follows:
CyberArk Scores
- Altman Z-Score: 6.52, in the safe zone, indicating low bankruptcy risk.
- Piotroski Score: 3, classified as very weak, signaling weak financial health.
Okta Scores
- Altman Z-Score: 4.15, in the safe zone, showing solid financial stability.
- Piotroski Score: 8, classified as very strong, indicating robust financial strength.
Which company has the best scores?
Okta has a lower Altman Z-Score than CyberArk but both are in the safe zone. Okta’s Piotroski Score is much stronger, suggesting better overall financial health compared to CyberArk’s very weak score.
Grades Comparison
The following section presents a comparison of recent reliable grades for CyberArk Software Ltd. and Okta, Inc.:
CyberArk Software Ltd. Grades
This table summarizes recent grades assigned by reputable grading companies for CyberArk Software Ltd.:
| Grading Company | Action | New Grade | Date |
|---|---|---|---|
| Oppenheimer | Maintain | Outperform | 2024-10-22 |
| Keybanc | Maintain | Overweight | 2024-10-18 |
| Mizuho | Maintain | Outperform | 2024-10-17 |
| BTIG | Maintain | Buy | 2024-10-09 |
| Barclays | Maintain | Overweight | 2024-10-07 |
| Wedbush | Maintain | Outperform | 2024-10-01 |
| Jefferies | Maintain | Buy | 2024-09-24 |
| DA Davidson | Maintain | Buy | 2024-08-09 |
| Rosenblatt | Maintain | Buy | 2024-08-09 |
| Susquehanna | Maintain | Positive | 2024-08-09 |
The majority of grades for CyberArk are positive, predominantly “Buy” and “Outperform,” showing consistent confidence from analysts.
Okta, Inc. Grades
This table summarizes recent grades assigned by reputable grading companies for Okta, Inc.:
| Grading Company | Action | New Grade | Date |
|---|---|---|---|
| Stephens & Co. | Upgrade | Overweight | 2026-01-14 |
| Piper Sandler | Maintain | Neutral | 2026-01-05 |
| RBC Capital | Maintain | Outperform | 2026-01-05 |
| Jefferies | Upgrade | Buy | 2025-12-16 |
| Needham | Maintain | Buy | 2025-12-12 |
| BTIG | Maintain | Buy | 2025-12-04 |
| Susquehanna | Maintain | Neutral | 2025-12-03 |
| Cantor Fitzgerald | Maintain | Overweight | 2025-12-03 |
| Canaccord Genuity | Maintain | Buy | 2025-12-03 |
| Scotiabank | Maintain | Sector Perform | 2025-12-03 |
Okta’s grades exhibit a mix of “Buy,” “Overweight,” and “Neutral,” with recent upgrades indicating improving analyst sentiment.
Which company has the best grades?
Both CyberArk and Okta share a consensus “Buy” rating, but CyberArk displays more consistent high ratings like “Outperform” and “Buy” across multiple recent reports, whereas Okta shows a wider spread including “Neutral” and “Sector Perform.” This suggests CyberArk may currently enjoy stronger analyst conviction, potentially impacting investor confidence and portfolio decisions.
Strengths and Weaknesses
Below is a comparison of key strengths and weaknesses for CyberArk Software Ltd. (CYBR) and Okta, Inc. (OKTA) based on the most recent data.
| Criterion | CyberArk Software Ltd. (CYBR) | Okta, Inc. (OKTA) |
|---|---|---|
| Diversification | Moderate product range with SaaS, Support, and Licensing; increasing SaaS revenue to $469M in 2024 | Primarily subscription-based with $2.56B subscription revenue in 2025; focused business model |
| Profitability | Negative net margin (-9.34%) and ROIC (-2.85%); value destroying with declining profitability | Slightly positive net margin (1.07%) but negative ROIC (-0.61%); value destroying but improving profitability |
| Innovation | Strong SaaS growth suggests innovation in cloud solutions | Consistent revenue growth in subscription services indicates innovation focus |
| Global presence | Established presence with diversified customer segments | Global leader in identity management with expanding market reach |
| Market Share | Smaller market share with $939M total revenue in 2024 | Larger market share with $2.6B+ subscription revenue in 2025 |
CyberArk shows strong SaaS growth but struggles with value creation and profitability, while Okta leads in revenue scale and improving profitability despite ongoing value destruction. Investors should weigh Okta’s growth momentum against CyberArk’s innovation potential and current financial challenges.
Risk Analysis
Below is a comparative table highlighting key risks for CyberArk Software Ltd. (CYBR) and Okta, Inc. (OKTA) based on the most recent data from 2025-2026.
| Metric | CyberArk Software Ltd. (CYBR) | Okta, Inc. (OKTA) |
|---|---|---|
| Market Risk | Moderate (Beta 0.915) | Moderate-Low (Beta 0.76) |
| Debt level | Very Low (Debt/Equity 0.01) | Low (Debt/Equity 0.15) |
| Regulatory Risk | Moderate (Global operations) | Moderate (US-focused) |
| Operational Risk | Moderate (Security software) | Moderate (Cloud identity) |
| Environmental Risk | Low (Software industry) | Low (Software industry) |
| Geopolitical Risk | Moderate (Israel HQ) | Low (US HQ) |
The most likely and impactful risks for CyberArk are operational challenges and geopolitical tensions due to its Israeli base, while Okta faces moderate operational risk with relatively lower geopolitical exposure. Both companies maintain low debt levels, reducing financial risk.
Which Stock to Choose?
CyberArk Software Ltd. (CYBR) shows a strong revenue growth of 33.1% in 2024, with favorable gross margin at 79.18%, but suffers from negative net margin (-9.34%) and declining profitability. Its financial ratios are slightly unfavorable overall, with low debt levels and a very favorable rating, although it is destroying value with a very unfavorable moat evaluation.
Okta, Inc. (OKTA) reports steady revenue growth of 15.33% in 2025 and positive net margin (1.07%) with a favorable income statement evaluation. Its financial ratios present a neutral global opinion, supported by a very favorable rating and a slightly unfavorable moat, indicating growing profitability despite value destruction.
Investors with a growth orientation might find Okta’s improving profitability and favorable income statement more appealing, while those tolerant of risk could interpret CyberArk’s strong revenue gains and low debt as potential opportunities despite weaker profitability and value destruction signals.
Disclaimer: Investment carries a risk of loss of initial capital. The past performance is not a reliable indicator of future results. Be sure to understand risks before making an investment decision.
Go Further
I encourage you to read the complete analyses of CyberArk Software Ltd. and Okta, Inc. to enhance your investment decisions: