In the fast-evolving technology sector, CyberArk Software Ltd. and Oddity Tech Ltd. stand out with unique approaches to innovation and market presence. Both Israeli companies operate in the software infrastructure space but serve distinctly different markets—CyberArk focuses on cybersecurity solutions, while Oddity leads in consumer-tech beauty and wellness products. This article will analyze their strengths and risks to determine which offers the most compelling investment opportunity.

Table of contents
Companies Overview
I will begin the comparison between CyberArk Software Ltd. and Oddity Tech Ltd. by providing an overview of these two companies and their main differences.
CyberArk Overview
CyberArk Software Ltd. specializes in software-based security solutions, focusing on privileged access management and identity services. Established in 1999 and headquartered in Petah Tikva, Israel, it serves industries such as financial services, healthcare, and government agencies globally. With a market cap of 22.9B USD, CyberArk emphasizes risk-based credential security and cloud entitlement management through a broad product portfolio.
Oddity Overview
Oddity Tech Ltd., founded in 2013 and based in Tel Aviv-Jaffa, Israel, operates as a consumer-tech company with a focus on beauty and wellness products powered by digital-first branding. Its offerings include skincare and cosmetics under the IL MAKIAGE and SpoiledChild brands. Oddity has a market cap of 2.0B USD and aims to disrupt offline-dominated markets using its proprietary PowerMatch technology.
Key similarities and differences
Both companies operate within the technology sector and trade on NASDAQ, but CyberArk focuses on infrastructure software security solutions while Oddity is a consumer-tech company in beauty and wellness. CyberArk’s larger scale and diverse B2B customer base contrast with Oddity’s digital-first brand strategy targeting consumers. Additionally, CyberArk has a lower beta of 0.915 compared to Oddity’s higher volatility at 3.184, reflecting differing risk profiles.
Income Statement Comparison
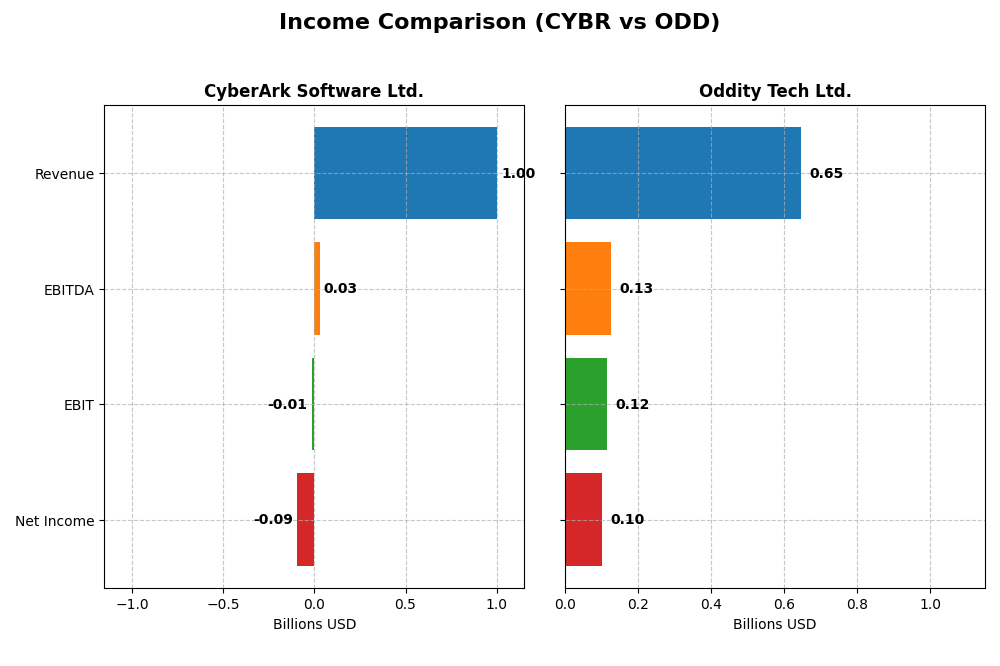
The table below presents a side-by-side comparison of key income statement metrics for CyberArk Software Ltd. and Oddity Tech Ltd. for the most recent fiscal year 2024.
| Metric | CyberArk Software Ltd. | Oddity Tech Ltd. |
|---|---|---|
| Market Cap | 22.9B | 2.01B |
| Revenue | 1.00B | 647M |
| EBITDA | 29M | 125M |
| EBIT | -13M | 116M |
| Net Income | -93M | 101M |
| EPS | -2.12 | 1.78 |
| Fiscal Year | 2024 | 2024 |
Income Statement Interpretations
CyberArk Software Ltd.
CyberArk’s revenue grew significantly over 2020-2024, reaching $1.0B in 2024 with a gross margin of 79.18%, which is favorable. However, net income remained negative, with a net loss of $93M in 2024 and a negative net margin of -9.34%. Despite a 33.1% revenue increase in 2024, net margin and EPS declined, reflecting persistent profitability challenges.
Oddity Tech Ltd.
Oddity Tech showed strong revenue growth from $111M in 2020 to $647M in 2024, with a gross margin of 72.38% and a positive net income of $101M in 2024. Margins improved steadily, with a net margin of 15.69% and EBIT margin of 17.87% in 2024. The company posted substantial growth in revenue and net income, with favorable expansions in profitability and EPS.
Which one has the stronger fundamentals?
Oddity Tech demonstrates stronger fundamentals with consistent revenue and net income growth, positive and improving margins, and favorable profitability ratios. Conversely, CyberArk, despite growing revenues and gross profit, struggles with negative net income and margins. Oddity’s full favorable income statement evaluation contrasts with CyberArk’s mixed and partially unfavorable profitability metrics.
Financial Ratios Comparison
Below is a comparison of key financial ratios for CyberArk Software Ltd. (CYBR) and Oddity Tech Ltd. (ODD) for the fiscal year 2024.
| Ratios | CyberArk Software Ltd. (CYBR) | Oddity Tech Ltd. (ODD) |
|---|---|---|
| ROE | -3.94% | 35.95% |
| ROIC | -2.85% | 28.56% |
| P/E | -157.5 | 23.75 |
| P/B | 6.21 | 8.54 |
| Current Ratio | 1.48 | 1.79 |
| Quick Ratio | 1.48 | 0.99 |
| D/E (Debt-to-Equity) | 0.012 | 0.080 |
| Debt-to-Assets | 0.009 | 0.052 |
| Interest Coverage | -17.9 | 1521 |
| Asset Turnover | 0.30 | 1.47 |
| Fixed Asset Turnover | 51.11 | 19.38 |
| Payout Ratio | 0 | 0 |
| Dividend Yield | 0 | 0 |
Interpretation of the Ratios
CyberArk Software Ltd.
CyberArk exhibits a mixed financial profile with several unfavorable ratios, including negative net margin (-9.34%) and return on equity (-3.94%), signaling profitability challenges. Positive aspects include a low debt-to-equity ratio (0.01) and strong fixed asset turnover (51.11). The company does not pay dividends, likely reflecting a reinvestment strategy amid ongoing growth and operational restructuring.
Oddity Tech Ltd.
Oddity Tech shows predominantly favorable ratios, with a strong net margin of 15.69%, return on equity of 35.95%, and solid return on invested capital at 28.56%, indicating robust profitability. Despite a relatively high price-to-book ratio (8.54) and an unfavorable WACC (18.68%), liquidity and leverage ratios remain healthy. Oddity does not pay dividends, possibly focusing on growth and reinvestment in its consumer-tech business.
Which one has the best ratios?
Oddity Tech’s ratios are overall more favorable, with a majority of metrics indicating strong profitability, solid returns, and sound financial health. CyberArk, while showing some strengths in liquidity and asset efficiency, faces multiple unfavorable profitability and coverage ratios. Based on the data, Oddity Tech demonstrates a stronger financial position in 2024.
Strategic Positioning
This section compares the strategic positioning of CyberArk Software Ltd. and Oddity Tech Ltd. based on Market position, Key segments, and exposure to technological disruption:
CyberArk Software Ltd.
- Market leader in software-based security with a large market cap of 23B USD and moderate competitive pressure.
- Key segments include SaaS security solutions, perpetual licenses, and professional services serving diverse industries globally.
- Exposure to disruption moderate, focused on cloud, SaaS security innovations, and identity and access management services.
Oddity Tech Ltd.
- Smaller player with 2B USD market cap focusing on consumer-tech beauty and wellness sectors.
- Concentrated on digital beauty and wellness brands leveraging proprietary PowerMatch technology.
- Faces disruption by digitizing offline beauty and wellness industries through digital-first brand scaling.
CyberArk Software Ltd. vs Oddity Tech Ltd. Positioning
CyberArk adopts a diversified approach across multiple industries with broad security solutions, benefiting from scale but facing complex market dynamics. Oddity Tech concentrates on niche consumer beauty-tech, enabling focused innovation but with narrower market scope and higher volatility risk.
Which has the best competitive advantage?
Oddity Tech demonstrates a very favorable moat with growing ROIC and value creation, indicating durable competitive advantage. CyberArk shows very unfavorable moat metrics with declining ROIC and value destruction, reflecting weaker competitive positioning.
Stock Comparison
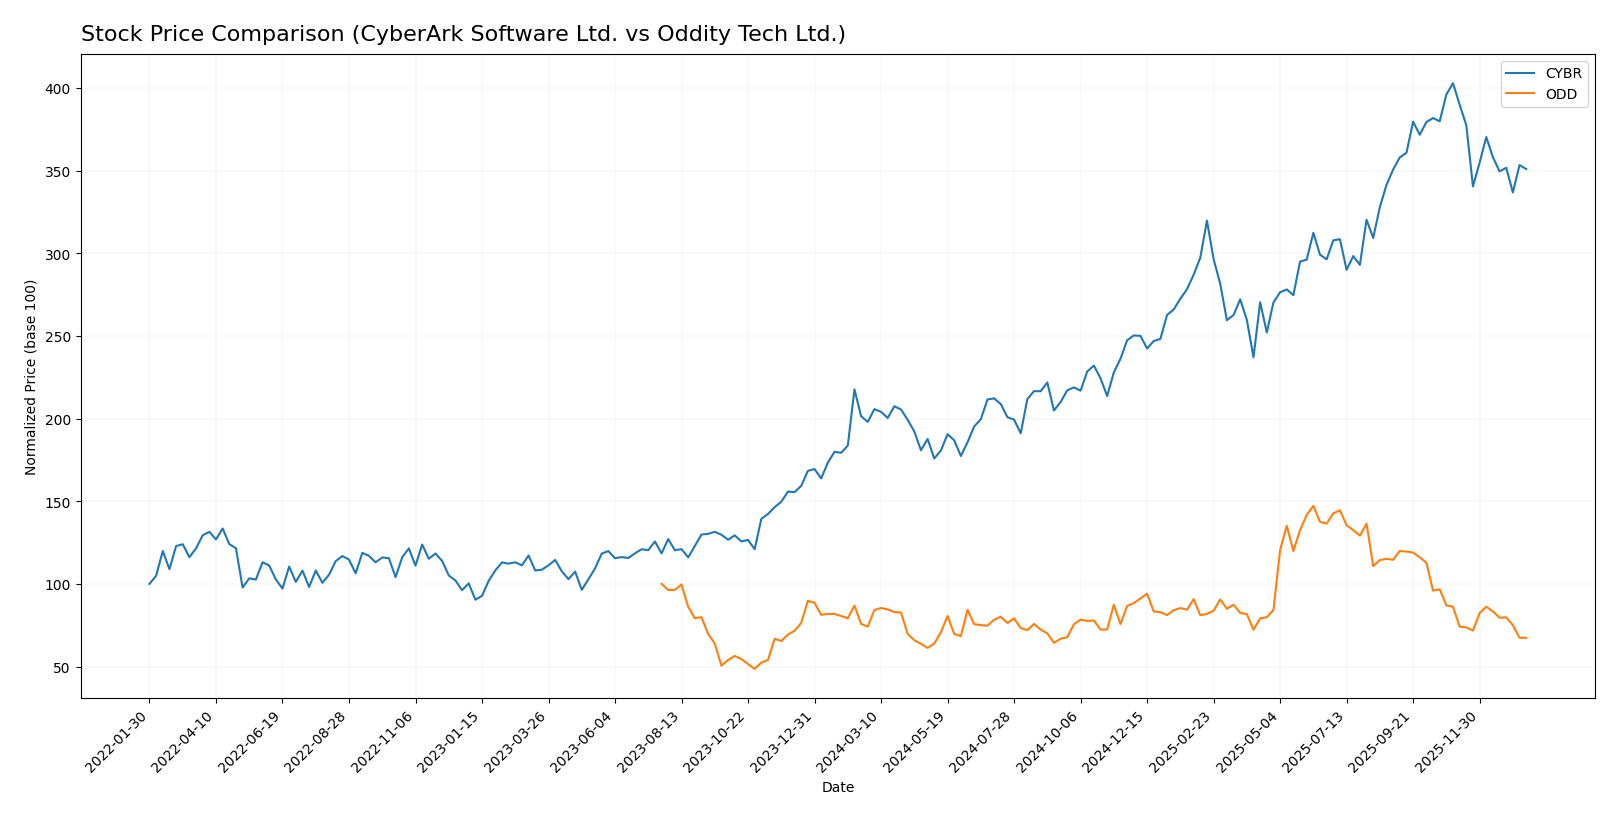
The past year saw CyberArk Software Ltd. (CYBR) exhibit a strong 77.27% price increase with decelerating momentum, while Oddity Tech Ltd. (ODD) experienced a 9.16% decline, both showing seller dominance in recent trading activity.
Trend Analysis
CyberArk Software Ltd. showed a bullish trend with a 77.27% price rise over the past 12 months, though momentum decelerated. The stock traded between 227.32 and 520.78, with significant volatility (std dev 82.45).
Oddity Tech Ltd. recorded a bearish trend, falling 9.16% over the past year with decelerating losses. Price fluctuated from 32.19 to 77.35, showing lower volatility (std dev 11.75).
Comparing both, CyberArk delivered the highest market performance with a strong positive gain, whereas Oddity Tech’s stock declined over the same period.
Target Prices
The current analyst consensus for target prices shows a cautiously optimistic outlook for both CyberArk Software Ltd. and Oddity Tech Ltd.
| Company | Target High | Target Low | Consensus |
|---|---|---|---|
| CyberArk Software Ltd. | 520 | 440 | 479.22 |
| Oddity Tech Ltd. | 80 | 40 | 66.33 |
Analysts expect CyberArk’s price to appreciate moderately above its current $453.65, while Oddity Tech’s consensus target price implies significant upside potential from its $35.40 market price.
Analyst Opinions Comparison
This section compares analysts’ ratings and grades for CyberArk Software Ltd. and Oddity Tech Ltd.:
Rating Comparison
CyberArk Software Ltd. Rating
- Rating: C-, considered very favorable overall.
- Discounted Cash Flow Score: 3, indicating a moderate valuation outlook.
- ROE Score: 1, very unfavorable efficiency in generating equity returns.
- ROA Score: 1, very unfavorable asset utilization.
- Debt To Equity Score: 2, moderate financial risk level.
- Overall Score: 1, very unfavorable summary financial standing.
Oddity Tech Ltd. Rating
- Rating: B+, considered very favorable overall.
- Discounted Cash Flow Score: 4, reflecting a favorable valuation.
- ROE Score: 5, very favorable efficiency generating shareholder profit.
- ROA Score: 4, favorable asset utilization.
- Debt To Equity Score: 3, moderate financial risk level.
- Overall Score: 3, moderate summary financial standing.
Which one is the best rated?
Based on the data, Oddity Tech Ltd. holds higher ratings and better scores across key financial metrics compared to CyberArk Software Ltd., making it the better rated company strictly by provided evaluations.
Scores Comparison
Here is a comparison of the Altman Z-Score and Piotroski Score for CyberArk and Oddity Tech:
CyberArk Scores
- Altman Z-Score: 6.52, indicating a safe zone and low bankruptcy risk.
- Piotroski Score: 3, classified as very weak financial strength.
Oddity Tech Scores
- Altman Z-Score: 3.78, indicating a safe zone and low bankruptcy risk.
- Piotroski Score: 6, classified as average financial strength.
Which company has the best scores?
Based strictly on the data, CyberArk shows a higher Altman Z-Score, signaling stronger bankruptcy safety, whereas Oddity Tech has a notably better Piotroski Score, reflecting stronger overall financial health.
Grades Comparison
Here is a comparison of the recent grades assigned to CyberArk Software Ltd. and Oddity Tech Ltd.:
CyberArk Software Ltd. Grades
The following table shows recent grades from reputable grading companies for CyberArk Software Ltd.:
| Grading Company | Action | New Grade | Date |
|---|---|---|---|
| Oppenheimer | Maintain | Outperform | 2024-10-22 |
| Keybanc | Maintain | Overweight | 2024-10-18 |
| Mizuho | Maintain | Outperform | 2024-10-17 |
| BTIG | Maintain | Buy | 2024-10-09 |
| Barclays | Maintain | Overweight | 2024-10-07 |
| Wedbush | Maintain | Outperform | 2024-10-01 |
| Jefferies | Maintain | Buy | 2024-09-24 |
| DA Davidson | Maintain | Buy | 2024-08-09 |
| Rosenblatt | Maintain | Buy | 2024-08-09 |
| Susquehanna | Maintain | Positive | 2024-08-09 |
CyberArk’s grades consistently indicate strong positive sentiment with repeated “Buy,” “Outperform,” and “Overweight” ratings from multiple well-known firms.
Oddity Tech Ltd. Grades
The following table presents recent grades from recognized grading companies for Oddity Tech Ltd.:
| Grading Company | Action | New Grade | Date |
|---|---|---|---|
| Keybanc | Maintain | Overweight | 2026-01-08 |
| JP Morgan | Maintain | Overweight | 2025-12-12 |
| JP Morgan | Maintain | Overweight | 2025-11-21 |
| Barclays | Maintain | Equal Weight | 2025-11-21 |
| Morgan Stanley | Maintain | Equal Weight | 2025-11-21 |
| Needham | Maintain | Buy | 2025-11-20 |
| Keybanc | Maintain | Overweight | 2025-10-08 |
| JMP Securities | Maintain | Market Outperform | 2025-09-23 |
| Morgan Stanley | Maintain | Equal Weight | 2025-08-06 |
| JMP Securities | Maintain | Market Outperform | 2025-08-05 |
Oddity Tech’s grades show a mix of “Overweight,” “Market Outperform,” and “Equal Weight” ratings, reflecting moderate to positive analyst sentiment.
Which company has the best grades?
CyberArk Software Ltd. has received a more consistently positive grading consensus, dominated by “Buy” and “Outperform” ratings, compared to Oddity Tech Ltd., whose grades are mostly “Overweight” and “Equal Weight.” This suggests CyberArk may be viewed more favorably by analysts, potentially impacting investor confidence and portfolio allocation decisions accordingly.
Strengths and Weaknesses
Below is a comparative overview of key strengths and weaknesses for CyberArk Software Ltd. (CYBR) and Oddity Tech Ltd. (ODD) based on the most recent financial and operational data.
| Criterion | CyberArk Software Ltd. (CYBR) | Oddity Tech Ltd. (ODD) |
|---|---|---|
| Diversification | Moderate: multiple revenue streams including SaaS and subscriptions, but heavy reliance on maintenance and support | Limited data on revenue segmentation, but strong focus on core competencies |
| Profitability | Unfavorable: negative net margin (-9.34%) and ROIC (-2.85%) with declining trend; value destroying | Favorable: strong net margin (15.69%), ROIC (28.56%), and growing profitability; value creating |
| Innovation | Moderate: shift towards SaaS growth, but declining ROIC signals risk in sustaining innovation | High: consistent ROIC growth and profitability indicate robust innovation and competitive edge |
| Global presence | Established global presence with diversified customer base | Global presence data limited but financial strength suggests potential for expansion |
| Market Share | Stable but challenged by profitability issues and competition | Likely growing, supported by strong financials and operational efficiency |
Key takeaways: Oddity Tech Ltd. demonstrates a very favorable economic moat with growing profitability and efficient capital use, making it a stronger candidate for investment. CyberArk, despite a diverse product mix, faces profitability challenges and declining returns, warranting cautious consideration and risk management.
Risk Analysis
Below is a comparative table outlining key risk metrics for CyberArk Software Ltd. (CYBR) and Oddity Tech Ltd. (ODD) based on the most recent 2024 data.
| Metric | CyberArk Software Ltd. (CYBR) | Oddity Tech Ltd. (ODD) |
|---|---|---|
| Market Risk | Beta 0.915 (moderate) | Beta 3.184 (high volatility) |
| Debt Level | Debt-to-equity 0.01 (very low) | Debt-to-equity 0.08 (low) |
| Regulatory Risk | Moderate (global security standards) | Moderate (consumer product regulations) |
| Operational Risk | Medium (security software complexity) | Medium (scaling digital-first brands) |
| Environmental Risk | Low (software industry) | Low (consumer tech/beauty sector) |
| Geopolitical Risk | Moderate (based in Israel, global sales) | Moderate (Israel-based, global operations) |
The most impactful risks are Oddity Tech’s high market volatility (beta 3.184) posing liquidity and price fluctuation challenges, and CyberArk’s operational risks linked to evolving cybersecurity threats. Both operate under moderate geopolitical and regulatory exposure due to their Israeli base and international presence. Debt levels remain low for both, reducing financial risk. Given Oddity’s stronger profitability but higher volatility, risk management is crucial in portfolio allocation.
Which Stock to Choose?
CyberArk Software Ltd. (CYBR) shows a 33.1% revenue growth in 2024 but suffers from negative profitability with a -9.34% net margin and declining returns on equity and invested capital. Its debt levels are low, yet financial ratios are slightly unfavorable with a very favorable rating of C-. The company is value-destructive with a very unfavorable moat status.
Oddity Tech Ltd. (ODD) exhibits strong income growth, including a 27.2% revenue increase and a 15.69% net margin in 2024. Its financial ratios are mostly favorable, boasting high returns on equity (35.95%) and invested capital (28.56%), albeit with higher WACC. The rating is very favorable at B+, supported by a very favorable moat and durable competitive advantages.
Investors favoring growth and strong profitability might find Oddity Tech’s robust income and favorable financial ratios appealing, while those more cautious could see CyberArk’s low debt and moderate rating as signals to monitor. Oddity Tech’s superior rating and value-creating profile suggest it could be more attractive for investors with a tolerance for risk and focus on value creation.
Disclaimer: Investment carries a risk of loss of initial capital. The past performance is not a reliable indicator of future results. Be sure to understand risks before making an investment decision.
Go Further
I encourage you to read the complete analyses of CyberArk Software Ltd. and Oddity Tech Ltd. to enhance your investment decisions: