In the rapidly evolving software infrastructure sector, CyberArk Software Ltd. and Nutanix, Inc. stand out as influential players shaping enterprise technology. Both companies offer innovative solutions targeting cloud, virtualization, and security challenges, making their market overlap particularly compelling. This article will explore their strengths and strategies to help you decide which company presents the most attractive investment opportunity in 2026.
Table of contents
Companies Overview
I will begin the comparison between CyberArk Software Ltd. and Nutanix, Inc. by providing an overview of these two companies and their main differences.
CyberArk Software Ltd. Overview
CyberArk Software Ltd. specializes in software-based security solutions, focusing on privileged access management and identity services. Founded in 1999 and headquartered in Petah Tikva, Israel, CyberArk serves various industries through direct sales and partners. With a market cap of $22.9B and around 3,800 employees, it offers SaaS products designed to protect credentials and manage access risks across cloud and endpoint environments.
Nutanix, Inc. Overview
Nutanix, Inc., based in San Jose, California, provides an enterprise cloud platform combining virtualization, storage, and cloud orchestration services. Founded in 2009, Nutanix supports hybrid cloud environments with products for automation, database management, and virtual desktops. The company has a market cap of $12.4B and employs about 7,150 people, serving diverse sectors globally with a focus on cloud infrastructure solutions.
Key similarities and differences
Both CyberArk and Nutanix operate in the Software – Infrastructure sector, targeting enterprise clients across multiple industries worldwide. CyberArk emphasizes security and identity management solutions, while Nutanix focuses on cloud infrastructure and virtualization. CyberArk’s workforce is smaller but it commands a larger market cap, reflecting its niche in cybersecurity compared to Nutanix’s broader cloud platform offerings.
Income Statement Comparison
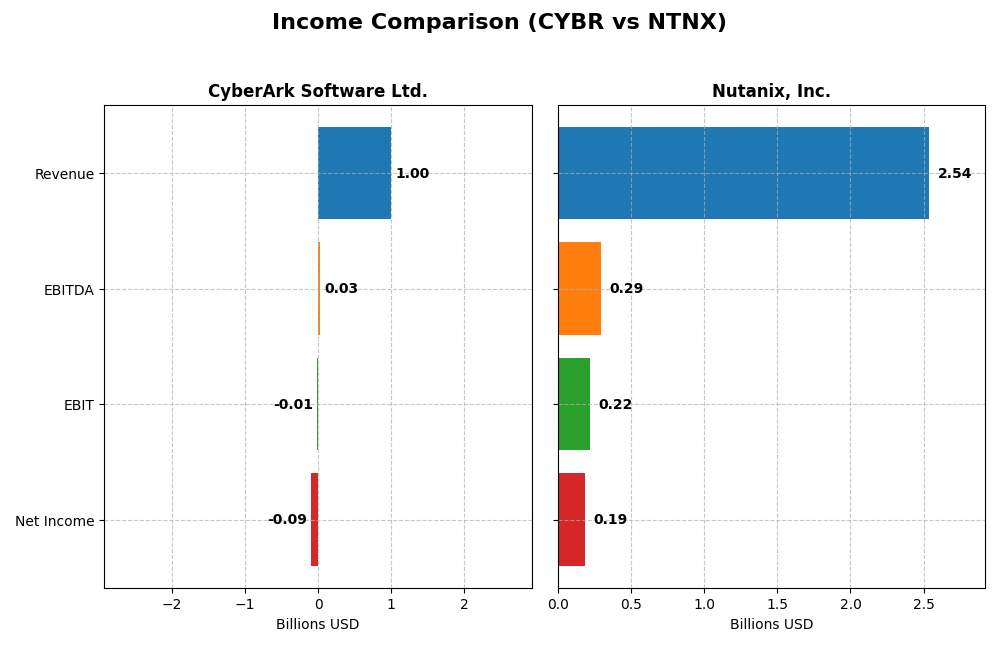
This table presents a side-by-side comparison of key income statement metrics for CyberArk Software Ltd. and Nutanix, Inc., based on their most recent fiscal year data.
| Metric | CyberArk Software Ltd. (CYBR) | Nutanix, Inc. (NTNX) |
|---|---|---|
| Market Cap | 22.9B | 12.4B |
| Revenue | 1.00B | 2.54B |
| EBITDA | 28.7M | 293M |
| EBIT | -13.3M | 220M |
| Net Income | -93.5M | 188M |
| EPS | -2.12 | 0.70 |
| Fiscal Year | 2024 | 2025 |
Income Statement Interpretations
CyberArk Software Ltd.
CyberArk’s revenue showed a strong upward trend, rising from $464M in 2020 to over $1B in 2024, a 115% increase. However, net income remained negative throughout, deepening losses to -$93M in 2024. Gross margins stayed robust near 79%, but EBIT and net margins remained unfavorable. The latest year showed solid revenue growth of 33%, yet net profits declined further.
Nutanix, Inc.
Nutanix demonstrated impressive revenue growth from $1.39B in 2021 to $2.54B in 2025, an 82% increase, with net income turning positive to $188M in 2025 after prior losses. Gross margins improved to 87%, and net margins reached 7.4%. The recent year showed strong growth in revenue (18%), EBIT (223%), and net income (228%), signaling improving profitability and margin expansion.
Which one has the stronger fundamentals?
Nutanix exhibits stronger fundamentals with consistent revenue growth, expanding gross and net margins, and a positive shift to profitability. CyberArk, while growing revenue substantially, continued to report losses and unfavorable profitability metrics. Nutanix’s broader favorable income statement indicators contrast with CyberArk’s mixed performance, suggesting more robust earnings quality and margin improvements.
Financial Ratios Comparison
This table presents the key financial ratios for CyberArk Software Ltd. and Nutanix, Inc. based on the most recent fiscal year data available.
| Ratios | CyberArk Software Ltd. (2024) | Nutanix, Inc. (2025) |
|---|---|---|
| ROE | -3.94% | -27.12% |
| ROIC | -2.85% | 8.11% |
| P/E | -157.49 | 106.74 |
| P/B | 6.21 | -28.95 |
| Current Ratio | 1.48 | 1.72 |
| Quick Ratio | 1.48 | 1.72 |
| D/E (Debt-to-Equity) | 0.01 | -2.14 |
| Debt-to-Assets | 0.009 | 0.45 |
| Interest Coverage | -17.90 | 8.75 |
| Asset Turnover | 0.30 | 0.77 |
| Fixed Asset Turnover | 51.11 | 9.15 |
| Payout ratio | 0% | 0% |
| Dividend yield | 0% | 0% |
Interpretation of the Ratios
CyberArk Software Ltd.
CyberArk exhibits mixed financial ratios with a slightly unfavorable overall stance. Key concerns include negative net margin (-9.34%) and return on equity (-3.94%), alongside weak asset turnover (0.3). However, low debt-to-equity (0.01) and favorable fixed asset turnover (51.11) highlight strengths. CyberArk does not pay dividends, likely prioritizing reinvestment in growth and R&D.
Nutanix, Inc.
Nutanix shows a slightly favorable ratio profile with strengths in current ratio (1.72), interest coverage (11.15), and a favorable weighted average cost of capital (5.89%). Despite a negative return on equity (-27.12%) and an unfavorable price-to-earnings ratio (106.74), it maintains a solid asset turnover (0.77). Nutanix also pays no dividends, focusing on expansion and product development.
Which one has the best ratios?
Nutanix’s ratios appear more favorable overall, with half rated positively and fewer unfavorable metrics compared to CyberArk. Although both companies do not distribute dividends, Nutanix’s stronger liquidity, coverage, and capital efficiency ratios provide a comparatively superior financial standing based on the data.
Strategic Positioning
This section compares the strategic positioning of CyberArk Software Ltd. and Nutanix, Inc., focusing on Market position, Key segments, and Exposure to technological disruption:
CyberArk Software Ltd.
- Leading cybersecurity provider with strong presence in software infrastructure, facing moderate competitive pressure.
- Key segments include privileged access management, SaaS security, and identity management across multiple industries.
- Exposure to disruption through cloud-native security and SaaS innovations targeting risk reduction and identity services.
Nutanix, Inc.
- Enterprise cloud platform provider with broad software infrastructure offerings and competitive market dynamics.
- Focused on enterprise cloud solutions, virtualization, automation, and hybrid cloud orchestration services.
- Technological disruption addressed via Kubernetes management, hybrid cloud, and database-as-a-service solutions.
CyberArk Software Ltd. vs Nutanix, Inc. Positioning
CyberArk’s strategy centers on specialized cybersecurity products with diversified industry applications, while Nutanix pursues a broader enterprise cloud platform approach. CyberArk’s focus on privileged access contrasts with Nutanix’s emphasis on virtualization and cloud orchestration, each with distinct market advantages and challenges.
Which has the best competitive advantage?
Nutanix exhibits a very favorable moat with growing ROIC, indicating durable competitive advantage and increasing profitability. CyberArk shows a very unfavorable moat with declining ROIC, signaling value destruction and weakening profitability.
Stock Comparison
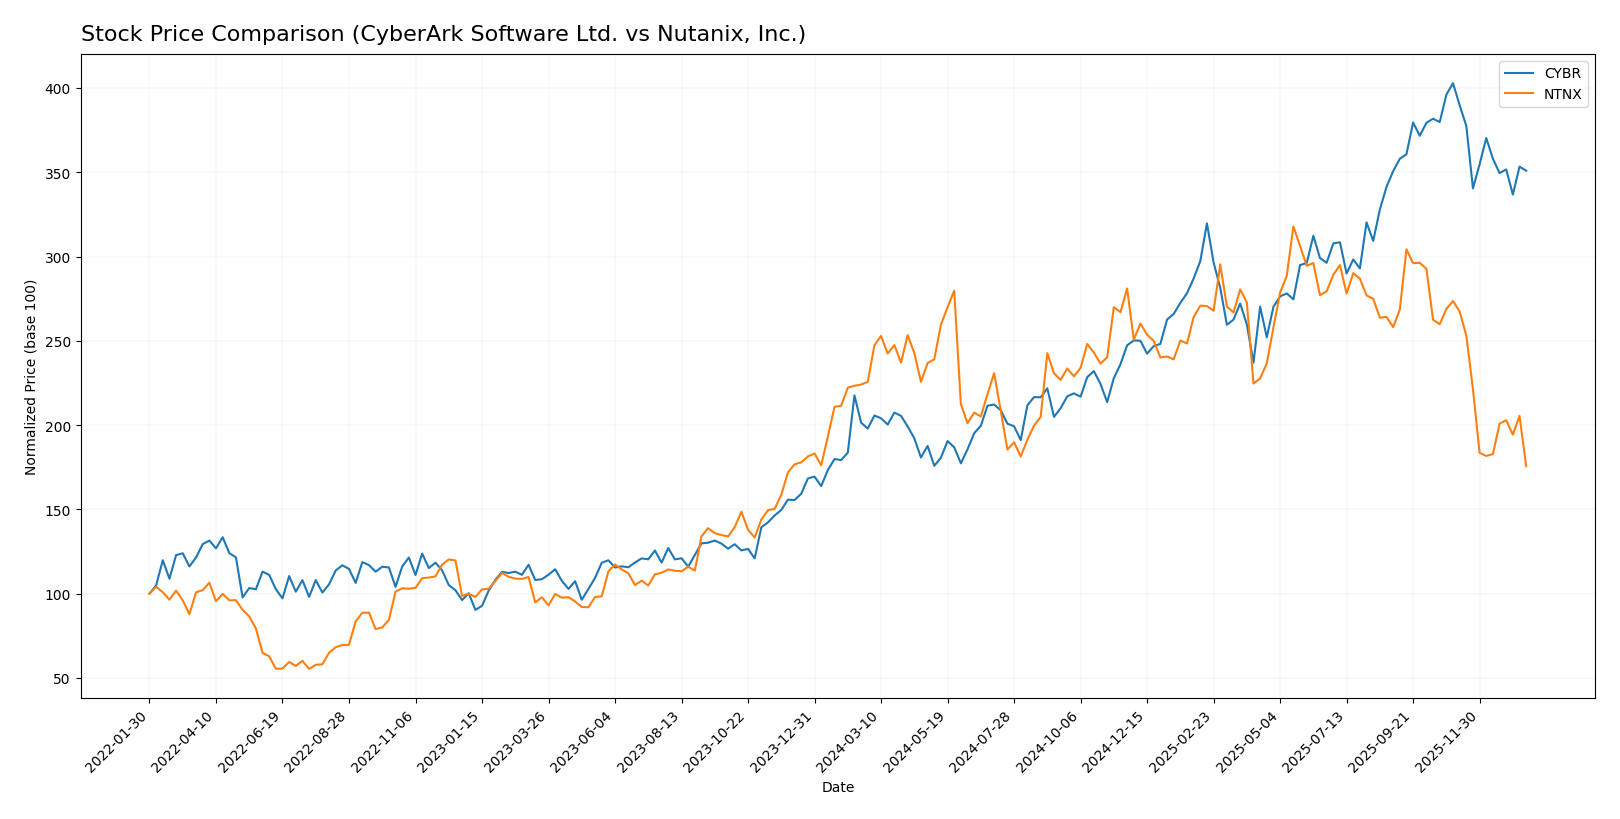
The stock price chart highlights significant divergence in performance and trading activity between CyberArk Software Ltd. and Nutanix, Inc. over the past 12 months, with CyberArk showing notable gains while Nutanix experienced declines.
Trend Analysis
CyberArk Software Ltd. has demonstrated a strong bullish trend over the past year with a 77.27% price increase, though the trend shows deceleration and high volatility, peaking at 520.78 and bottoming at 227.32. Recent months indicate a short-term pullback of -12.89%.
Nutanix, Inc. has faced a bearish trend with a -22.16% price decline over the same period, alongside decelerating downward momentum. The stock’s volatility is lower, with a high of 82.77 and a low of 45.74. Recent trend continuation shows a further -35.79% drop.
Comparing the two, CyberArk clearly delivered the highest market performance over the past year, contrasting with Nutanix’s sustained negative trajectory.
Target Prices
Analysts provide a positive outlook with clear target price ranges for CyberArk Software Ltd. and Nutanix, Inc.
| Company | Target High | Target Low | Consensus |
|---|---|---|---|
| CyberArk Software Ltd. | 520 | 440 | 479.22 |
| Nutanix, Inc. | 90 | 53 | 64.67 |
The consensus target for CyberArk suggests a moderate upside potential above its current price of 453.65 USD, while Nutanix’s consensus indicates a possible increase from 45.74 USD, reflecting cautious optimism among analysts.
Analyst Opinions Comparison
This section compares analysts’ ratings and grades for CyberArk Software Ltd. and Nutanix, Inc.:
Rating Comparison
CyberArk Software Ltd. Rating
- Rating: C-, rated Very Favorable
- Discounted Cash Flow Score: 3, Moderate status
- ROE Score: 1, Very Unfavorable status
- ROA Score: 1, Very Unfavorable status
- Debt To Equity Score: 2, Moderate status
- Overall Score: 1, Very Unfavorable status
Nutanix, Inc. Rating
- Rating: C+, rated Very Favorable
- Discounted Cash Flow Score: 4, Favorable status
- ROE Score: 1, Very Unfavorable status
- ROA Score: 4, Favorable status
- Debt To Equity Score: 1, Very Unfavorable status
- Overall Score: 2, Moderate status
Which one is the best rated?
Based strictly on the provided data, Nutanix holds a higher rating (C+) and better overall score (2) than CyberArk’s C- and overall score of 1. Nutanix performs stronger in discounted cash flow and return on assets, while CyberArk has a moderately better debt to equity score.
Scores Comparison
Here is a comparison of CyberArk and Nutanix scores based on Altman Z-Score and Piotroski Score:
CyberArk Scores
- Altman Z-Score: 6.52, indicating a safe zone and low bankruptcy risk.
- Piotroski Score: 3, classified as very weak financial health.
Nutanix Scores
- Altman Z-Score: 1.48, indicating a distress zone with high bankruptcy risk.
- Piotroski Score: 6, reflecting average financial health.
Which company has the best scores?
CyberArk has a significantly better Altman Z-Score, indicating stronger bankruptcy safety. Nutanix scores better on Piotroski, showing relatively stronger financial health. Overall, each company leads in one score category based on the data provided.
Grades Comparison
Here is a factual comparison of the recent grades assigned to CyberArk Software Ltd. and Nutanix, Inc.:
CyberArk Software Ltd. Grades
The table below summarizes the latest grades from recognized financial institutions for CyberArk Software Ltd.:
| Grading Company | Action | New Grade | Date |
|---|---|---|---|
| Oppenheimer | Maintain | Outperform | 2024-10-22 |
| Keybanc | Maintain | Overweight | 2024-10-18 |
| Mizuho | Maintain | Outperform | 2024-10-17 |
| BTIG | Maintain | Buy | 2024-10-09 |
| Barclays | Maintain | Overweight | 2024-10-07 |
| Wedbush | Maintain | Outperform | 2024-10-01 |
| Jefferies | Maintain | Buy | 2024-09-24 |
| DA Davidson | Maintain | Buy | 2024-08-09 |
| Rosenblatt | Maintain | Buy | 2024-08-09 |
| Susquehanna | Maintain | Positive | 2024-08-09 |
CyberArk’s grades consistently show strong buy-side sentiment with no downgrades or negative outlooks reported.
Nutanix, Inc. Grades
Below is a table reflecting the latest grades from reputable agencies for Nutanix, Inc.:
| Grading Company | Action | New Grade | Date |
|---|---|---|---|
| Barclays | Downgrade | Equal Weight | 2026-01-15 |
| Morgan Stanley | Downgrade | Equal Weight | 2026-01-12 |
| RBC Capital | Maintain | Outperform | 2026-01-05 |
| Goldman Sachs | Maintain | Buy | 2025-11-28 |
| JP Morgan | Maintain | Overweight | 2025-11-26 |
| Needham | Maintain | Buy | 2025-11-26 |
| Wells Fargo | Maintain | Equal Weight | 2025-11-26 |
| Morgan Stanley | Maintain | Overweight | 2025-11-26 |
| Keybanc | Maintain | Overweight | 2025-11-26 |
| Piper Sandler | Maintain | Overweight | 2025-11-26 |
Nutanix shows mixed ratings with recent downgrades to Equal Weight by Barclays and Morgan Stanley, indicating some caution, but also retains several Buy and Overweight recommendations.
Which company has the best grades?
CyberArk Software Ltd. has received a stronger and more consistent set of buy and outperform grades compared to Nutanix, Inc., which faces recent downgrades and more cautious ratings. Investors may interpret CyberArk’s steady positive grades as a sign of analyst confidence, while Nutanix’s mixed signals suggest a more cautious outlook.
Strengths and Weaknesses
Below is a comparative summary of key strengths and weaknesses for CyberArk Software Ltd. (CYBR) and Nutanix, Inc. (NTNX) based on their recent financial and operational data.
| Criterion | CyberArk Software Ltd. (CYBR) | Nutanix, Inc. (NTNX) |
|---|---|---|
| Diversification | Moderate: Mix of SaaS, Self Hosted Subscription, and Maintenance (SaaS $469M, Self Hosted $265M in 2024) | Strong: Predominantly Subscription & Circulation ($2.02B in 2024) plus Professional Services |
| Profitability | Weak: Negative net margin (-9.34%) and ROIC (-2.85%), value destroying | Moderate: Positive net margin (7.42%), ROIC at 8.11%, value creating |
| Innovation | Moderate: Significant SaaS growth but declining ROIC trend | Strong: Growing ROIC trend, durable competitive advantage |
| Global presence | Established in cybersecurity niche with steady maintenance revenue | Broad cloud infrastructure presence with increasing subscription revenue |
| Market Share | Niche leader in privileged access management but facing profitability challenges | Expanding market share in hybrid cloud solutions with improving financial metrics |
Key takeaways: Nutanix demonstrates a stronger financial profile with growing profitability and a durable competitive advantage, supported by a diversified subscription model. CyberArk shows innovation in SaaS growth but struggles with profitability and value creation, highlighting higher investment risk.
Risk Analysis
Below is a comparative risk table for CyberArk Software Ltd. (CYBR) and Nutanix, Inc. (NTNX) based on their most recent financial and operational data in 2026.
| Metric | CyberArk Software Ltd. (CYBR) | Nutanix, Inc. (NTNX) |
|---|---|---|
| Market Risk | Moderate beta 0.915, stable within $288-$526 range | Low beta 0.49, recent 6% price drop indicates volatility |
| Debt level | Very low debt-to-equity 0.01, excellent interest coverage concerns (-3.27) | Moderate debt-to-assets 45.16%, good interest coverage 11.15 |
| Regulatory Risk | Moderate, operating internationally with strong compliance requirements | Moderate, exposure to multiple regions with evolving cloud regulations |
| Operational Risk | Slightly unfavorable net margin and ROE indicate profitability challenges | Mixed profitability metrics, but improving operational efficiency |
| Environmental Risk | Low, software sector with minimal direct environmental impact | Low, primarily cloud infrastructure with limited environmental footprint |
| Geopolitical Risk | Higher, headquartered in Israel with potential regional tensions | Moderate, US-based but global operations exposed to trade policies |
In summary, CyberArk faces notable operational and profitability risks with unfavorable margins and returns despite low leverage. Nutanix shows better financial stability but carries moderate debt and market volatility risks amplified by recent price corrections. Geopolitical factors weigh more heavily on CyberArk due to its location. Investors should weigh these risks carefully alongside growth prospects.
Which Stock to Choose?
CyberArk Software Ltd. (CYBR) shows a strong revenue growth of 33.1% in 2024, with a favorable gross margin of 79.18%. However, it suffers from negative profitability ratios, declining ROIC below WACC, and a very unfavorable global rating despite low debt levels.
Nutanix, Inc. (NTNX) reports solid income growth, with a 7.42% net margin and an improving ROIC above WACC, indicating value creation. Its financial ratios are slightly favorable overall, though it carries higher debt and shows mixed profitability and rating metrics.
Investors with a tolerance for risk and focus on growth might find NTNX appealing due to its favorable income evolution and durable competitive advantage, while those prioritizing lower leverage and financial stability might view CYBR’s conservative debt profile and neutral income statement as more fitting.
Disclaimer: Investment carries a risk of loss of initial capital. The past performance is not a reliable indicator of future results. Be sure to understand risks before making an investment decision.
Go Further
I encourage you to read the complete analyses of CyberArk Software Ltd. and Nutanix, Inc. to enhance your investment decisions: