In the ever-evolving technology sector, CyberArk Software Ltd. (CYBR) and Gen Digital Inc. (GEN) stand out as prominent players in software infrastructure, specializing in cybersecurity solutions. Both companies address critical security needs but focus on different market segments—enterprise versus consumer protection. Comparing their innovation strategies and market positions offers valuable insight. This article will help you decide which company might be the smarter addition to your investment portfolio.

Table of contents
Companies Overview
I will begin the comparison between CyberArk Software Ltd. and Gen Digital Inc. by providing an overview of these two companies and their main differences.
CyberArk Overview
CyberArk Software Ltd. develops and markets software-based security solutions primarily focused on privileged access management and identity security. Founded in 1999 and headquartered in Petah Tikva, Israel, CyberArk serves various industries including financial services, healthcare, and government agencies globally. Its offerings include SaaS and on-premises products designed to reduce risk by managing access across cloud and enterprise environments.
Gen Digital Overview
Gen Digital Inc., formerly NortonLifeLock, specializes in consumer cybersecurity and privacy solutions. Based in Tempe, Arizona, and founded in 1982, the company provides products like Norton 360, LifeLock identity protection, and VPN services. Gen Digital targets individual consumers worldwide through retail, telecom, and e-commerce channels, focusing on malware protection, identity theft prevention, and online privacy management.
Key similarities and differences
Both CyberArk and Gen Digital operate in the software infrastructure sector with a focus on cybersecurity, yet their target markets differ significantly. CyberArk concentrates on enterprise and government clients with privileged access management solutions, while Gen Digital addresses consumer cybersecurity needs including identity theft and privacy protection. They share a global presence but differ in product delivery models and customer bases, highlighting distinct strategic approaches within the cybersecurity landscape.
Income Statement Comparison
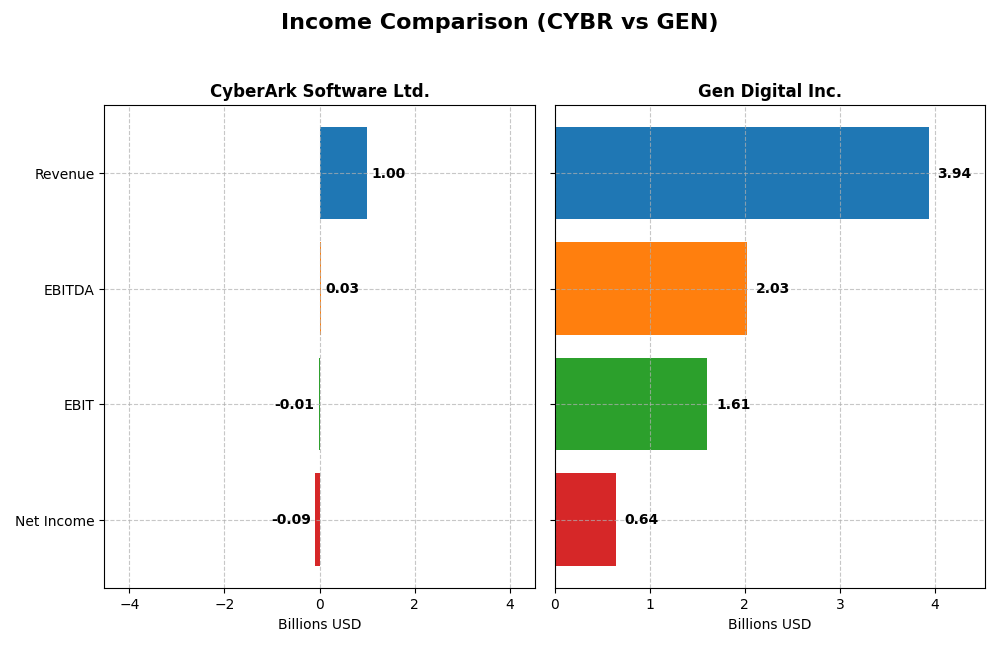
Below is a comparison of the most recent fiscal year income statement metrics for CyberArk Software Ltd. and Gen Digital Inc., highlighting key financial figures.
| Metric | CyberArk Software Ltd. (2024) | Gen Digital Inc. (2025) |
|---|---|---|
| Market Cap | 22.9B | 16.1B |
| Revenue | 1.00B | 3.94B |
| EBITDA | 29M | 2.03B |
| EBIT | -13M | 1.61B |
| Net Income | -93M | 643M |
| EPS | -2.12 | 1.04 |
| Fiscal Year | 2024 | 2025 |
Income Statement Interpretations
CyberArk Software Ltd.
CyberArk’s revenue grew significantly from $464M in 2020 to $1B in 2024, marking a 115% increase over five years. Despite strong revenue and gross profit growth at 33% year-over-year, operating and net margins remain negative, with a net margin of -9.34% in 2024. The company’s recent year saw improved EBIT growth by 78%, but net income and EPS declined further, indicating profitability challenges despite revenue expansion.
Gen Digital Inc.
Gen Digital’s revenue increased steadily from $2.55B in 2021 to $3.94B in 2025, reflecting a 54% growth over five years. The company maintains robust profitability with a 16.34% net margin and a strong 40.84% EBIT margin in 2025. Year-over-year growth slowed to around 3.5%, but operating expenses grew favorably relative to revenue, supporting a 44% EBIT increase and an 8.4% EPS rise, reflecting solid fundamentals and operational efficiency.
Which one has the stronger fundamentals?
Gen Digital exhibits stronger fundamentals with consistent profitability, positive net margins, and favorable EPS growth. CyberArk shows impressive top-line growth but struggles with sustained losses and negative net margins, highlighting risks in profitability. Gen’s stable margins and positive net income contrast with CyberArk’s ongoing earnings deficits, suggesting more resilient financial health for Gen Digital based on income statement metrics.
Financial Ratios Comparison
The table below presents a side-by-side comparison of key financial ratios for CyberArk Software Ltd. and Gen Digital Inc., based on their most recent fiscal year data.
| Ratios | CyberArk Software Ltd. (2024) | Gen Digital Inc. (2025) |
|---|---|---|
| ROE | -3.94% | 28.34% |
| ROIC | -2.85% | 7.77% |
| P/E | -157.49 | 25.36 |
| P/B | 6.21 | 7.19 |
| Current Ratio | 1.48 | 0.51 |
| Quick Ratio | 1.48 | 0.51 |
| D/E (Debt to Equity) | 0.012 | 3.66 |
| Debt-to-Assets | 0.009 | 0.54 |
| Interest Coverage | -17.90 | 2.79 |
| Asset Turnover | 0.30 | 0.25 |
| Fixed Asset Turnover | 51.11 | 36.10 |
| Payout Ratio | 0 | 48.68% |
| Dividend Yield | 0 | 1.92% |
Interpretation of the Ratios
CyberArk Software Ltd.
CyberArk’s ratios reveal mixed financial health, with unfavorable net margin (-9.34%) and returns on equity (-3.94%) and invested capital (-2.85%), indicating profitability challenges. The company has a solid liquidity position (current ratio 1.48) and low debt levels, but weak interest coverage (-3.27) poses risks. CyberArk does not pay dividends, likely reflecting reinvestment priorities amid ongoing losses.
Gen Digital Inc.
Gen Digital shows generally favorable profitability ratios, including a strong net margin of 16.34% and return on equity of 28.34%, though its debt profile is concerning with a high debt-to-assets ratio of 53.66% and low liquidity (current ratio 0.51). The company pays a dividend with a moderate yield of 1.92%, supported by stable free cash flow, balancing shareholder returns and financial leverage risks.
Which one has the best ratios?
Both CyberArk and Gen Digital have slightly unfavorable overall ratio profiles due to different weaknesses: CyberArk struggles with profitability and cash flow coverage, while Gen Digital faces high leverage and liquidity risks. Gen Digital’s stronger profitability and dividend payments contrast with CyberArk’s conservative debt but weaker earnings, making the comparison nuanced depending on investor focus.
Strategic Positioning
This section compares the strategic positioning of CyberArk Software Ltd. (CYBR) and Gen Digital Inc. (GEN), covering Market position, Key segments, and Exposure to technological disruption:
CyberArk Software Ltd. (CYBR)
- Positioned in software infrastructure with moderate competitive pressure in cybersecurity niche.
- Key segments include SaaS, self-hosted subscriptions, maintenance, and professional services.
- Exposure centered on SaaS cloud security and privileged access management innovations.
Gen Digital Inc. (GEN)
- Operates in consumer cyber safety with broad geographic market exposure and competitive retail channels.
- Focuses on consumer cybersecurity subscriptions, identity protection, and legacy products.
- Faces disruption risks via evolving consumer cybersecurity threats and privacy demands.
CyberArk Software Ltd. vs Gen Digital Inc. Positioning
CYBR has a diversified business model spanning SaaS and self-hosted security, while GEN concentrates on consumer-focused cybersecurity subscriptions and identity protection. CYBR’s approach targets enterprise security, whereas GEN prioritizes broad consumer markets, each with distinct operational scopes and risk profiles.
Which has the best competitive advantage?
Both companies show declining ROIC relative to WACC, indicating value destruction and diminishing profitability, hence neither currently demonstrates a sustainable competitive advantage based on MOAT evaluation.
Stock Comparison
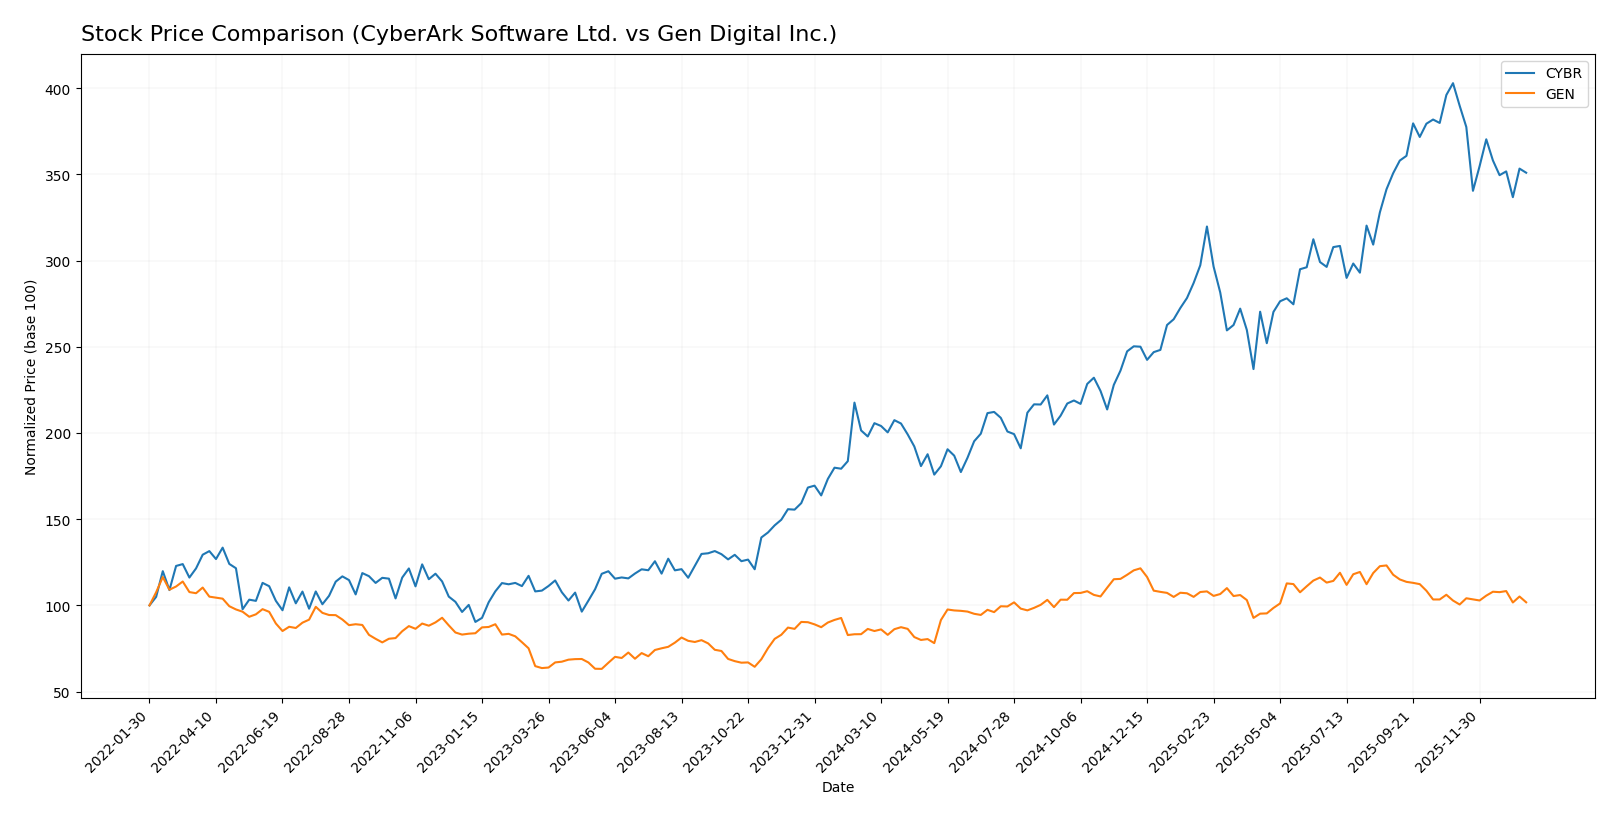
The stock price movements of CyberArk Software Ltd. (CYBR) and Gen Digital Inc. (GEN) over the past 12 months reveal distinct bullish trends with varying degrees of acceleration and recent short-term declines.
Trend Analysis
CyberArk Software Ltd. (CYBR) exhibited a strong bullish trend over the past year with a 77.27% price increase, though with decelerating momentum. The stock experienced high volatility, peaking at 520.78 and bottoming at 227.32, followed by a recent 12.89% decline.
Gen Digital Inc. (GEN) showed a moderate bullish trend with a 17.89% gain over the same period, also with deceleration. Volatility remained low, ranging between 20.03 and 31.58, and the recent price change was nearly neutral at -0.99%.
Comparing these, CyberArk delivered the highest market performance with a significantly larger price increase, despite recent volatility and a short-term downward trend.
Target Prices
Analysts show a clear consensus on target prices for CyberArk Software Ltd. and Gen Digital Inc.
| Company | Target High | Target Low | Consensus |
|---|---|---|---|
| CyberArk Software Ltd. | 520 | 440 | 479.22 |
| Gen Digital Inc. | 32 | 31 | 31.5 |
The consensus target price for CyberArk is about 5.6% above its current price of 453.65 USD, suggesting moderate upside potential. Gen Digital’s target consensus at 31.5 USD is roughly 20.7% higher than its current price of 26.1 USD, indicating stronger anticipated growth.
Analyst Opinions Comparison
This section compares analysts’ ratings and grades for CyberArk Software Ltd. and Gen Digital Inc.:
Rating Comparison
CyberArk Software Ltd. Rating
- Rating: C-, evaluated as Very Favorable
- Discounted Cash Flow Score: 3, considered Moderate
- ROE Score: 1, considered Very Unfavorable
- ROA Score: 1, considered Very Unfavorable
- Debt To Equity Score: 2, considered Moderate
- Overall Score: 1, considered Very Unfavorable
Gen Digital Inc. Rating
- Rating: B, evaluated as Very Favorable
- Discounted Cash Flow Score: 5, considered Very Favorable
- ROE Score: 5, considered Very Favorable
- ROA Score: 3, considered Moderate
- Debt To Equity Score: 1, considered Very Unfavorable
- Overall Score: 3, considered Moderate
Which one is the best rated?
Based strictly on the provided data, Gen Digital Inc. holds higher ratings and scores overall, including a better Discounted Cash Flow, ROE, ROA, and Overall Score, despite a weaker Debt to Equity score compared to CyberArk.
Scores Comparison
Here is a comparison of the Altman Z-Score and Piotroski Score for CyberArk Software Ltd. and Gen Digital Inc.:
CyberArk Scores
- Altman Z-Score: 6.52, in the safe zone, low bankruptcy risk.
- Piotroski Score: 3, very weak financial strength.
Gen Digital Scores
- Altman Z-Score: 1.25, in the distress zone, high bankruptcy risk.
- Piotroski Score: 6, average financial strength.
Which company has the best scores?
CyberArk shows a much stronger Altman Z-Score, indicating lower bankruptcy risk, but a weaker Piotroski Score. Gen Digital has a higher Piotroski Score but a concerning Altman Z-Score in the distress zone.
Grades Comparison
The following presents a summary and detailed grades for CyberArk Software Ltd. and Gen Digital Inc.:
CyberArk Software Ltd. Grades
This table shows recent grades and rating actions from major financial institutions for CyberArk Software Ltd.:
| Grading Company | Action | New Grade | Date |
|---|---|---|---|
| Oppenheimer | maintain | Outperform | 2024-10-22 |
| Keybanc | maintain | Overweight | 2024-10-18 |
| Mizuho | maintain | Outperform | 2024-10-17 |
| BTIG | maintain | Buy | 2024-10-09 |
| Barclays | maintain | Overweight | 2024-10-07 |
| Wedbush | maintain | Outperform | 2024-10-01 |
| Jefferies | maintain | Buy | 2024-09-24 |
| DA Davidson | maintain | Buy | 2024-08-09 |
| Rosenblatt | maintain | Buy | 2024-08-09 |
| Susquehanna | maintain | Positive | 2024-08-09 |
Overall, CyberArk’s grades strongly favor buying with multiple “Outperform,” “Buy,” and “Overweight” ratings maintained recently.
Gen Digital Inc. Grades
Below are the recent grades and rating actions from reputable financial firms for Gen Digital Inc.:
| Grading Company | Action | New Grade | Date |
|---|---|---|---|
| RBC Capital | maintain | Sector Perform | 2025-11-07 |
| Evercore ISI Group | maintain | Outperform | 2025-11-07 |
| Morgan Stanley | maintain | Equal Weight | 2025-09-02 |
| Barclays | maintain | Equal Weight | 2025-08-08 |
| Wells Fargo | maintain | Overweight | 2025-08-08 |
| RBC Capital | maintain | Sector Perform | 2025-08-08 |
| Barclays | maintain | Equal Weight | 2025-07-14 |
| RBC Capital | maintain | Sector Perform | 2025-05-07 |
| Morgan Stanley | maintain | Equal Weight | 2025-04-16 |
| RBC Capital | maintain | Sector Perform | 2025-01-31 |
Gen Digital’s ratings mostly range between “Sector Perform” and “Equal Weight,” with a few “Overweight” and one “Outperform,” indicating moderate confidence from analysts.
Which company has the best grades?
CyberArk Software Ltd. has received predominantly higher ratings such as “Outperform” and “Buy,” compared to Gen Digital Inc.’s more moderate “Sector Perform” and “Equal Weight.” This suggests stronger analyst conviction towards CyberArk, which may influence investor confidence and portfolio positioning.
Strengths and Weaknesses
Below is a comparative overview of key strengths and weaknesses for CyberArk Software Ltd. (CYBR) and Gen Digital Inc. (GEN) based on recent financial and operational data.
| Criterion | CyberArk Software Ltd. (CYBR) | Gen Digital Inc. (GEN) |
|---|---|---|
| Diversification | Moderate: Mix of SaaS, self-hosted subscriptions, and maintenance support; growing SaaS segment | High: Predominantly Cyber Safety Revenues with some legacy products; strong consumer security focus |
| Profitability | Weak: Negative net margin (-9.34%), negative ROIC (-2.85%), value destroying | Strong: Positive net margin (16.34%), ROE (28.34%), but ROIC slightly neutral (7.77%) |
| Innovation | Moderate: Significant investment in SaaS growth with rising revenues | Moderate: Focus on cyber safety and identity protection, steady revenue growth |
| Global presence | Good: Established in cybersecurity niche with international clients | Strong: Large market share in consumer cybersecurity globally |
| Market Share | Niche leader in privileged access management, but facing profitability challenges | Large player in consumer cybersecurity with broad product portfolio |
Key takeaways: CyberArk shows solid diversification in product types and a growing SaaS base but struggles with profitability and value creation. Gen Digital offers strong profitability and a broad market presence, though it faces challenges with debt levels and operational efficiency. Both companies present risks, requiring cautious evaluation before investment.
Risk Analysis
Below is a comparative overview of key risks for CyberArk Software Ltd. (CYBR) and Gen Digital Inc. (GEN) based on the most recent financial and operational data.
| Metric | CyberArk Software Ltd. (CYBR) | Gen Digital Inc. (GEN) |
|---|---|---|
| Market Risk | Beta 0.915 (moderate volatility) | Beta 1.084 (higher volatility) |
| Debt level | Very low debt-to-equity 0.01 (favorable) | High debt-to-equity 3.66 (unfavorable) |
| Regulatory Risk | Moderate, operates globally with varied regulations | Moderate, consumer cyber safety subject to evolving privacy laws |
| Operational Risk | Negative margins (-9.34%) and low ROE (-3.94%) | Positive margins (16.34%) but low liquidity (current ratio 0.51) |
| Environmental Risk | Low exposure, software industry focus | Low exposure, primarily digital services |
| Geopolitical Risk | Based in Israel, potential Middle East regional risks | US-based, subject to US-China tech tensions and global supply chain concerns |
CyberArk faces the most impactful risks from operational inefficiencies and moderate market volatility, despite a very strong balance sheet with minimal debt. Gen Digital, while profitable and with strong ROE, carries significant financial risk due to high leverage and liquidity constraints, alongside market volatility and geopolitical factors affecting the tech sector. Investors should weigh CyberArk’s financial caution against Gen’s growth potential tempered by debt risk.
Which Stock to Choose?
CyberArk Software Ltd. (CYBR) shows strong revenue growth of 33.1% in 2024 but suffers from negative profitability with a net margin of -9.34% and returns on equity and assets below zero. Its debt levels are low, and its rating is very favorable, though financial ratios are slightly unfavorable overall.
Gen Digital Inc. (GEN) demonstrates stable income with a modest 3.55% revenue growth in 2025 and robust profitability indicated by a 16.34% net margin and 28.34% return on equity. However, it carries significant debt and a lower current ratio, with a very favorable rating but slightly unfavorable financial ratios globally.
For investors prioritizing growth potential and low leverage, CyberArk’s strong revenue expansion and conservative debt profile might appear attractive despite negative profitability. Conversely, those valuing profitability and established returns could find Gen Digital’s metrics more favorable despite higher debt and liquidity concerns. Both companies show value destruction in MOAT analysis, indicating caution.
Disclaimer: Investment carries a risk of loss of initial capital. The past performance is not a reliable indicator of future results. Be sure to understand risks before making an investment decision.
Go Further
I encourage you to read the complete analyses of CyberArk Software Ltd. and Gen Digital Inc. to enhance your investment decisions: