Home > Comparison > Technology > FTNT vs CYBR
The strategic rivalry between Fortinet, Inc. and CyberArk Software Ltd. shapes the cybersecurity infrastructure sector’s future. Fortinet operates as a capital-intensive provider of integrated hardware and software security solutions. In contrast, CyberArk delivers high-margin, software-focused identity and access management services. This head-to-head reflects a broader contest between comprehensive security ecosystems and specialized privilege management. This analysis aims to identify which corporate model offers superior risk-adjusted returns for a diversified portfolio in 2026.
Table of contents
Companies Overview
Fortinet and CyberArk stand as pivotal players in the cybersecurity software infrastructure market.
Fortinet, Inc.: Integrated Cybersecurity Powerhouse
Fortinet dominates the cybersecurity infrastructure sector by delivering broad, automated security solutions. Its core revenue stems from hardware and software licenses for firewalls, intrusion prevention, and network security products. In 2026, Fortinet focuses strategically on expanding its integrated ecosystem, blending endpoint protection with centralized management to enhance customer security posture globally. Broad product integration remains its competitive advantage.
CyberArk Software Ltd.: Privileged Access Security Specialist
CyberArk leads in privileged access management and identity security solutions. It generates revenue through software-based services that safeguard credentials, manage endpoints, and secure cloud entitlements. Its 2026 strategy emphasizes SaaS offerings and adaptive identity management to mitigate risks from excessive privileges. Focused identity governance underpins its market differentiation.
Strategic Collision: Similarities & Divergences
Both firms operate in software infrastructure with a cybersecurity focus but diverge in approach. Fortinet champions a broad, integrated security stack while CyberArk pursues a specialized access and identity control niche. Their primary battleground is enterprise security, where Fortinet targets comprehensive protection and CyberArk zeroes in on privileged access. This creates distinct investment profiles: Fortinet offers scale and ecosystem breadth, CyberArk delivers focused innovation in identity security.
Income Statement Comparison
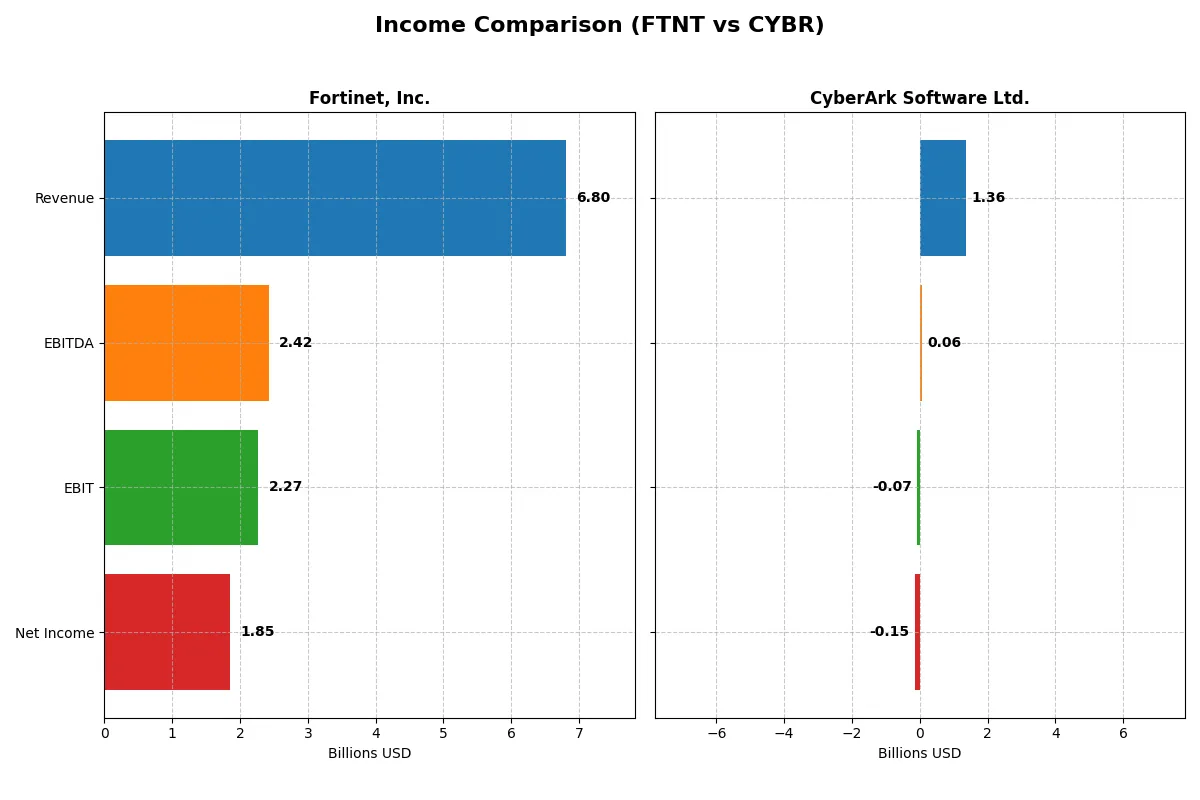
This data dissects the core profitability and scalability of both corporate engines to reveal who dominates the bottom line:
| Metric | Fortinet, Inc. (FTNT) | CyberArk Software Ltd. (CYBR) |
|---|---|---|
| Revenue | 6.8B | 1.4B |
| Cost of Revenue | 1.3B | 350M |
| Operating Expenses | 3.4B | 1.1B |
| Gross Profit | 5.5B | 1.0B |
| EBITDA | 2.4B | 59M |
| EBIT | 2.3B | -69M |
| Interest Expense | 20M | 0 |
| Net Income | 1.9B | -147M |
| EPS | 2.44 | -2.93 |
| Fiscal Year | 2025 | 2025 |
Income Statement Analysis: The Bottom-Line Duel
This income statement comparison reveals how efficiently each company translates revenue into profit while managing expenses and growth momentum.
Fortinet, Inc. Analysis
Fortinet’s revenue surged from $3.3B in 2021 to nearly $6.8B in 2025, with net income growing over 200% to $1.85B. Its gross margin remains robust above 80%, and net margins hold at a healthy 27%. The latest year shows solid momentum, with revenue and gross profit both expanding over 14%, reflecting operational efficiency and disciplined cost management.
CyberArk Software Ltd. Analysis
CyberArk’s revenue climbed sharply from $503M in 2021 to $1.36B in 2025, a 170% rise, but its net income remains negative at -$147M. Gross margins stay favorable above 74%, yet EBIT and net margins suffer significant losses. Despite strong top-line growth, worsening profitability and negative EPS growth highlight persistent challenges in converting sales into earnings.
Margin Strength vs. Growth Struggles
Fortinet dominates with superior profitability, maintaining high gross and net margins while delivering consistent income growth. CyberArk excels in revenue expansion but struggles to achieve profitability, posting sustained losses and negative margins. For investors prioritizing stable earnings and margin quality, Fortinet’s profile offers a clearer fundamental advantage.
Financial Ratios Comparison
These vital ratios act as a diagnostic tool to expose the underlying fiscal health, valuation premiums, and capital efficiency of the companies compared below:
| Ratios | Fortinet, Inc. (FTNT) | CyberArk Software Ltd. (CYBR) |
|---|---|---|
| ROE | 1.50 | -0.06 |
| ROIC | 0.29 | -0.03 |
| P/E | 32.48 | -152.24 |
| P/B | 48.64 | 9.31 |
| Current Ratio | 1.17 | 2.00 |
| Quick Ratio | 1.09 | 2.00 |
| D/E | 0.81 | 0.51 |
| Debt-to-Assets | 0.10 | 0.25 |
| Interest Coverage | 103.72 | 0 |
| Asset Turnover | 0.65 | 0.28 |
| Fixed Asset Turnover | 4.20 | 32.73 |
| Payout Ratio | 0 | 0 |
| Dividend Yield | 0 | 0 |
| Fiscal Year | 2025 | 2025 |
Efficiency & Valuation Duel: The Vital Signs
Financial ratios function as a company’s DNA, uncovering hidden risks and operational strengths critical for informed investing decisions.
Fortinet, Inc.
Fortinet delivers exceptional profitability with a 150% ROE and a robust 27.3% net margin, signaling operational excellence. However, its P/E ratio of 32.5 suggests a stretched valuation relative to earnings. The company retains earnings for growth, favoring reinvestment in R&D over dividends, emphasizing expansion over immediate shareholder payouts.
CyberArk Software Ltd.
CyberArk struggles with negative profitability, posting a -6.1% ROE and a -10.8% net margin, indicating operational challenges. Its P/E ratio is negative, reflecting losses rather than earnings, but the price-to-book ratio of 9.3 signals a high valuation on book value. The firm offers no dividends, focusing on growth investments despite weak returns.
Superior Profitability vs. Growth Risk
Fortinet offers superior profitability and a slightly favorable ratio profile, albeit at a premium valuation. CyberArk’s negative earnings and mixed ratio signals highlight greater risk despite growth ambitions. Investors seeking operational strength might favor Fortinet, while those tolerating risk for potential growth may consider CyberArk’s profile.
Which one offers the Superior Shareholder Reward?
Fortinet and CyberArk both forgo dividends, focusing on reinvestment and buybacks for shareholder returns. Fortinet maintains a robust buyback program, supported by strong free cash flow of 2.9B and a zero dividend payout ratio, ensuring sustainable capital returns. CyberArk’s free cash flow is healthy at 5.2B but its negative net margins and volatile operating cash flow coverage signal risk. Fortinet’s disciplined capital allocation and consistent buybacks offer a more reliable total return profile in 2026. I favor Fortinet for superior, sustainable shareholder reward.
Comparative Score Analysis: The Strategic Profile
The radar chart reveals the fundamental DNA and trade-offs of Fortinet, Inc. and CyberArk Software Ltd., highlighting their core financial strengths and vulnerabilities:
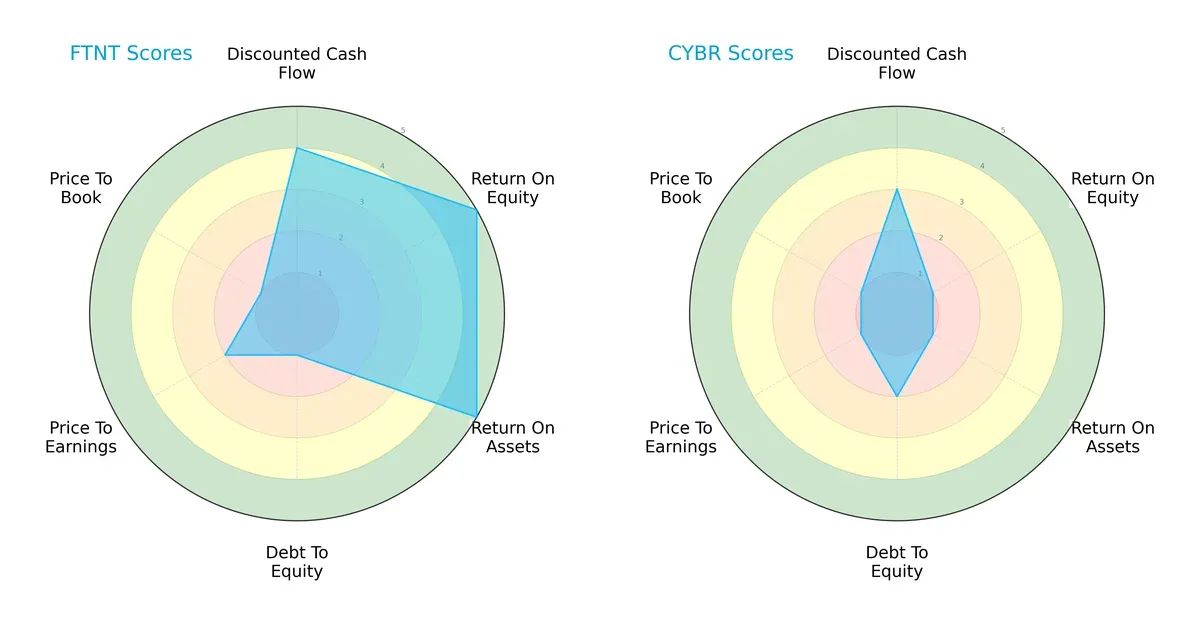
Fortinet displays a balanced profile with strong ROE (5) and ROA (5), signaling efficient profit generation and asset use. However, its high debt-to-equity risk (1) and weak valuation metrics (P/E 2, P/B 1) expose financial leverage concerns. CyberArk lags significantly across profitability scores (ROE 1, ROA 1) and valuation, relying on moderate DCF strength (3) but showing slightly better debt management (2). Overall, Fortinet commands a more robust, though leveraged, position, while CyberArk depends heavily on a narrow competitive edge.
Bankruptcy Risk: Solvency Showdown
Fortinet’s Altman Z-Score of 5.49 slightly surpasses CyberArk’s 5.22, positioning both comfortably in the safe zone for bankruptcy risk in this cycle:
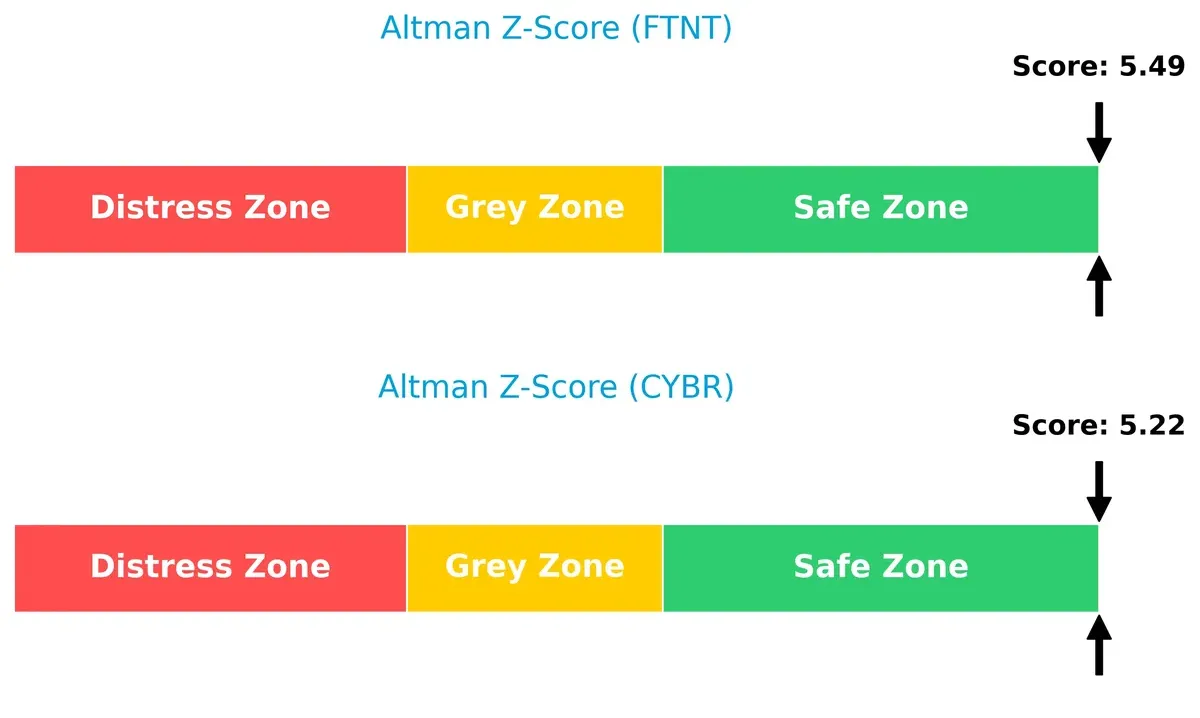
This indicates both firms maintain strong solvency, but Fortinet’s marginally better score suggests a slightly lower risk of financial distress amid market volatility.
Financial Health: Quality of Operations
Fortinet’s Piotroski F-Score of 6 reflects average but stable financial health, while CyberArk’s 3 signals red flags and weak internal metrics:
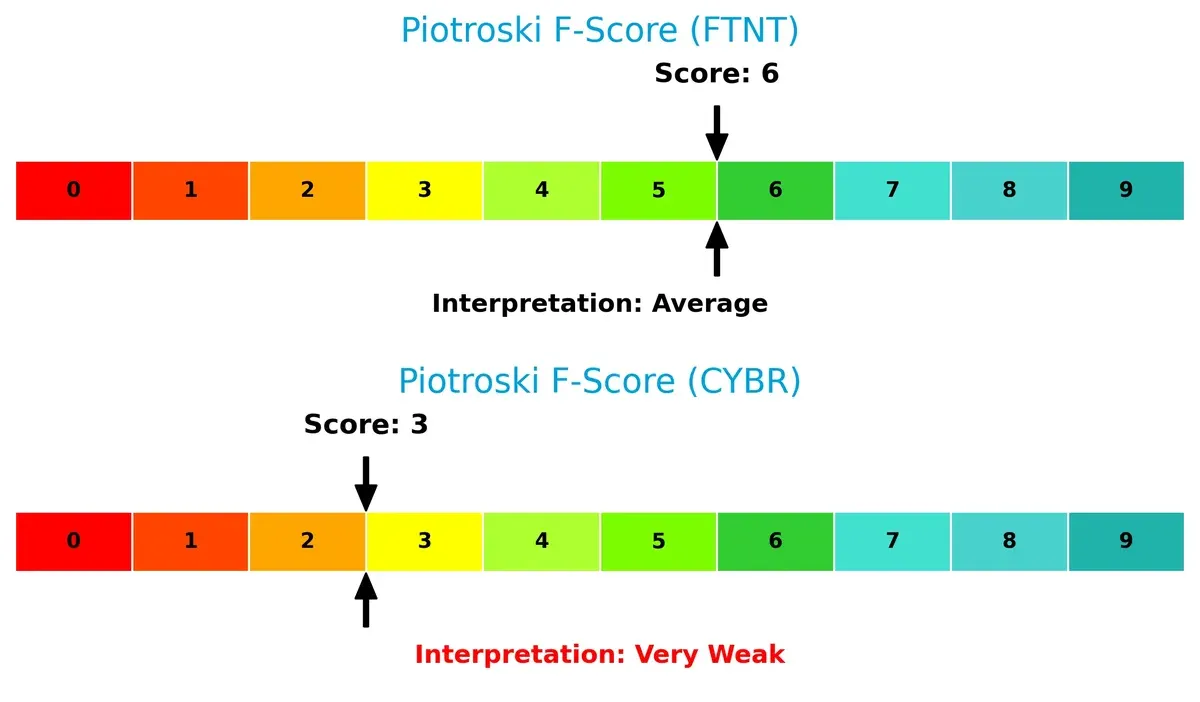
I see Fortinet as the stronger operator with more reliable earnings quality and operational efficiency. CyberArk’s low score urges caution, highlighting potential underlying weaknesses investors should monitor closely.
How are the two companies positioned?
This section dissects the operational DNA of Fortinet and CyberArk by comparing their revenue distribution and internal dynamics. The goal is to confront their economic moats to identify the most resilient, sustainable competitive advantage today.
Revenue Segmentation: The Strategic Mix
The following visual comparison dissects how Fortinet, Inc. and CyberArk Software Ltd. diversify their income streams and where their primary sector bets lie:
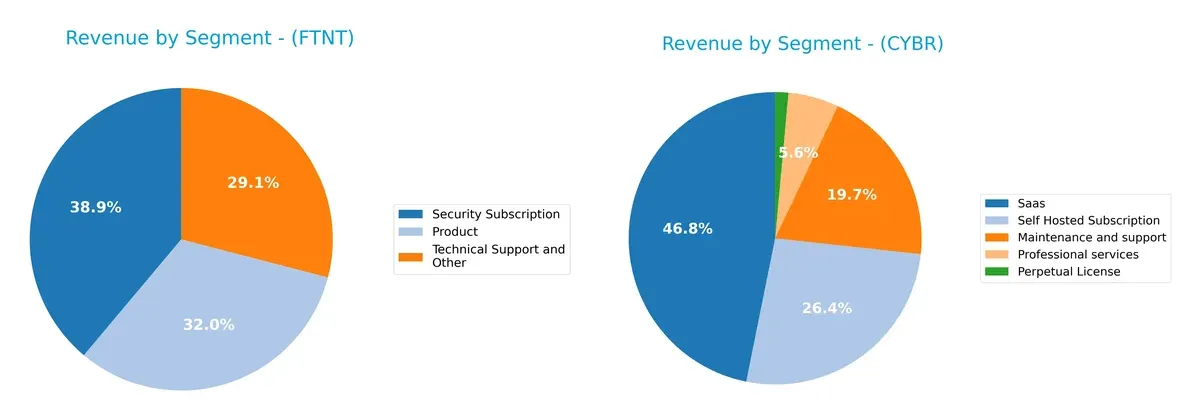
Fortinet anchors its revenue with a balanced mix: Security Subscription leads at $2.3B, followed by Product at $1.9B and Technical Support at $1.7B. This spread reduces concentration risk and signals ecosystem lock-in. CyberArk pivots more on SaaS ($469M) and Self Hosted Subscription ($265M), but also relies heavily on Maintenance and Support ($197M). Fortinet’s broader base suggests infrastructure dominance, while CyberArk faces higher dependency on evolving cloud models.
Strengths and Weaknesses Comparison
This table compares the Strengths and Weaknesses of Fortinet and CyberArk based on diversification, profitability, financials, innovation, global presence, and market share:
Fortinet Strengths
- Strong profitability with 27.26% net margin
- High ROE at 149.77% and ROIC at 28.76%
- Favorable debt-to-assets at 9.59%
- Balanced product and subscription revenue streams
- Broad global presence across Americas, EMEA, and Asia Pacific
- High fixed asset turnover at 4.2
CyberArk Strengths
- Favorable WACC at 7.88% supports capital efficiency
- Strong liquidity ratios with current and quick ratio at 2.0
- Diverse revenue streams including SaaS and self-hosted subscriptions
- Growing revenues in multiple geographic regions including US and EMEA
- Very high fixed asset turnover at 32.73
Fortinet Weaknesses
- Unfavorable valuation multiples with PE at 32.48 and PB at 48.64
- No dividend yield
- Moderate current ratio at 1.17 indicates limited short-term buffer
- Asset turnover moderate at 0.65
- Neutral debt/equity at 0.81
CyberArk Weaknesses
- Negative profitability with net margin -10.79%, ROE -6.11%, ROIC -2.74%
- Interest coverage at zero signals risk on debt cost
- Unfavorable asset turnover at 0.28 reflects lower efficiency
- Unfavorable PB at 9.31 despite negative earnings
- No dividend yield
Fortinet demonstrates robust profitability and a balanced global footprint, while CyberArk shows strong liquidity and asset utilization but struggles with profitability. Each company’s financial profile implies distinct strategic challenges and opportunities in managing growth and operational efficiency.
The Moat Duel: Analyzing Competitive Defensibility
A structural moat is the only reliable shield protecting long-term profits from relentless competitive erosion in tech:
Fortinet, Inc.: Integrated Security Platform Moat
Fortinet’s primary moat is its broad, integrated cybersecurity platform that delivers switching costs and operational efficiency. Its 20%+ ROIC above WACC and stable 33% EBIT margin reflect strong value creation. Expansion into AI-driven security in 2026 could deepen its moat further.
CyberArk Software Ltd.: Privileged Access Specialist Moat
CyberArk’s moat centers on its specialized privileged access management solutions, differentiating it from Fortinet’s broader approach. Despite growing ROIC, negative EBIT margins indicate current profitability challenges. New cloud entitlement products offer upside but require scaling to sustain advantage.
Platform Integration vs. Niche Specialization: Who Defends Better?
Fortinet’s wide moat stems from scalable integration and consistent profitability, outperforming CyberArk’s narrower, less profitable niche. I see Fortinet as better equipped to defend and grow market share in 2026’s competitive cybersecurity landscape.
Which stock offers better returns?
The past year revealed distinct price movements for Fortinet, Inc. and CyberArk Software Ltd., with both stocks showing bullish momentum but differing in volatility and recent trading dynamics.
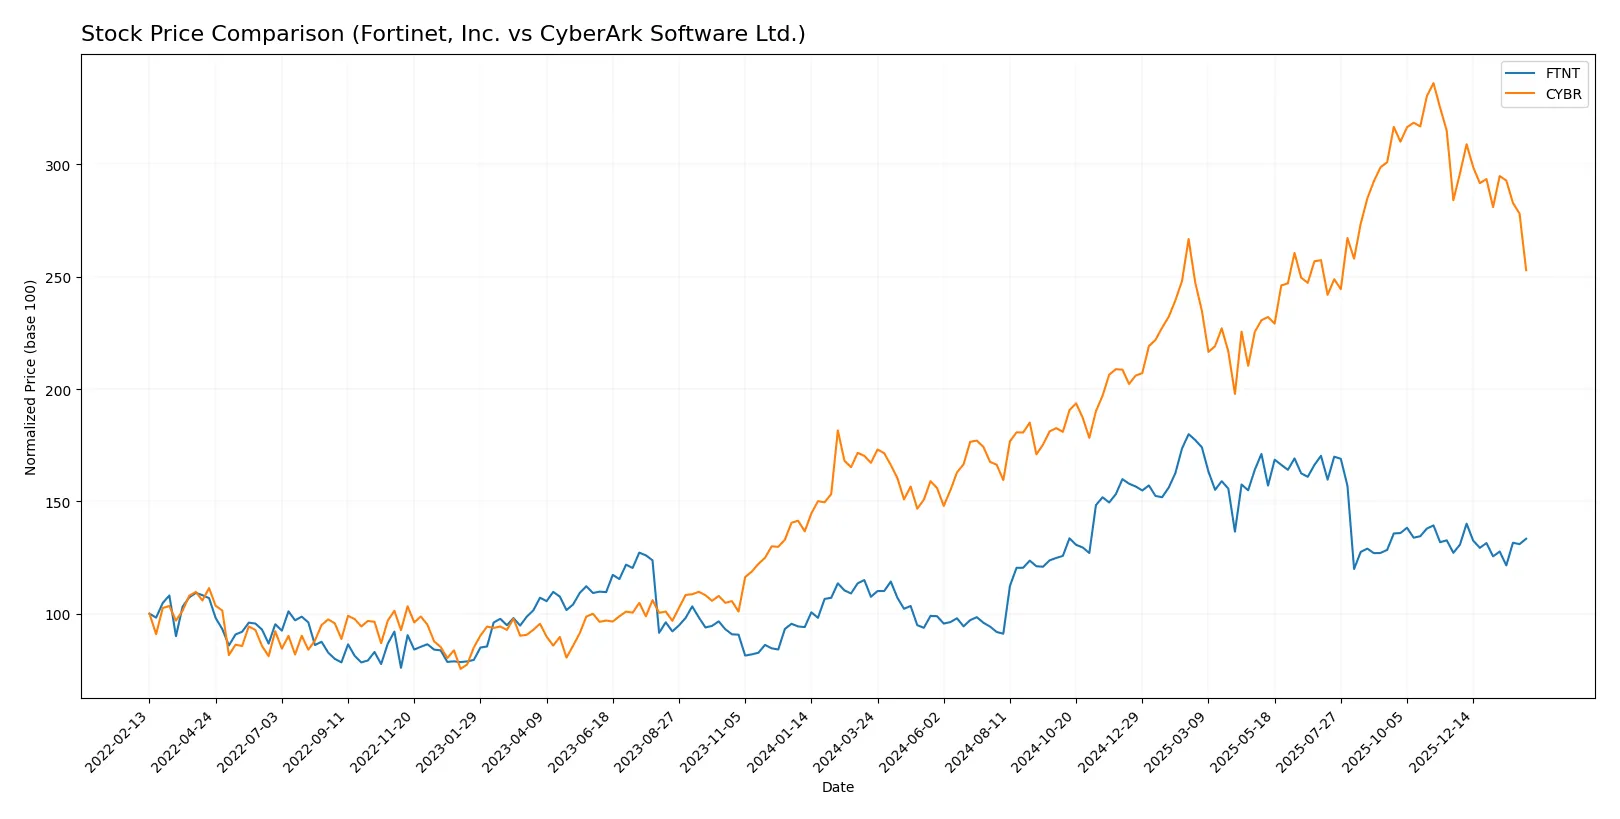
Trend Comparison
Fortinet, Inc.’s stock rose 24.04% over the last 12 months, marking a bullish trend with decelerating momentum and a notable high at 111.64. Volatility remains moderate with a standard deviation of 15.07.
CyberArk Software Ltd. gained 51.27% over the same period, also bullish with deceleration. It experienced higher volatility, reflected in an 81.97 standard deviation, and a peak price of 520.78.
CyberArk outperformed Fortinet with the highest 12-month return despite stronger recent selling pressure and increased volatility relative to Fortinet’s steadier volume and milder price shifts.
Target Prices
Analysts present a confident consensus on target prices for Fortinet, Inc. and CyberArk Software Ltd.
| Company | Target Low | Target High | Consensus |
|---|---|---|---|
| Fortinet, Inc. | 70 | 90 | 85 |
| CyberArk Software Ltd. | 411 | 502 | 466.17 |
Fortinet’s consensus target of 85 slightly exceeds its current price of 82.76, indicating modest upside. CyberArk’s consensus target of 466.17 implies significant appreciation potential from its current 391.77.

Don’t Let Luck Decide Your Entry Point
Optimize your entry points with our advanced ProRealTime indicators. You’ll get efficient buy signals with precise price targets for maximum performance. Start outperforming now!
How do institutions grade them?
This section compares recent institutional grades for Fortinet, Inc. and CyberArk Software Ltd.:
Fortinet, Inc. Grades
Here are the recent grades assigned by reputable firms to Fortinet, Inc.:
| Grading Company | Action | New Grade | Date |
|---|---|---|---|
| Rosenblatt | Maintain | Buy | 2026-02-06 |
| Mizuho | Maintain | Underperform | 2026-02-06 |
| JP Morgan | Maintain | Underweight | 2026-02-06 |
| RBC Capital | Maintain | Sector Perform | 2026-02-06 |
| Wedbush | Maintain | Outperform | 2026-02-06 |
| Scotiabank | Downgrade | Sector Perform | 2026-02-02 |
| JP Morgan | Maintain | Underweight | 2026-01-30 |
| Rosenblatt | Upgrade | Buy | 2026-01-29 |
| TD Cowen | Upgrade | Buy | 2026-01-23 |
| Citigroup | Maintain | Neutral | 2026-01-13 |
CyberArk Software Ltd. Grades
Below are the recent grades assigned by major institutions to CyberArk Software Ltd.:
| Grading Company | Action | New Grade | Date |
|---|---|---|---|
| Oppenheimer | Maintain | Outperform | 2024-10-22 |
| Keybanc | Maintain | Overweight | 2024-10-18 |
| Mizuho | Maintain | Outperform | 2024-10-17 |
| BTIG | Maintain | Buy | 2024-10-09 |
| Barclays | Maintain | Overweight | 2024-10-07 |
| Wedbush | Maintain | Outperform | 2024-10-01 |
| Jefferies | Maintain | Buy | 2024-09-24 |
| Keybanc | Maintain | Overweight | 2024-08-09 |
| Citigroup | Maintain | Buy | 2024-08-09 |
| Susquehanna | Maintain | Positive | 2024-08-09 |
Which company has the best grades?
CyberArk consistently receives strong “Outperform,” “Overweight,” and “Buy” ratings from multiple institutions. Fortinet shows more mixed grades, including “Underperform” and “Underweight,” despite some “Buy” and “Outperform” calls. This divergence suggests differing analyst confidence levels, impacting investor perceptions of risk and growth potential.
Risks specific to each company
The following categories identify critical pressure points and systemic threats facing Fortinet, Inc. and CyberArk Software Ltd. in the 2026 market environment:
1. Market & Competition
Fortinet, Inc.
- Strong market position with broad integrated cybersecurity solutions; intense competition from large incumbents.
CyberArk Software Ltd.
- Niche focus on privileged access management; faces competition from both specialized and broad cybersecurity vendors.
2. Capital Structure & Debt
Fortinet, Inc.
- Moderate debt-to-equity ratio at 0.81; interest coverage exceptionally strong at 113x, signaling low financial risk.
CyberArk Software Ltd.
- Lower debt-to-equity at 0.51 but interest coverage at 0 raises red flags about debt servicing capacity.
3. Stock Volatility
Fortinet, Inc.
- Beta of 1.05 indicates market-level volatility; trading range moderately wide but stable volume supports liquidity.
CyberArk Software Ltd.
- Lower beta at 0.93 suggests slightly less volatility; wider trading range and lower volume may increase price swings.
4. Regulatory & Legal
Fortinet, Inc.
- US-based, subject to stringent cybersecurity and data privacy regulations; potential compliance cost increases.
CyberArk Software Ltd.
- Israeli headquarters with global operations face complex international regulations and geopolitical legal risks.
5. Supply Chain & Operations
Fortinet, Inc.
- Broad product portfolio requiring diverse supply chain; some exposure to hardware supply constraints.
CyberArk Software Ltd.
- Software-centric model reduces supply chain risks but depends heavily on cloud infrastructure stability.
6. ESG & Climate Transition
Fortinet, Inc.
- Increasing pressure to meet ESG standards in US; energy-intensive hardware production may pose environmental challenges.
CyberArk Software Ltd.
- ESG risks lower due to software focus; however, must address data privacy and governance expectations.
7. Geopolitical Exposure
Fortinet, Inc.
- Primarily US operations with global sales; geopolitical tensions could disrupt international business.
CyberArk Software Ltd.
- Based in Israel, CyberArk faces heightened geopolitical risks affecting operational stability and market access.
Which company shows a better risk-adjusted profile?
Fortinet faces its largest risk in intense market competition and regulatory costs, but its robust capital structure and profitability strengthen its profile. CyberArk’s most critical risk is its weak debt servicing capacity paired with geopolitical exposure. Fortinet’s superior financial health and liquidity offer a better risk-adjusted profile, despite CyberArk’s niche market positioning.
Final Verdict: Which stock to choose?
Fortinet’s superpower lies in its robust economic moat, demonstrated by a very favorable ROIC consistently well above its cost of capital. It efficiently converts invested capital into profits, supported by a strong income statement and improving profitability. A point of vigilance is its stretched valuation multiples, which could pressure returns. It suits an aggressive growth portfolio willing to pay for quality.
CyberArk’s strategic moat stems from its niche in privileged access management, offering a specialized recurring revenue stream. Despite a weaker profitability profile and value destruction signs, it maintains a strong liquidity position and growth in operating efficiency. Relative to Fortinet, it presents a higher risk but potential for turnaround. It fits a GARP (Growth at a Reasonable Price) portfolio seeking exposure to emerging cybersecurity segments.
If you prioritize durable economic moats and proven value creation, Fortinet outshines with superior profitability and financial strength. However, if you seek speculative growth with liquidity safety and can tolerate earnings volatility, CyberArk offers a riskier but potentially rewarding scenario. Each profile demands careful risk management aligned with portfolio objectives.
Disclaimer: Investment carries a risk of loss of initial capital. The past performance is not a reliable indicator of future results. Be sure to understand risks before making an investment decision.
Go Further
I encourage you to read the complete analyses of Fortinet, Inc. and CyberArk Software Ltd. to enhance your investment decisions: