Home > Comparison > Technology > CYBR vs FFIV
The strategic rivalry between CyberArk Software Ltd. and F5, Inc. shapes the evolution of the software infrastructure sector. CyberArk operates as a specialized cybersecurity software provider focusing on privileged access management. In contrast, F5 delivers multi-cloud application security and delivery solutions with a broader network services scope. This analysis pits CyberArk’s niche expertise against F5’s diversified platform to identify which offers superior risk-adjusted returns for a balanced portfolio.
Table of contents
Companies Overview
CyberArk Software Ltd. and F5, Inc. represent key players shaping the software infrastructure market in 2026. Their innovations drive critical security and application delivery services globally.
CyberArk Software Ltd.: Privileged Access Security Leader
CyberArk stands out as a specialist in software-based security solutions, focusing on privileged access management. Its core revenue engine stems from advanced identity and access management products deployed across various industries worldwide. In 2026, CyberArk sharpened its strategic focus on SaaS offerings like Endpoint Privilege Manager and Cloud Entitlements Manager to combat rising cyber risks.
F5, Inc.: Multi-Cloud Application Security Provider
F5 dominates the multi-cloud application security and delivery space with a blend of hardware and software solutions. Its revenue primarily comes from BIG-IP appliances, NGINX software, and advanced firewall services. The company’s 2026 strategy emphasizes hybrid cloud integration and partnerships with AWS, Azure, and Google Cloud, enhancing its footprint in enterprise and public sector markets.
Strategic Collision: Similarities & Divergences
Both firms prioritize security infrastructure but diverge in approach: CyberArk centers on identity and privileged access, while F5 focuses on application delivery across multi-cloud environments. Their primary battleground lies in securing enterprise digital assets amid hybrid cloud adoption. CyberArk appeals to risk-averse sectors needing stringent access controls, whereas F5 targets broad cloud-native application performance and security needs.
Income Statement Comparison
This data dissects the core profitability and scalability of both corporate engines to reveal who dominates the bottom line:
| Metric | CyberArk Software Ltd. (CYBR) | F5, Inc. (FFIV) |
|---|---|---|
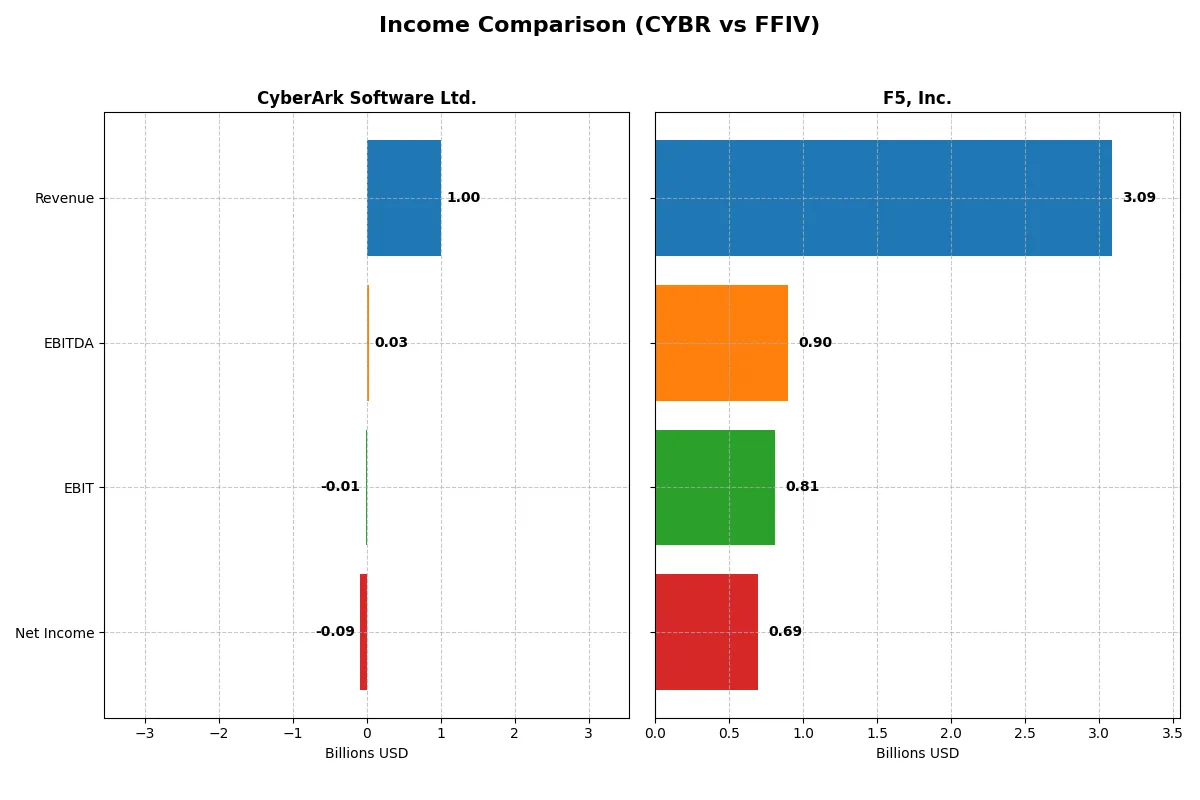
| Revenue | 1B | 3.1B |
| Cost of Revenue | 208M | 564M |
| Operating Expenses | 865M | 1.76B |
| Gross Profit | 792M | 2.52B |
| EBITDA | 29M | 901M |
| EBIT | -13M | 808M |
| Interest Expense | 4.1M | 0 |
| Net Income | -93M | 692M |
| EPS | -2.12 | 11.95 |
| Fiscal Year | 2024 | 2025 |
Income Statement Analysis: The Bottom-Line Duel
This income statement comparison exposes which company converts revenue into profit with greater efficiency and momentum.
CyberArk Software Ltd. Analysis
CyberArk’s revenue surged 33% from 2023 to 2024, reaching $1B, reflecting strong top-line growth. Despite a healthy gross margin near 79%, it sustains negative net income of -$93M in 2024, dragging net margins below -9%. Operating losses persist, though improved EBIT growth signals some momentum in expense control.
F5, Inc. Analysis
F5 maintains robust revenue growth, climbing nearly 10% to $3.1B in 2025. It boasts a superior gross margin above 81%, alongside a strong 26% EBIT margin, translating to $692M net income. F5’s positive net margin of 22% and double-digit EPS growth highlight operational efficiency and consistent profitability.
Margin Mastery vs. Growth Struggles
F5 clearly outperforms CyberArk in profitability and margin stability, delivering solid earnings on expanding revenues. CyberArk shows impressive revenue growth but struggles with persistent losses and negative net margins. Investors favor F5’s proven profit profile over CyberArk’s high-growth yet unprofitable trajectory.
Financial Ratios Comparison
These vital ratios act as a diagnostic tool to expose the underlying fiscal health, valuation premiums, and capital efficiency of the companies compared below:
| Ratios | CyberArk Software Ltd. (CYBR) | F5, Inc. (FFIV) |
|---|---|---|
| ROE | -3.94% | 19.28% |
| ROIC | -2.85% | 13.99% |
| P/E | -157.49 | 26.91 |
| P/B | 6.21 | 5.19 |
| Current Ratio | 1.48 | 1.56 |
| Quick Ratio | 1.48 | 1.51 |
| D/E | 0.01 | 0.06 |
| Debt-to-Assets | 0.88% | 3.65% |
| Interest Coverage | -17.90 | N/A |
| Asset Turnover | 0.30 | 0.49 |
| Fixed Asset Turnover | 51.11 | 9.02 |
| Payout ratio | 0% | 0% |
| Dividend yield | 0% | 0% |
| Fiscal Year | 2024 | 2025 |
Efficiency & Valuation Duel: The Vital Signs
Financial ratios act as a company’s DNA, unveiling hidden risks and operational strengths that surface beyond headline numbers.
CyberArk Software Ltd.
CyberArk reveals weak profitability with negative ROE (-3.94%) and net margin (-9.34%), signaling operational struggles. Its valuation appears stretched, shown by a negative P/E but high P/B of 6.21. The firm does not pay dividends, instead investing heavily in R&D, which may fuel future growth despite current inefficiencies.
F5, Inc.
F5 demonstrates robust profitability, with a strong ROE of 19.28% and a favorable net margin of 22.42%. The stock trades at a premium P/E of 26.91 and P/B of 5.19, indicating relative expensiveness. It does not pay dividends but maintains solid free cash flow, supporting shareholder value through buybacks or reinvestment.
Premium Valuation vs. Operational Safety
F5’s favorable profitability and cash flow offer a more balanced risk-reward profile than CyberArk’s stretched valuation and negative returns. Investors seeking stability and efficiency may prefer F5, while those tolerating short-term weakness for growth exposure might consider CyberArk.
Which one offers the Superior Shareholder Reward?
I observe that neither CyberArk Software Ltd. (CYBR) nor F5, Inc. (FFIV) pays dividends. CYBR reinvests heavily but suffers persistent net losses, with negative margins and no buybacks, risking shareholder dilution. FFIV boasts strong profit margins, robust free cash flow, and modest debt, fueling consistent buybacks that enhance total return. I judge FFIV’s capital return strategy more sustainable and rewarding for shareholders in 2026.
Comparative Score Analysis: The Strategic Profile
The radar chart reveals the fundamental DNA and trade-offs of CyberArk Software Ltd. and F5, Inc., highlighting their core financial strengths and weaknesses:
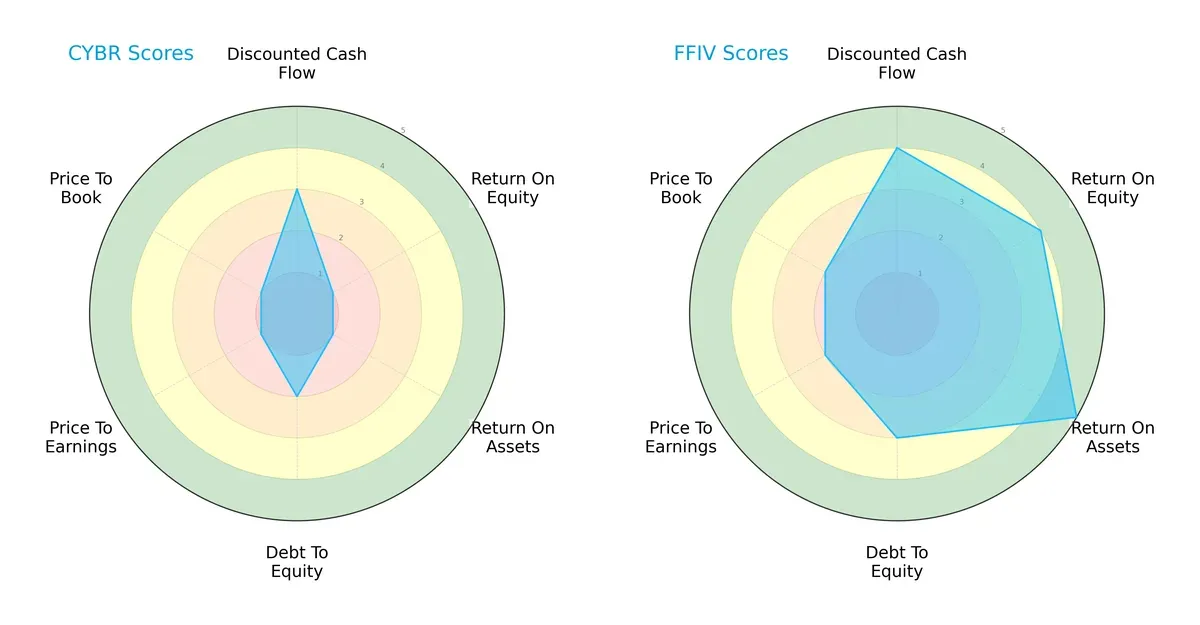
F5, Inc. demonstrates a more balanced and robust profile with strong scores in DCF (4), ROE (4), and ROA (5). CyberArk relies heavily on a moderate DCF score (3) but shows very weak profitability and valuation metrics (all scored 1). F5’s moderate debt-to-equity score (3) contrasts with CyberArk’s weaker balance sheet (2), making F5 the clearer leader in financial stability and operational efficiency.
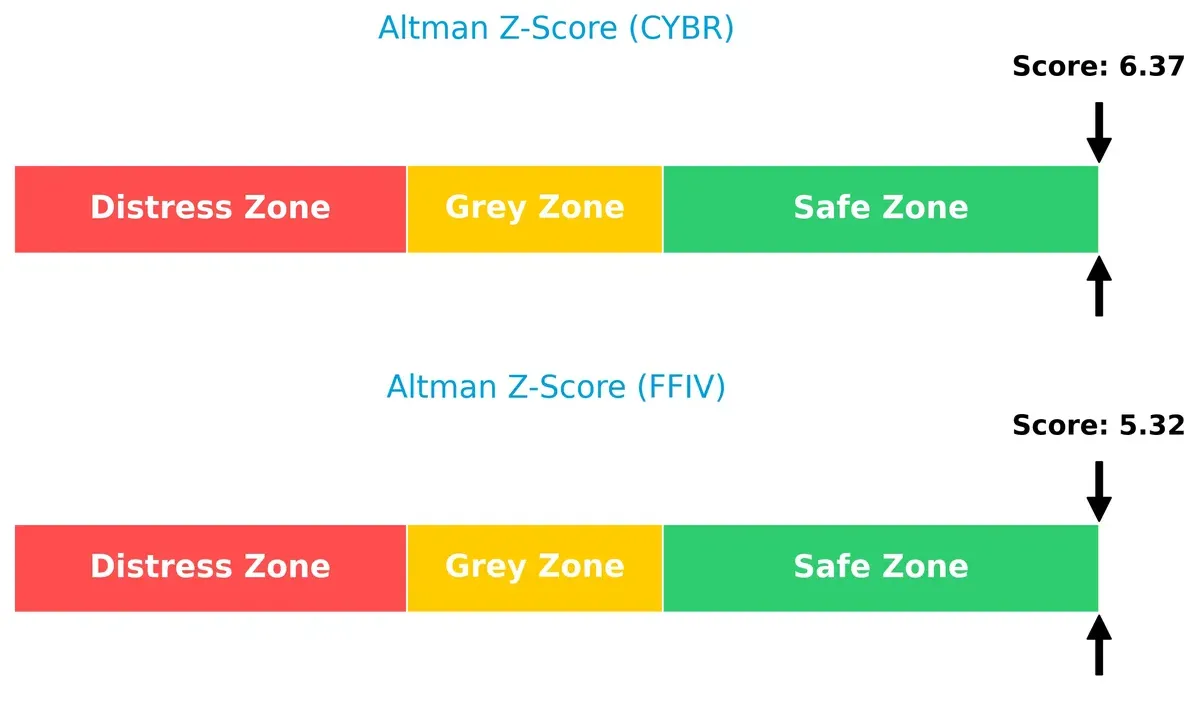
Bankruptcy Risk: Solvency Showdown
F5 and CyberArk both sit comfortably in the safe zone by Altman Z-Score standards, but F5’s 5.32 versus CyberArk’s 6.37 indicates slightly better solvency for CyberArk, suggesting a marginally stronger buffer against long-term financial distress:
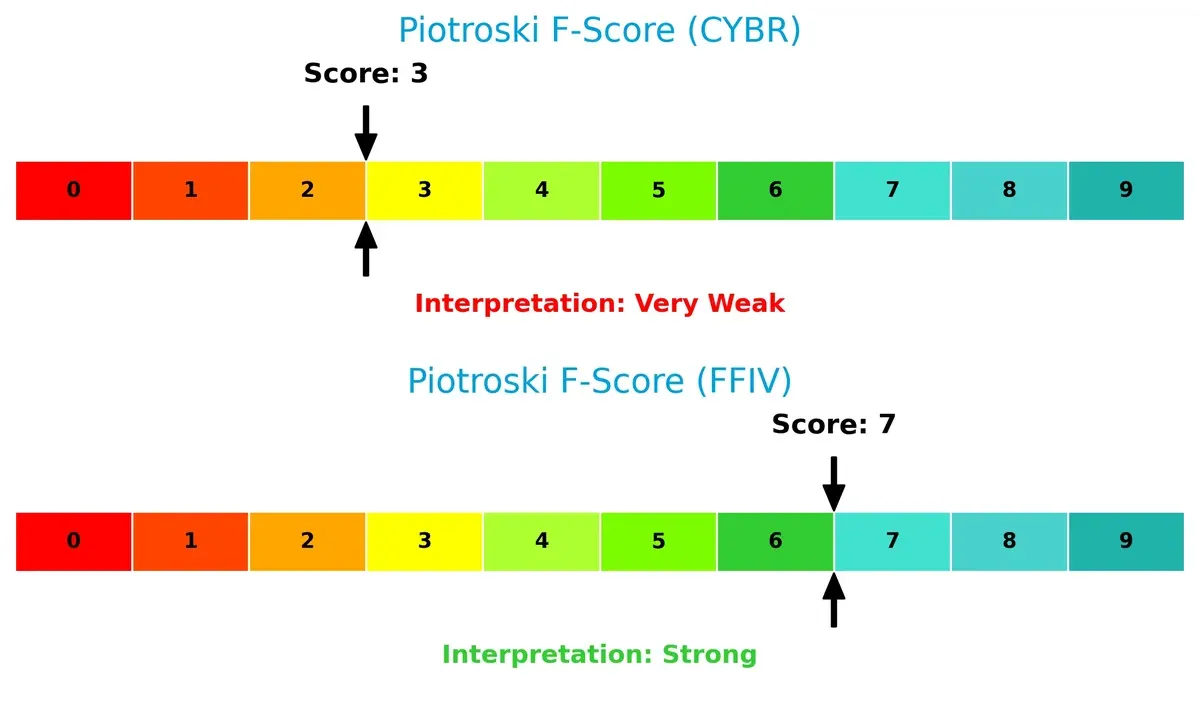
Financial Health: Quality of Operations
F5 scores a strong 7 on the Piotroski F-Score, signaling solid internal financial health and operational quality. CyberArk’s weak 3 warns of red flags in profitability and efficiency metrics, raising concerns about internal financial strength:
How are the two companies positioned?
This section dissects CyberArk and F5’s operational DNA by comparing their revenue distribution and internal strengths and weaknesses. The goal is to confront their economic moats and identify which model offers the most resilient, sustainable competitive advantage today.
Revenue Segmentation: The Strategic Mix
This visual comparison dissects how CyberArk Software Ltd. and F5, Inc. diversify their income streams and where their primary sector bets lie:
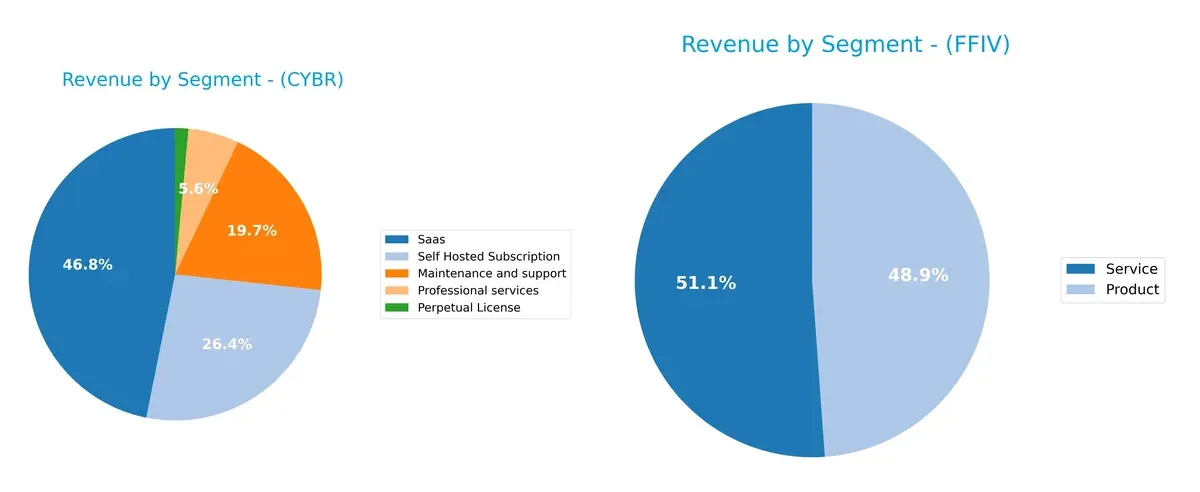
CyberArk’s revenue pivots heavily on SaaS at $469M and Self Hosted Subscription at $265M, showing strong emphasis on subscription models. In contrast, F5 balances between Product ($1.5B) and Service ($1.58B) revenues, revealing a more diversified approach. CyberArk’s concentration in subscription services signals an ecosystem lock-in strategy, while F5’s split mitigates concentration risk with a stable product-service mix.
Strengths and Weaknesses Comparison
This table compares the Strengths and Weaknesses of CyberArk Software Ltd. and F5, Inc.:
CyberArk Strengths
- Strong SaaS and subscription revenue growth
- Low debt-to-equity ratio at 0.01 indicates conservative capital structure
- Favorable quick ratio of 1.48 supports liquidity
- High fixed asset turnover of 51.11 reflects efficient asset use
F5 Strengths
- Robust profitability with net margin of 22.42% and ROE of 19.28%
- Favorable ROIC of 13.99% exceeds WACC at 8.31%
- Solid current and quick ratios above 1.5 ensure liquidity
- Diverse global presence spanning Americas, EMEA, Asia Pacific
CyberArk Weaknesses
- Negative net margin (-9.34%) and ROE (-3.94%) highlight profitability challenges
- Unfavorable interest coverage at -3.27 signals risk in debt servicing
- High price-to-book ratio of 6.21 may indicate overvaluation
- Asset turnover of 0.3 is comparatively low
F5 Weaknesses
- Price-to-earnings ratio at 26.91 considered high relative to sector peers
- Asset turnover of 0.49 remains below ideal efficiency benchmarks
- Dividend yield at 0% may deter income-focused investors
Both companies show distinct profiles: CyberArk’s strengths lie in subscription revenue and low leverage but struggle with profitability. F5 leads in profitability and global diversification but faces valuation and efficiency trade-offs. These factors shape each firm’s strategic focus on growth versus operational performance.
The Moat Duel: Analyzing Competitive Defensibility
A structural moat is the only reliable barrier protecting long-term profits from relentless competitive erosion. Let’s dissect the moats of two key software infrastructure players:
CyberArk Software Ltd.: Intangible Assets with Value Erosion
CyberArk’s moat stems from specialized cybersecurity software and strong customer relationships. However, its negative ROIC versus WACC signals value destruction and declining profitability. New SaaS products may stabilize but won’t fully reverse this trend in 2026.
F5, Inc.: Efficient Capital Allocation and Growing ROIC
F5’s moat relies on cost advantages and scalable multi-cloud application security solutions. Its ROIC comfortably exceeds WACC with a positive growth trend, showing efficient capital use and expanding profitability. Cloud partnerships could deepen its moat further in 2026.
Moat Strength Showdown: Intangible Assets vs. Capital Efficiency
F5 possesses the deeper, more durable moat, reflected in strong ROIC and margin expansion versus CyberArk’s value destruction. F5 is better positioned to defend and grow market share amid intensifying competition.
Which stock offers better returns?
The past year shows CyberArk Software Ltd. surging early before recent losses, while F5, Inc. steadily accelerates with growing buyer interest.
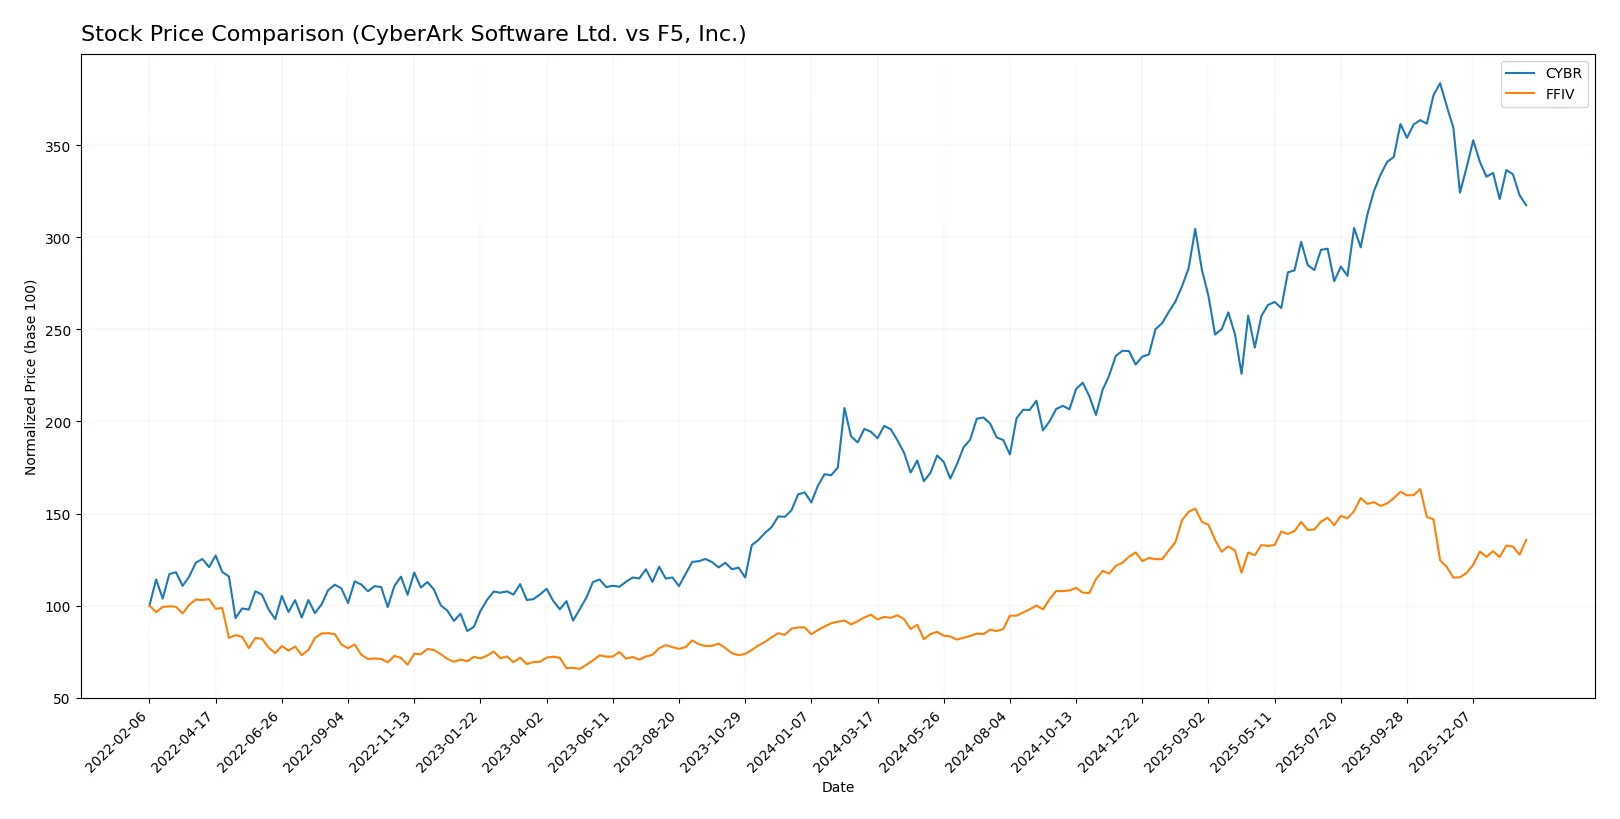
Trend Comparison
CyberArk Software Ltd. gained 63.33% over the last 12 months, marking a bullish trend with decelerating momentum. Prices ranged from 227.32 to 520.78, recently falling 11.7% amid seller dominance.
F5, Inc. rose 42.85% over the year, reflecting a bullish trend with accelerating gains. The stock climbed from 165.57 to 331.75, posting a recent 17.78% increase supported by strong buyer dominance.
CyberArk outperformed F5 in total annual returns, but recent trends favor F5’s upward momentum and buyer control in the latest months.
Target Prices
Analysts present a bullish consensus for both CyberArk Software Ltd. and F5, Inc., indicating upside potential from current prices.
| Company | Target Low | Target High | Consensus |
|---|---|---|---|
| CyberArk Software Ltd. | 455 | 520 | 486.2 |
| F5, Inc. | 295 | 352 | 330.67 |
CyberArk’s consensus target of 486.2 suggests a 13% upside from its current 430.83 price. F5, Inc.’s target consensus at 330.67 implies a significant 20% potential gain above its 275.61 market price.

Don’t Let Luck Decide Your Entry Point
Optimize your entry points with our advanced ProRealTime indicators. You’ll get efficient buy signals with precise price targets for maximum performance. Start outperforming now!
How do institutions grade them?
CyberArk Software Ltd. Grades
The following table summarizes recent institutional grades for CyberArk Software Ltd.:
| Grading Company | Action | New Grade | Date |
|---|---|---|---|
| Oppenheimer | Maintain | Outperform | 2024-10-22 |
| Keybanc | Maintain | Overweight | 2024-10-18 |
| Mizuho | Maintain | Outperform | 2024-10-17 |
| BTIG | Maintain | Buy | 2024-10-09 |
| Barclays | Maintain | Overweight | 2024-10-07 |
| Wedbush | Maintain | Outperform | 2024-10-01 |
| Jefferies | Maintain | Buy | 2024-09-24 |
| Wedbush | Maintain | Outperform | 2024-08-09 |
| Keybanc | Maintain | Overweight | 2024-08-09 |
| Cantor Fitzgerald | Maintain | Overweight | 2024-08-09 |
F5, Inc. Grades
The following table summarizes recent institutional grades for F5, Inc.:
| Grading Company | Action | New Grade | Date |
|---|---|---|---|
| Needham | Maintain | Hold | 2026-01-28 |
| Piper Sandler | Maintain | Overweight | 2026-01-28 |
| Goldman Sachs | Maintain | Neutral | 2026-01-28 |
| Barclays | Maintain | Equal Weight | 2026-01-28 |
| RBC Capital | Maintain | Outperform | 2026-01-28 |
| JP Morgan | Upgrade | Overweight | 2026-01-15 |
| Piper Sandler | Upgrade | Overweight | 2026-01-05 |
| RBC Capital | Upgrade | Outperform | 2026-01-05 |
| Morgan Stanley | Maintain | Equal Weight | 2025-12-17 |
| Morgan Stanley | Maintain | Equal Weight | 2025-10-28 |
Which company has the best grades?
CyberArk consistently receives strong buy-side grades like Outperform and Overweight. F5’s grades range more broadly, including Hold and Equal Weight. CyberArk’s higher consensus grades may indicate stronger institutional confidence, potentially impacting investor sentiment positively.
Risks specific to each company
The following categories identify the critical pressure points and systemic threats facing both firms in the 2026 market environment:
1. Market & Competition
CyberArk Software Ltd.
- Faces tough competition in identity and privileged access management with pressure on margins.
F5, Inc.
- Competes in multi-cloud security with strong partnerships but must innovate continuously.
2. Capital Structure & Debt
CyberArk Software Ltd.
- Extremely low debt (0.01 D/E), signaling conservative leverage and financial stability.
F5, Inc.
- Low but higher debt ratio (0.06 D/E), manageable with strong interest coverage.
3. Stock Volatility
CyberArk Software Ltd.
- Beta 0.915 indicates slightly less volatility than the market, stable price range.
F5, Inc.
- Beta 0.975 suggests market-comparable volatility, with a wider recent price range.
4. Regulatory & Legal
CyberArk Software Ltd.
- Operates globally with exposure to data protection laws, especially EU and US regulations.
F5, Inc.
- Faces complex compliance demands across multi-cloud environments and global markets.
5. Supply Chain & Operations
CyberArk Software Ltd.
- Software delivery depends on cloud infrastructure and global sales channels, vulnerable to tech disruptions.
F5, Inc.
- Relies on hardware-software integration and global supply networks, sensitive to component shortages.
6. ESG & Climate Transition
CyberArk Software Ltd.
- Moderate ESG focus, mainly on data security and privacy; climate risks less pronounced.
F5, Inc.
- Increasing ESG initiatives, including energy-efficient products and supply chain sustainability.
7. Geopolitical Exposure
CyberArk Software Ltd.
- Headquartered in Israel, geopolitical tensions could impact operations and investor sentiment.
F5, Inc.
- US-based with global footprint; geopolitical risks include trade policies and foreign regulations.
Which company shows a better risk-adjusted profile?
CyberArk’s primary risk is its unfavorable profitability and negative returns, signaling operational challenges despite strong balance sheet health. F5’s most significant risk lies in competitive pressure to innovate in a fast-evolving multi-cloud market. Overall, F5 displays a superior risk-adjusted profile, supported by favorable financial metrics and stronger profitability. The recent data highlights CyberArk’s negative net margin and ROIC as critical concerns, while F5 maintains solid returns and financial stability, justifying greater investor confidence.
Final Verdict: Which stock to choose?
CyberArk’s superpower lies in its robust revenue growth and strong gross margins, signaling a promising market position. However, its declining profitability and negative returns on invested capital remain points of vigilance. It fits portfolios seeking aggressive growth with tolerance for operational risks.
F5, Inc. stands out with a durable competitive moat, demonstrated by consistent returns above its cost of capital and strong profitability metrics. Its financial stability and positive cash flow offer better safety compared to CyberArk. It suits investors looking for growth at a reasonable price with moderate risk exposure.
If you prioritize high-growth potential and can accept volatility, CyberArk could be the compelling choice given its expansion trajectory. However, if you seek better stability and proven value creation, F5 offers a stronger moat and financial resilience that outshines its peer, commanding a premium justified by its track record.
Disclaimer: Investment carries a risk of loss of initial capital. The past performance is not a reliable indicator of future results. Be sure to understand risks before making an investment decision.
Go Further
I encourage you to read the complete analyses of CyberArk Software Ltd. and F5, Inc. to enhance your investment decisions: