Home > Comparison > Healthcare > CVS vs HUM
The strategic rivalry between CVS Health Corporation and Humana Inc. shapes the healthcare plans industry’s future. CVS operates as a diversified healthcare services giant with extensive retail and pharmacy management. Humana focuses on health and well-being through specialty and supplemental insurance products. This analysis pits CVS’s scale and integration against Humana’s targeted growth model to identify which offers a superior risk-adjusted return for a diversified portfolio.

Table of contents
Companies Overview
CVS Health Corporation and Humana Inc. dominate the U.S. healthcare plans market with distinct operational scopes and strategic ambitions in 2026.
CVS Health Corporation: Integrated Healthcare Powerhouse
CVS Health Corporation stands as a healthcare services leader in the U.S. Its revenue primarily flows from pharmacy benefit management and retail pharmacy sales. In 2026, CVS sharpens its focus on expanding clinical services through its MinuteClinic network and enhancing pharmacy benefits to deepen consumer engagement.
Humana Inc.: Specialist in Health and Well-Being
Humana Inc. operates as a health and well-being company with core revenue from medical and supplemental insurance plans. The company emphasizes growth in Medicare, Medicaid, and specialty health benefits. In 2026, Humana prioritizes expanding home health services and specialty benefits to strengthen member health outcomes.
Strategic Collision: Similarities & Divergences
Both companies compete fiercely in healthcare plans but diverge in business models: CVS integrates retail and pharmacy services, while Humana focuses on insurance and care management. The primary battleground is managing cost and care quality in Medicare and Medicaid segments. CVS’s scale and retail presence contrast with Humana’s targeted specialty care, defining their unique investment risk and growth profiles.
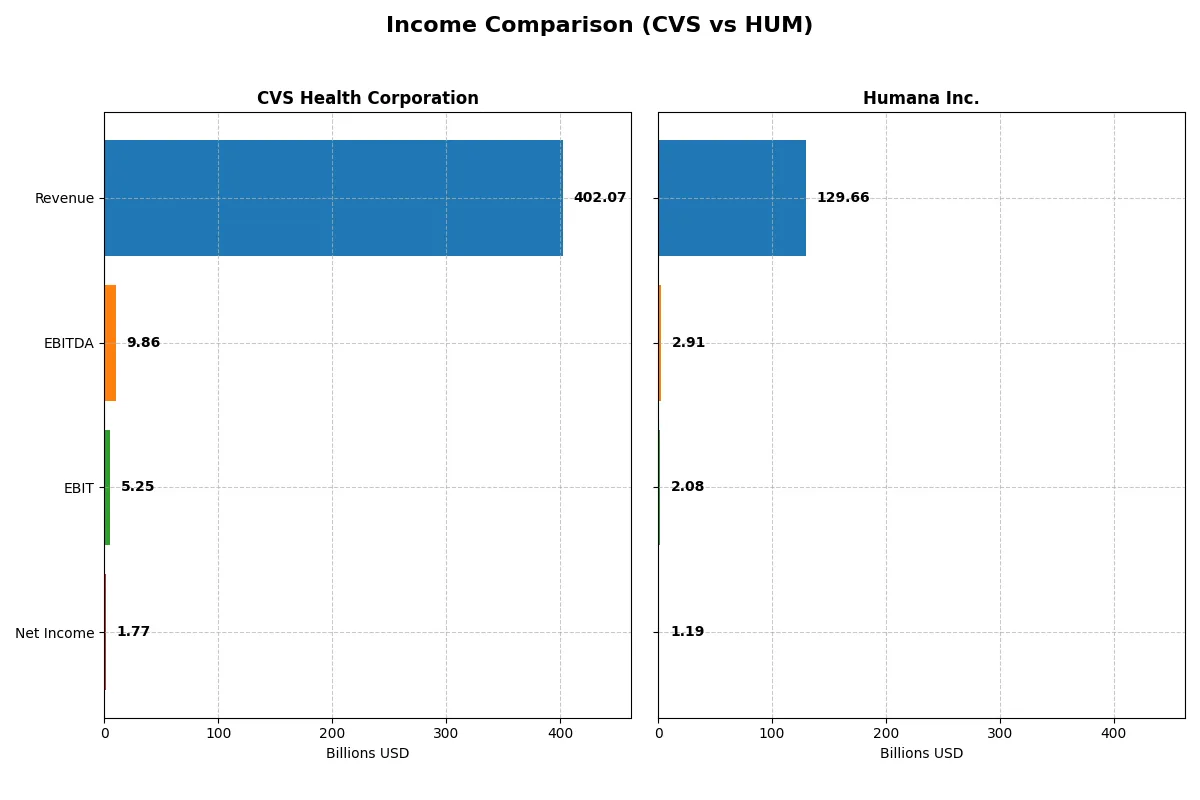
Income Statement Comparison
This data dissects the core profitability and scalability of both corporate engines to reveal who dominates the bottom line:
| Metric | CVS Health Corporation (CVS) | Humana Inc. (HUM) |
|---|---|---|
| Revenue | 402B | 130B |
| Cost of Revenue | 347B | 111B |
| Operating Expenses | 45B | 17.4B |
| Gross Profit | 55.4B | 18.9B |
| EBITDA | 9.9B | 2.9B |
| EBIT | 5.3B | 2.1B |
| Interest Expense | 3.1B | 631M |
| Net Income | 1.8B | 1.2B |
| EPS | 1.40 | 9.87 |
| Fiscal Year | 2025 | 2025 |
Income Statement Analysis: The Bottom-Line Duel
This income statement comparison reveals which company converts revenue into profit more efficiently amid shifting market conditions.
CVS Health Corporation Analysis
CVS grew revenue steadily from 292B in 2021 to 402B in 2025 but saw net income plunge from 8.0B to 1.8B over the same period. Its gross margin hovered around 13.8%, indicating stable cost control, yet net margin dropped sharply to 0.44% in 2025. The latest year shows weakening profitability despite revenue gains, signaling efficiency challenges.
Humana Inc. Analysis
Humana expanded revenue from 83B in 2021 to 130B in 2025 with moderate fluctuations. Net income declined from 2.9B to 1.2B, compressing net margin to 0.92% in 2025. Gross margin stayed around 14.5%, slightly above CVS’s, but earnings growth slowed. The recent year reflects solid top-line growth, yet profitability faces pressure from rising expenses.
Margin Stability vs. Top-Line Expansion
Both companies experience revenue growth but struggle with net income declines and margin compression. CVS’s larger scale masks its sharper profit deterioration, while Humana maintains better margin ratios despite lower absolute earnings. Investors seeking stability may prefer Humana’s steadier margins; those betting on scale face notable profit erosion risks with CVS.
Financial Ratios Comparison
These vital ratios act as a diagnostic tool to expose the underlying fiscal health, valuation premiums, and capital efficiency of the companies compared below:
| Ratios | CVS Health Corporation (CVS) | Humana Inc. (HUM) |
|---|---|---|
| ROE | 2.35% | N/A |
| ROIC | 4.92% | N/A |
| P/E | 56.87 | 25.97 |
| P/B | 1.34 | 0 |
| Current Ratio | 0.84 | 0 |
| Quick Ratio | 0.63 | 0 |
| D/E | 1.06 | 0 |
| Debt-to-Assets | 31.5% | 0 |
| Interest Coverage | 3.33 | 4.29 |
| Asset Turnover | 1.59 | 0 |
| Fixed Asset Turnover | 14.33 | 0 |
| Payout ratio | 192% | 36.2% |
| Dividend yield | 3.38% | 1.39% |
| Fiscal Year | 2025 | 2025 |
Efficiency & Valuation Duel: The Vital Signs
Financial ratios act as a company’s DNA, exposing hidden risks and operational efficiency crucial for investment insights.
CVS Health Corporation
CVS shows weak profitability with ROE at 2.35% and a stretched P/E of 56.87, indicating an expensive valuation. Its asset turnover is strong, reflecting operational efficiency. CVS returns value through a 3.38% dividend yield, signaling a commitment to shareholder income despite modest growth prospects.
Humana Inc.
Humana posts a negligible ROE and zero ROIC, with a more moderate P/E of 25.97 but still flagged as unfavorable. The firm reports no tangible asset turnover data and yields a lower dividend of 1.39%. Its capital structure is notably clean with zero debt, suggesting a conservative financial posture.
Valuation Stretch vs. Operational Weakness
Both companies face unfavorable profitability metrics, but CVS carries a premium valuation with stronger asset utilization and a higher dividend yield. Humana’s lack of leverage and lower yield may suit risk-averse investors, while CVS aligns better with those seeking income amid operational challenges.
Which one offers the Superior Shareholder Reward?
I see CVS Health yields a robust 3.38% dividend with a payout ratio near 192%, signaling potential stress in coverage despite solid free cash flow of 6.16/share and consistent buybacks. Humana pays a lower 1.39% dividend with a sustainable 36% payout, reinvesting heavily in growth and acquisitions while maintaining modest buybacks. Historically, CVS’s aggressive payouts could risk earnings volatility, whereas Humana’s balanced dividend and reinvestment strategy align better with long-term value creation. I conclude Humana offers a more attractive total return profile in 2026 due to its sustainable distribution and growth focus.
Comparative Score Analysis: The Strategic Profile
The radar chart reveals the fundamental DNA and trade-offs of both CVS Health Corporation and Humana Inc., highlighting their relative financial strengths and weaknesses:
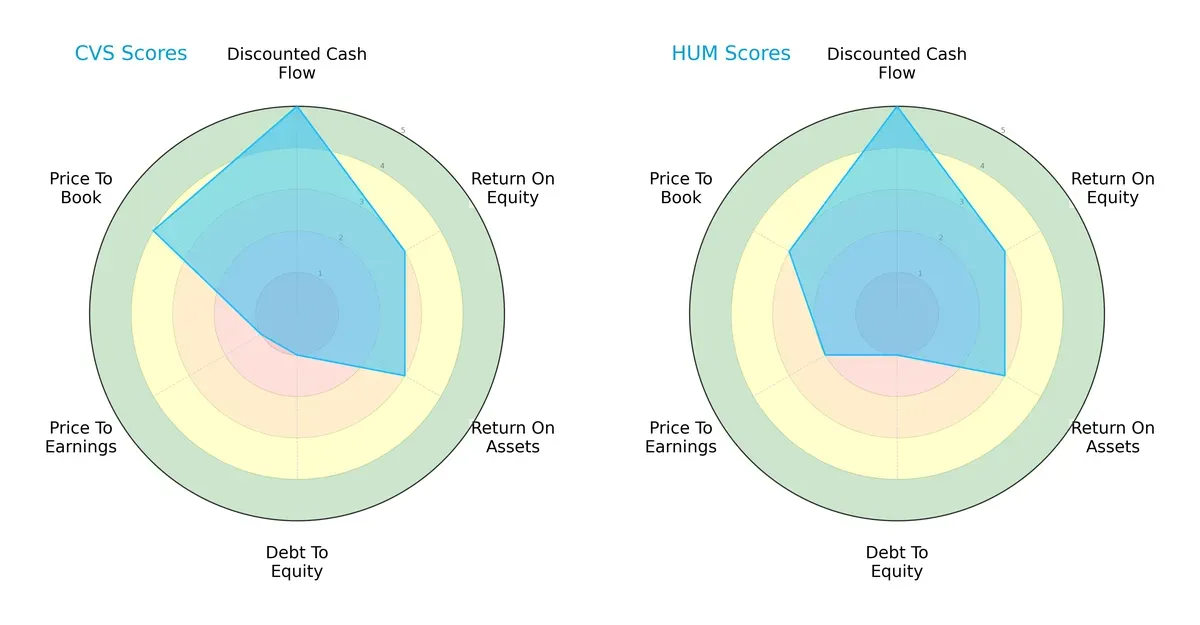
Both firms share a similar overall score of 3, with strong discounted cash flow (score 5) and moderate returns on equity and assets (score 3). However, both suffer from very unfavorable debt-to-equity scores (1), signaling high leverage risk. CVS fares worse on valuation metrics with very unfavorable P/E (1) but favorable P/B (4), while Humana has a slightly better P/E (2) and moderate P/B (3). Humana’s profile appears more balanced in valuation, whereas CVS relies heavily on its book value advantage.
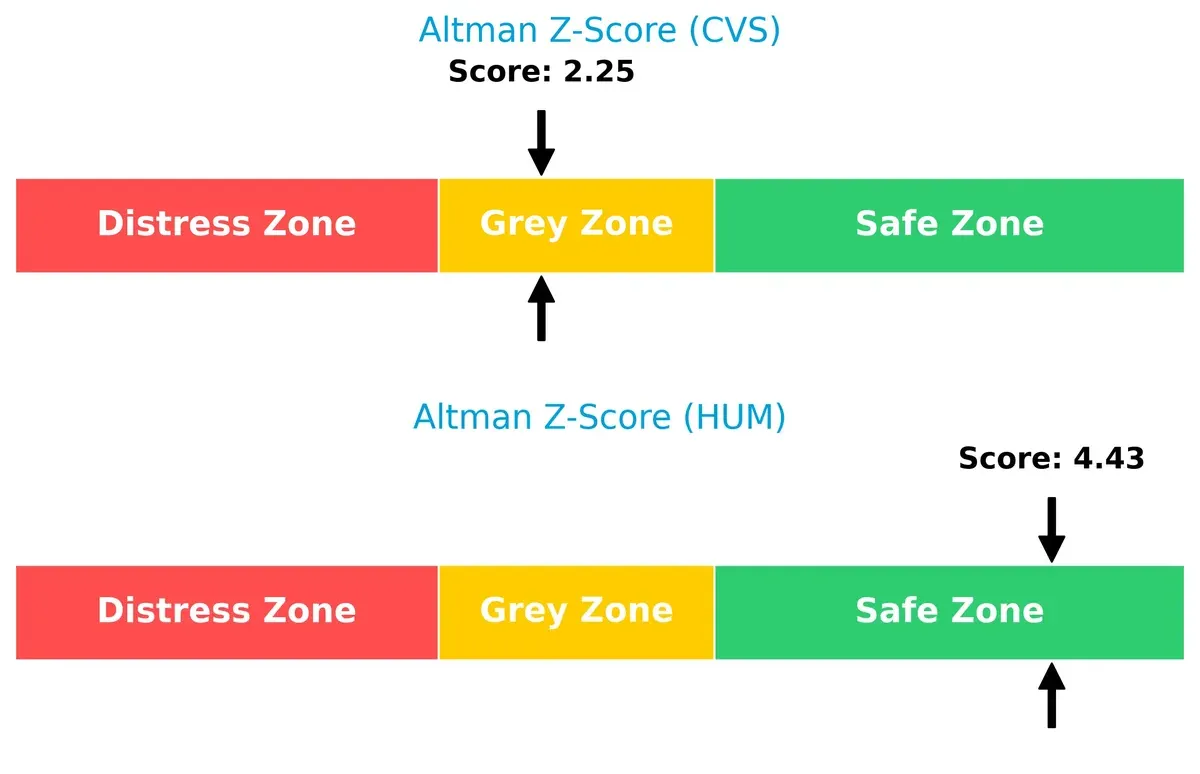
Bankruptcy Risk: Solvency Showdown
The Altman Z-Score differential favors Humana (4.43, safe zone) over CVS (2.25, grey zone), implying Humana possesses stronger long-term solvency and lower bankruptcy risk in this economic cycle:
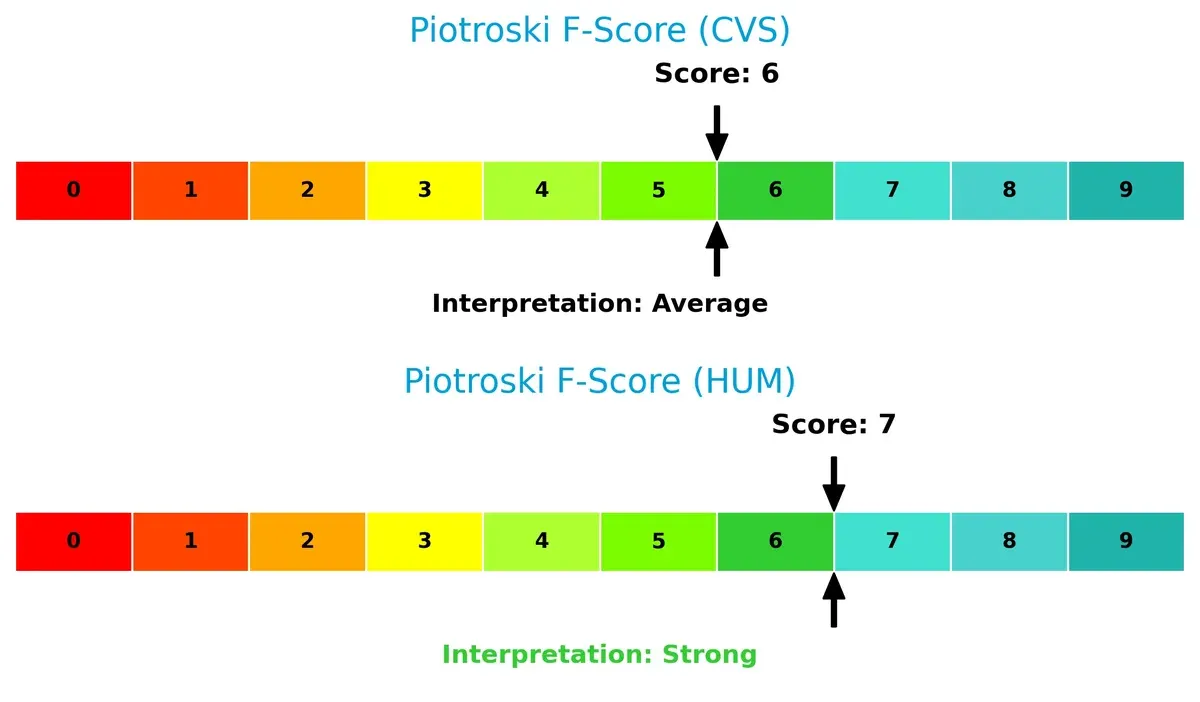
Financial Health: Quality of Operations
Humana’s Piotroski F-Score of 7 indicates robust financial health and operational quality, outperforming CVS’s average score of 6. CVS’s lower score raises subtle red flags in internal metrics compared to Humana:
How are the two companies positioned?
This section dissects the operational DNA of CVS and HUM by comparing their revenue distribution and internal strengths and weaknesses. The goal is to confront their economic moats to reveal which model delivers the most resilient, sustainable competitive advantage today.
Revenue Segmentation: The Strategic Mix
This visual comparison dissects how CVS Health Corporation and Humana Inc. diversify their income streams and where their primary sector bets lie:
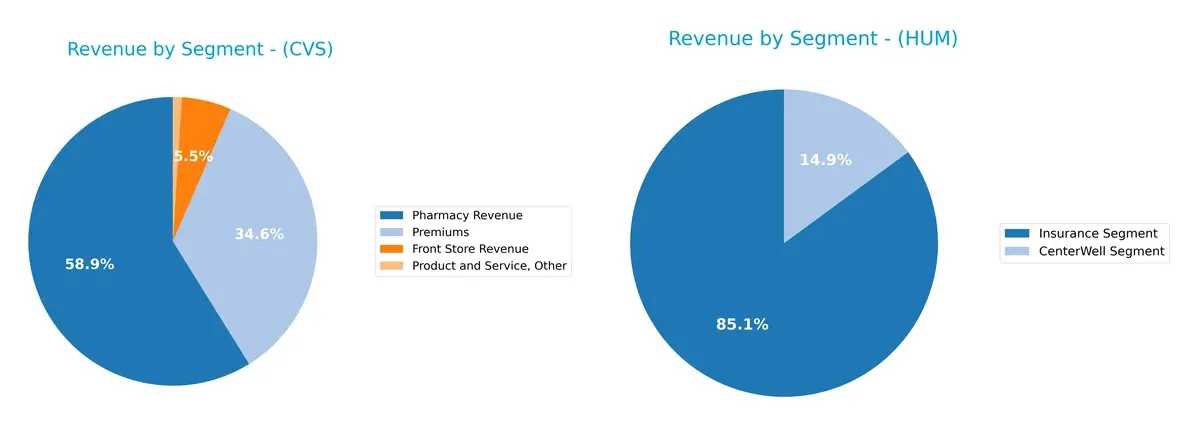
CVS anchors its revenue in Pharmacy at $229B and Premiums at $135B, with smaller contributions from Front Store ($21B) and Other ($3.9B). Humana pivots on Insurance at $114B, supported by CenterWell Segment at $20B. CVS shows a more diversified portfolio across services and retail, mitigating concentration risk. Humana relies heavily on insurance, reflecting ecosystem lock-in but higher exposure to regulatory shifts. This contrast reveals distinct strategic focuses in healthcare markets.
Strengths and Weaknesses Comparison
This table compares the Strengths and Weaknesses of CVS Health Corporation and Humana Inc.:
CVS Strengths
- Diverse revenue streams including pharmacy, premiums, and front store segments
- Favorable asset and fixed asset turnover ratios
- Dividend yield at 3.38% provides income stability
- Favorable price-to-book ratio at 1.34
Humana Strengths
- Favorable debt-to-equity and debt-to-assets ratios indicate lower leverage
- Neutral interest coverage ratio at 3.3 suggests manageable interest expenses
- Favorable price-to-book ratio despite unavailable WACC
- Insurance and CenterWell segments generating significant revenues
CVS Weaknesses
- Low profitability with net margin at 0.44% and ROE at 2.35%
- High debt-to-equity ratio at 1.06 and weak current and quick ratios
- Elevated price-to-earnings ratio at 56.87 signals high valuation risk
- Interest coverage ratio at 1.68 indicates tight debt servicing ability
Humana Weaknesses
- Zero reported ROE and ROIC reflect weak profitability
- Unfavorable net margin at 0.92% and price-to-earnings at 25.97
- Absence of liquidity ratios and asset turnover data limits financial visibility
- Dividend yield at 1.39% is neutral, less attractive for income investors
CVS demonstrates strong operational efficiency and diverse revenue sources but struggles with profitability and liquidity. Humana shows conservative leverage and segment focus but exhibits weak profitability and incomplete liquidity transparency. Both face challenges to improve financial returns amid their sector dynamics.
The Moat Duel: Analyzing Competitive Defensibility
A structural moat protects long-term profits from competitive erosion. Without it, market share and pricing power quickly dissipate:
CVS Health Corporation: Integrated Healthcare Network Moat
I identify CVS’s moat in its vertical integration, combining pharmacy services with health benefits. This synergy stabilizes margins and boosts ROIC. However, declining ROIC signals margin pressure. New healthcare services in 2026 could deepen its moat if efficiently executed.
Humana Inc.: Focused Medicare Advantage Moat
Humana’s moat stems from its specialized Medicare Advantage plans, which benefit from regulatory barriers and customer loyalty. Its revenue growth outpaces CVS, but recent margin compression challenges profitability. Expansion into home health services offers growth but risks disrupting margins.
Integrated Network vs. Specialized Medicare: Moat Depth Showdown
CVS’s broader integration faces margin erosion, while Humana’s niche Medicare advantage sustains revenue growth despite margin pressure. CVS’s declining ROIC weakens its moat, making Humana better positioned to defend market share in 2026.
Which stock offers better returns?
The past year reveals contrasting price dynamics: CVS Health Corporation’s stock remained flat with decelerating momentum, while Humana Inc. faced a steep bearish decline marked by accelerating losses.
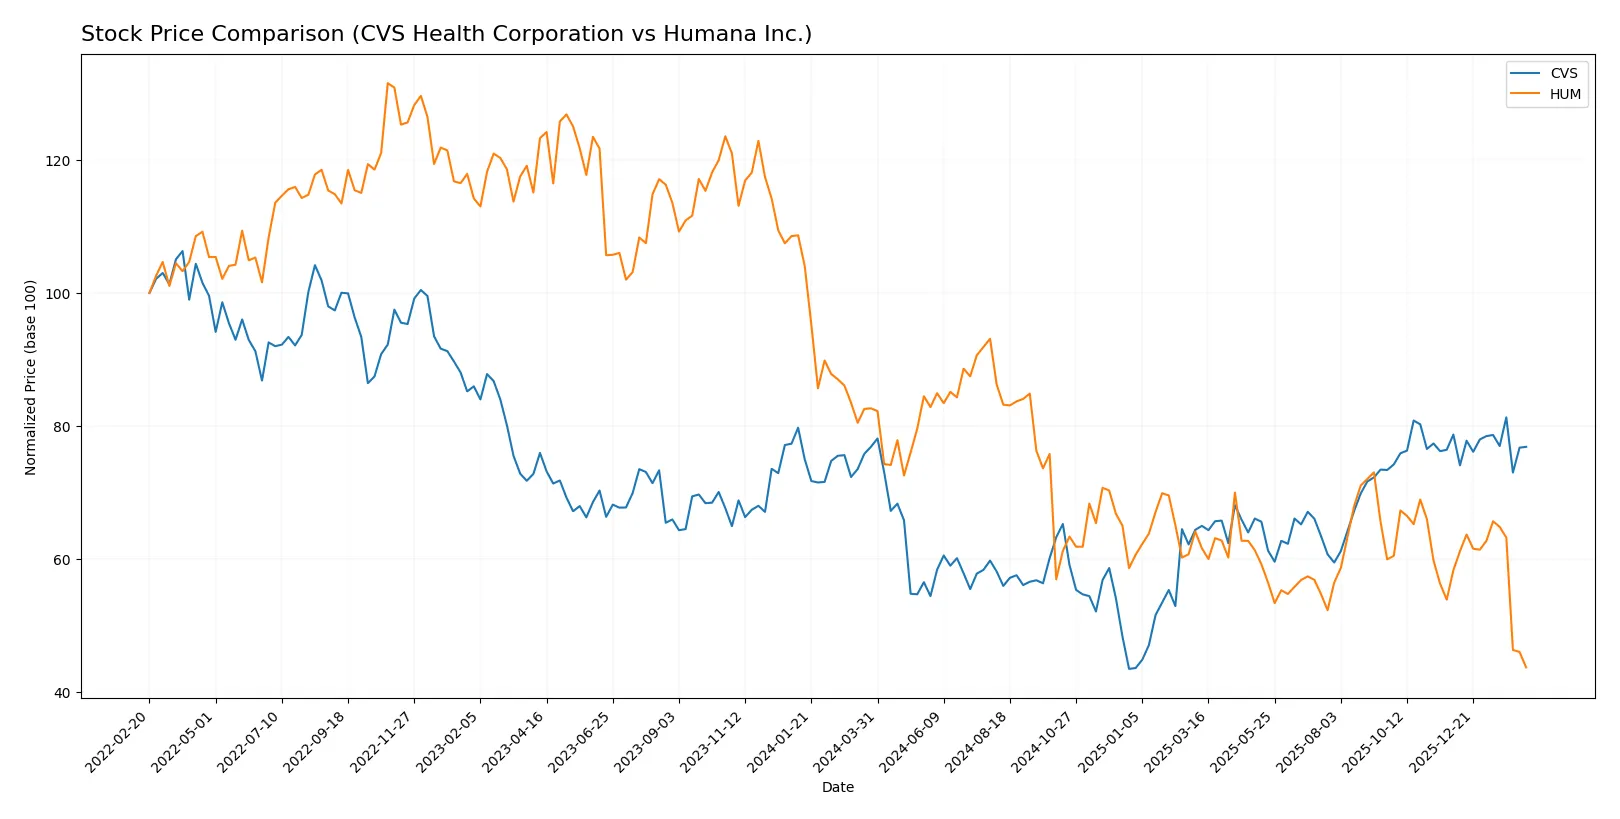
Trend Comparison
CVS Health Corporation’s stock showed a flat overall trend with 0.0% price change over the past 12 months. The trend decelerated despite a high volatility of 9.43%, peaking at 83.01 and bottoming at 44.36.
Humana Inc. experienced a bearish trend with a -47.18% price decline over the past year. The trend decelerated amid extreme volatility of 46.15%, hitting a high of 392.63 and a low of 184.1.
Comparing the two, CVS delivered the highest market stability with a neutral price change, while Humana suffered a significant loss, reflecting a sharp underperformance.
Target Prices
Analysts present a constructive consensus on CVS Health Corporation and Humana Inc., indicating room for appreciation.
| Company | Target Low | Target High | Consensus |
|---|---|---|---|
| CVS Health Corporation | 90 | 103 | 94.92 |
| Humana Inc. | 146 | 345 | 247.07 |
CVS trades at $78.48, well below its consensus target of $94.92, signaling potential upside. Humana’s current price of $184.10 is also beneath the $247.07 target, reflecting optimistic analyst expectations.

Don’t Let Luck Decide Your Entry Point
Optimize your entry points with our advanced ProRealTime indicators. You’ll get efficient buy signals with precise price targets for maximum performance. Start outperforming now!
How do institutions grade them?
CVS Health Corporation Grades
The following table summarizes recent grades issued by leading grading firms for CVS Health Corporation:
| Grading Company | Action | New Grade | Date |
|---|---|---|---|
| Argus Research | Maintain | Buy | 2026-01-28 |
| B of A Securities | Maintain | Buy | 2026-01-27 |
| JP Morgan | Maintain | Overweight | 2025-12-17 |
| Bernstein | Maintain | Market Perform | 2025-12-12 |
| Baird | Maintain | Outperform | 2025-12-10 |
| Mizuho | Maintain | Outperform | 2025-12-10 |
| Truist Securities | Maintain | Buy | 2025-12-10 |
| UBS | Maintain | Buy | 2025-12-10 |
| Barclays | Maintain | Overweight | 2025-12-10 |
| Piper Sandler | Maintain | Overweight | 2025-12-10 |
Humana Inc. Grades
Below is a summary of recent grades issued by recognized grading firms for Humana Inc.:
| Grading Company | Action | New Grade | Date |
|---|---|---|---|
| TD Cowen | Maintain | Hold | 2026-02-13 |
| Cantor Fitzgerald | Maintain | Neutral | 2026-02-12 |
| Jefferies | Maintain | Buy | 2026-02-12 |
| Guggenheim | Maintain | Buy | 2026-02-12 |
| RBC Capital | Downgrade | Sector Perform | 2026-02-12 |
| UBS | Maintain | Neutral | 2026-02-12 |
| Morgan Stanley | Downgrade | Underweight | 2026-02-02 |
| Wells Fargo | Downgrade | Equal Weight | 2026-01-07 |
| Barclays | Maintain | Equal Weight | 2026-01-05 |
| Morgan Stanley | Maintain | Equal Weight | 2025-12-18 |
Which company has the best grades?
CVS Health Corporation consistently receives higher grades such as Buy, Outperform, and Overweight from multiple firms. Humana Inc. shows a mixed rating profile with recent downgrades and many Hold/Neutral evaluations. CVS’s stronger grades could suggest more institutional confidence, potentially influencing investor sentiment positively.
Risks specific to each company
The following categories identify the critical pressure points and systemic threats facing both firms in the 2026 market environment:
1. Market & Competition
CVS Health Corporation
- Faces intense competition in retail pharmacy and health plans, pressured by margin compression.
Humana Inc.
- Operates in a competitive health insurance market, with challenges in expanding membership and product diversification.
2. Capital Structure & Debt
CVS Health Corporation
- High debt-to-equity ratio (1.06) signals elevated financial leverage and risk. Interest coverage is weak at 1.68.
Humana Inc.
- Maintains a very low debt profile, indicating conservative leverage and stronger balance sheet stability.
3. Stock Volatility
CVS Health Corporation
- Beta of 0.50 shows low stock volatility, implying relative stability versus the market.
Humana Inc.
- Beta of 0.44 indicates slightly lower volatility, suggesting cautious investor sentiment.
4. Regulatory & Legal
CVS Health Corporation
- Exposure to evolving healthcare regulations and reimbursement policies may impact profitability.
Humana Inc.
- Relies heavily on government programs like Medicare and Medicaid, exposing it to regulatory shifts.
5. Supply Chain & Operations
CVS Health Corporation
- Large retail footprint and pharmacy operations face logistical and inventory management risks.
Humana Inc.
- Focuses on insurance and healthcare services, with operational risks tied to provider networks and service delivery.
6. ESG & Climate Transition
CVS Health Corporation
- Increasing scrutiny on environmental impact and social governance in retail and healthcare sectors.
Humana Inc.
- Growing focus on social responsibility and sustainable healthcare delivery models.
7. Geopolitical Exposure
CVS Health Corporation
- Primary operations in the US limit direct geopolitical risks but sensitive to domestic policy changes.
Humana Inc.
- US-centric business reduces geopolitical risk but exposes the firm to federal healthcare policy volatility.
Which company shows a better risk-adjusted profile?
The single most impactful risk for CVS is its high financial leverage and weak debt coverage, raising solvency concerns amid margin pressures. Humana’s greatest risk lies in regulatory dependency, particularly on government healthcare programs vulnerable to policy shifts. Humana’s stronger Altman Z-Score (4.43 vs. 2.25) and better Piotroski score reflect superior financial health and resilience. Thus, Humana presents a better risk-adjusted profile in 2026, supported by its conservative capital structure and robust financial scores despite regulatory exposure.
Final Verdict: Which stock to choose?
CVS Health Corporation’s superpower lies in its vast scale and cash flow generation, enabling it to navigate complex healthcare markets. However, its declining profitability and weak liquidity ratios are points of vigilance. It suits portfolios seeking steady exposure to a large, diversified healthcare player with moderate risk tolerance.
Humana Inc. boasts a strategic moat through its focused presence in managed care and recurring revenue streams. Compared to CVS, it presents a cleaner balance sheet and stronger financial health signals, offering better defensive qualities. It fits well in Growth at a Reasonable Price (GARP) portfolios aiming for stability with upside potential.
If you prioritize scale and diversified cash flow streams, CVS is the compelling choice due to its market footprint despite profitability challenges. However, if you seek financial resilience and a clearer moat in managed care, Humana offers better stability and a stronger fundamental base, albeit with recent price volatility. Both require careful risk management given their sector dynamics.
Disclaimer: Investment carries a risk of loss of initial capital. The past performance is not a reliable indicator of future results. Be sure to understand risks before making an investment decision.
Go Further
I encourage you to read the complete analyses of CVS Health Corporation and Humana Inc. to enhance your investment decisions: