Home > Comparison > Healthcare > CVS vs CI
The strategic rivalry between CVS Health Corporation and Cigna Corporation shapes the competitive landscape of the healthcare plans sector. CVS operates an integrated model combining retail pharmacy and health benefits, while Cigna focuses on coordinated insurance and health services. This head-to-head pits CVS’s vertical integration against Cigna’s diversified health solutions. This analysis will assess which business model delivers a superior risk-adjusted return for a balanced portfolio in the evolving healthcare industry.
Table of contents
Companies Overview
CVS Health Corporation and Cigna Corporation are two pivotal players in the US healthcare insurance and services market.
CVS Health Corporation: Integrated Healthcare Services Leader
CVS dominates as a healthcare services provider blending insurance, pharmacy benefits, and retail pharmacy operations. Its core revenue stems from managing pharmacy benefits and operating retail pharmacies with nearly 9,900 locations. In 2021, CVS emphasized expanding its healthcare benefits and retail clinic services, integrating pharmacy and medical care to capture more consumer touchpoints.
Cigna Corporation: Global Health Insurance Powerhouse
Cigna stands out as a diversified health insurance and services firm, generating revenue through comprehensive insurance products and coordinated health services. Its Evernorth segment drives growth by offering integrated pharmacy and care management solutions. In 2021, Cigna focused on strengthening its coordinated health services and expanding Medicare-related plans, targeting a broad client base including international and mobile populations.
Strategic Collision: Similarities & Divergences
Both companies pursue integrated healthcare but differ fundamentally: CVS combines retail pharmacy with insurance under one roof, while Cigna emphasizes a coordinated health services platform with a focus on insurance products. Their primary battleground is pharmacy benefit management and care coordination. CVS offers a consumer-facing retail moat, whereas Cigna leans on insurance underwriting and international reach, resulting in distinct investment profiles anchored in different healthcare strategies.
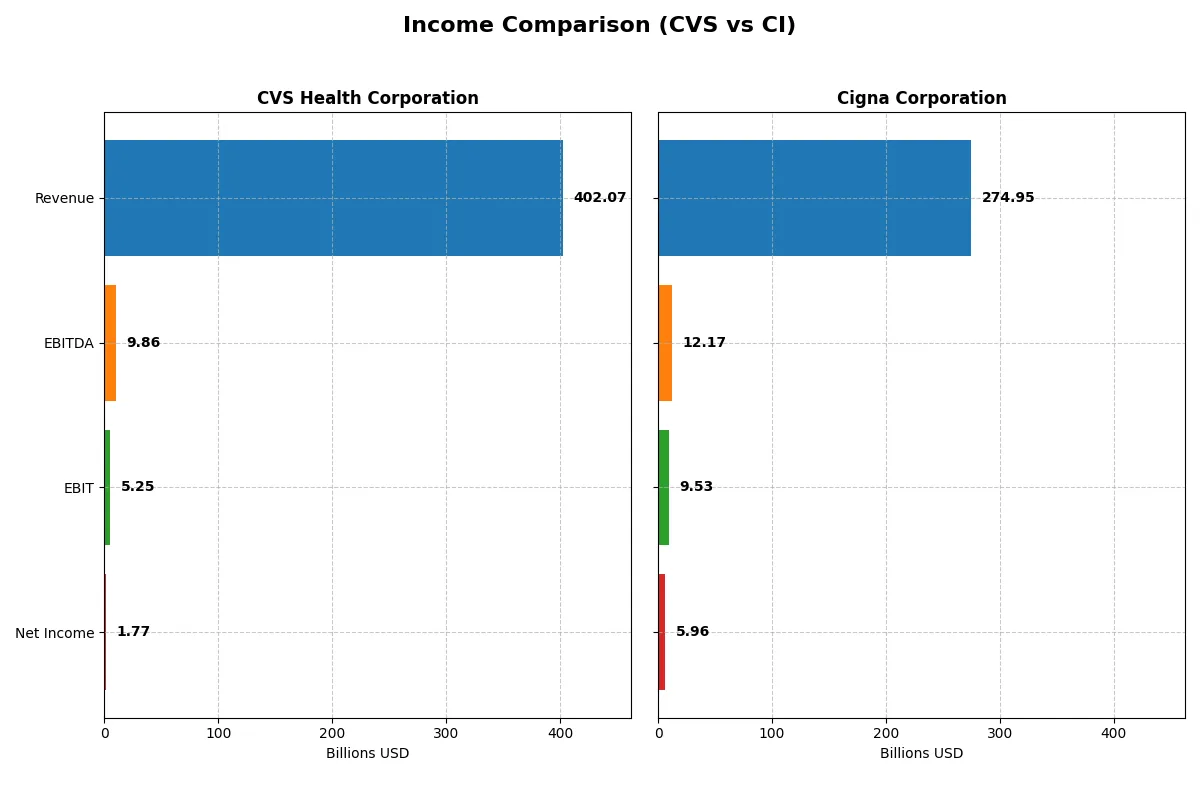
Income Statement Comparison
This data dissects the core profitability and scalability of both corporate engines to reveal who dominates the bottom line:
| Metric | CVS Health Corporation (CVS) | Cigna Corporation (CI) |
|---|---|---|
| Revenue | 402B | 275B |
| Cost of Revenue | 347B | 249B |
| Operating Expenses | 45B | 17B |
| Gross Profit | 55B | 26B |
| EBITDA | 9.9B | 12.2B |
| EBIT | 5.3B | 9.5B |
| Interest Expense | 3.1B | 1.4B |
| Net Income | 1.8B | 6.0B |
| EPS | 1.4 | 22.3 |
| Fiscal Year | 2025 | 2025 |
Income Statement Analysis: The Bottom-Line Duel
The following income statement comparison uncovers which company runs a more efficient and profitable business engine through revenue and margin analysis.
CVS Health Corporation Analysis
CVS grew revenue steadily from $292B in 2021 to $402B in 2025, a 38% increase. However, net income plunged from $8B to just $1.8B, signaling margin compression. Gross margin hovered around 13.8%, but net margin fell sharply to 0.44% in 2025. The latest year shows revenue growth momentum but deteriorating profitability, reflecting rising expenses and weaker bottom-line efficiency.
Cigna Corporation Analysis
Cigna expanded revenue from $174B in 2021 to $275B in 2025, a 58% surge, outpacing CVS by a wide margin. Net income improved from $5.4B to nearly $6B, with net margins at a healthier 2.17%. Despite a slight EBIT dip in 2025, Cigna maintained stable gross margins near 9.5%. Its recent performance signals robust top-line growth paired with improving earnings quality and operational discipline.
Revenue Growth vs. Margin Resilience
Cigna clearly outperforms CVS in balancing revenue expansion with net income growth. CVS’s top-line gains fail to translate into earnings, highlighting margin pressures and profitability challenges. Conversely, Cigna delivers both strong revenue gains and margin stability, underlining superior operational efficiency. Investors seeking earnings durability amid growth will find Cigna’s profile more compelling in this comparison.
Financial Ratios Comparison
These vital ratios act as a diagnostic tool to expose the underlying fiscal health, valuation premiums, and capital efficiency of the companies analyzed:
| Ratios | CVS Health Corporation (CVS) | Cigna Corporation (CI) |
|---|---|---|
| ROE | 2.35% | 0% |
| ROIC | 4.92% | 0% |
| P/E | 56.87 | 12.29 |
| P/B | 1.34 | 0 |
| Current Ratio | 0.84 | 0 |
| Quick Ratio | 0.63 | 0 |
| D/E (Debt/Equity) | 1.06 | 0 |
| Debt-to-Assets | 31.5% | 0% |
| Interest Coverage | 3.33 | 6.61 |
| Asset Turnover | 1.59 | 0 |
| Fixed Asset Turnover | 14.33 | 0 |
| Payout ratio | 192.1% | 27.0% |
| Dividend yield | 3.38% | 2.19% |
| Fiscal Year | 2025 | 2025 |
Efficiency & Valuation Duel: The Vital Signs
Financial ratios act as a company’s DNA, uncovering hidden risks and operational strengths that raw numbers alone cannot reveal.
CVS Health Corporation
CVS posts a low ROE of 2.35% and a net margin under 1%, signaling weak core profitability. The stock trades at a stretched P/E of 56.87, reflecting expensive valuation despite a favorable price-to-book of 1.34. CVS supports shareholders with a solid 3.38% dividend yield, balancing reinvestment with steady income.
Cigna Corporation
Cigna reveals an unimpressive net margin of 2.17% and zero reported ROE, limiting insight into profitability. Its P/E ratio of 12.29 appears attractive and valuation metrics favor investors. The company pays a 2.19% dividend yield and maintains strong interest coverage of 6.9, indicating financial stability despite some missing ratio data.
Premium Valuation vs. Operational Safety
CVS shows a stretched valuation with weak profitability but rewards shareholders generously via dividends. Cigna offers a more reasonable valuation and stronger financial safety, although some key profitability metrics are unavailable. Risk-averse investors may prefer Cigna’s stability; those seeking dividend income might lean toward CVS.
Which one offers the Superior Shareholder Reward?
I compare CVS Health and Cigna based on dividends, payout ratios, and buybacks. CVS yields 3.38% with a payout ratio near 192%, signaling potential sustainability risks despite solid free cash flow coverage (73%). CVS pairs dividends with moderate buybacks. Cigna yields 2.19% with a conservative 27% payout ratio, indicating room to grow payouts sustainably. Cigna’s reinvestment strategy supports growth, complemented by consistent buybacks. I see Cigna’s balanced distribution and capital allocation as more sustainable, offering a superior total return profile for 2026 investors.
Comparative Score Analysis: The Strategic Profile
The radar chart reveals the fundamental DNA and trade-offs of CVS Health Corporation and Cigna Corporation, highlighting their distinct financial strengths and vulnerabilities:
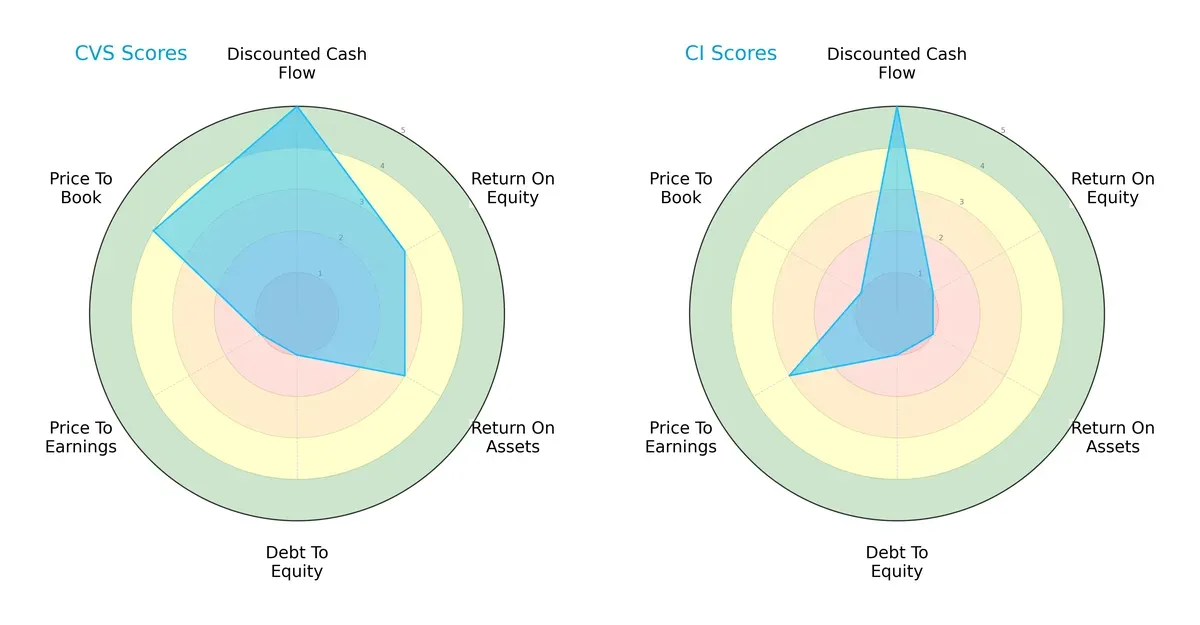
CVS presents a more balanced financial profile, excelling in discounted cash flow (DCF) with a top score of 5 and favorable price-to-book valuation at 4. Cigna matches CVS’s DCF strength but lags significantly in return on equity (ROE) and return on assets (ROA), both scoring 1 versus CVS’s moderate 3. Both firms share very unfavorable debt-to-equity risk, but CVS’s valuation metrics lean more favorable. Overall, CVS demonstrates a diversified edge while Cigna depends heavily on DCF strength.
Bankruptcy Risk: Solvency Showdown
The Altman Z-Scores place both CVS (2.25) and Cigna (2.68) in the grey zone, indicating moderate bankruptcy risk in this cycle:
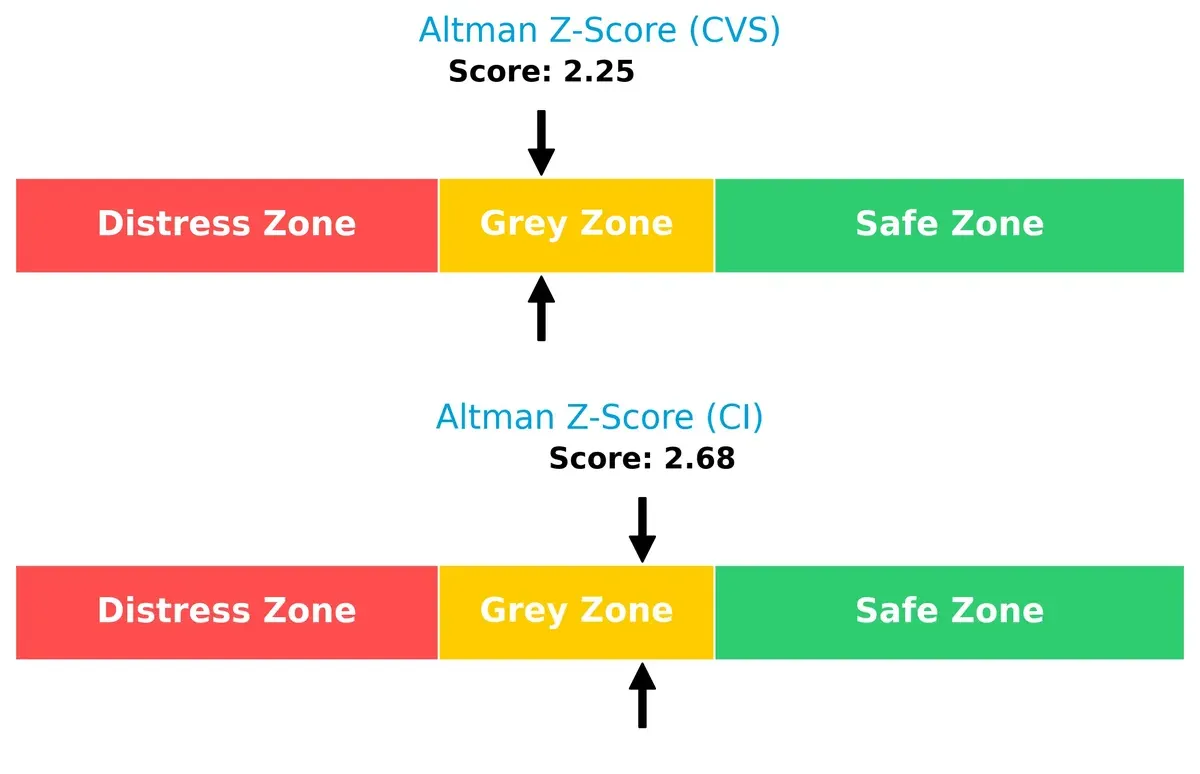
Neither company is fully insulated from financial distress, but Cigna’s higher Z-score suggests slightly better solvency prospects. Investors should watch leverage and cash flow trends closely.
Financial Health: Quality of Operations
CVS scores a 6 while Cigna is at 5 on the Piotroski F-Score scale, both representing average financial health with no immediate red flags:
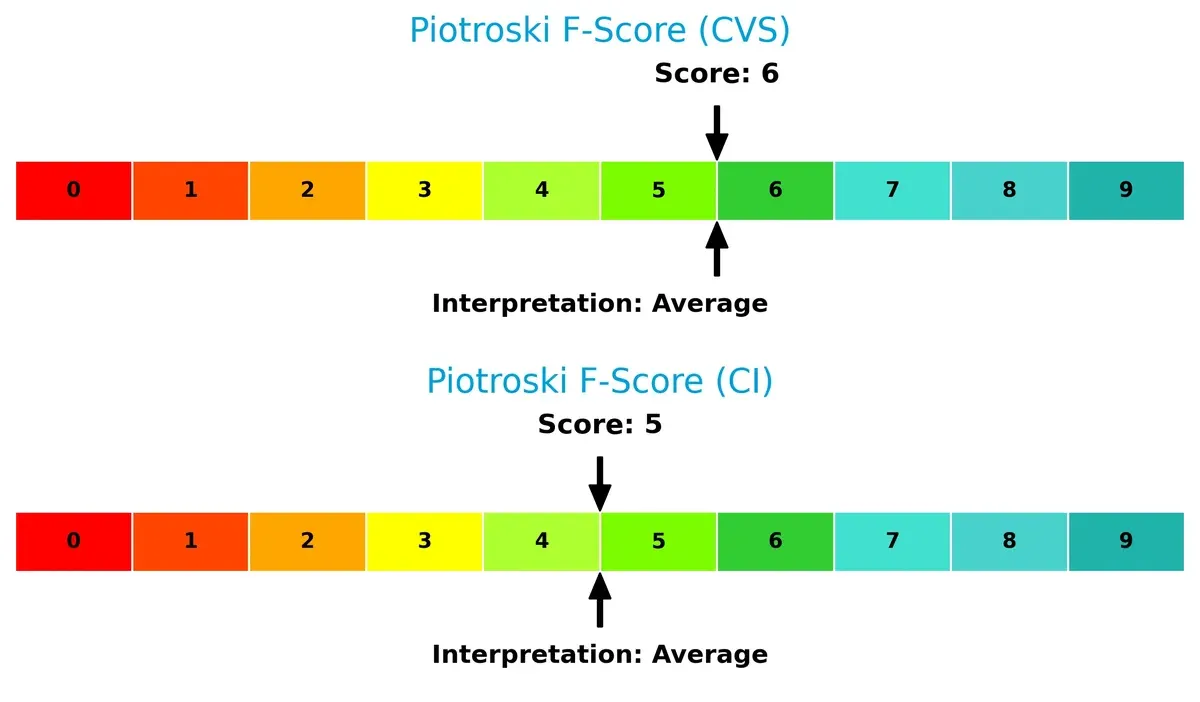
CVS holds a marginal advantage in internal financial quality, reflecting steadier profitability and operational efficiency metrics. Neither firm displays severe weaknesses, but CVS’s slightly higher score indicates more robust fundamentals.
How are the two companies positioned?
This section dissects CVS and CI’s operational DNA by comparing their revenue distribution and internal dynamics. The goal is to confront their economic moats to reveal which model offers the most resilient, sustainable competitive advantage today.
Revenue Segmentation: The Strategic Mix
This comparison dissects how CVS Health Corporation and Cigna Corporation diversify their income streams and where their primary sector bets lie:
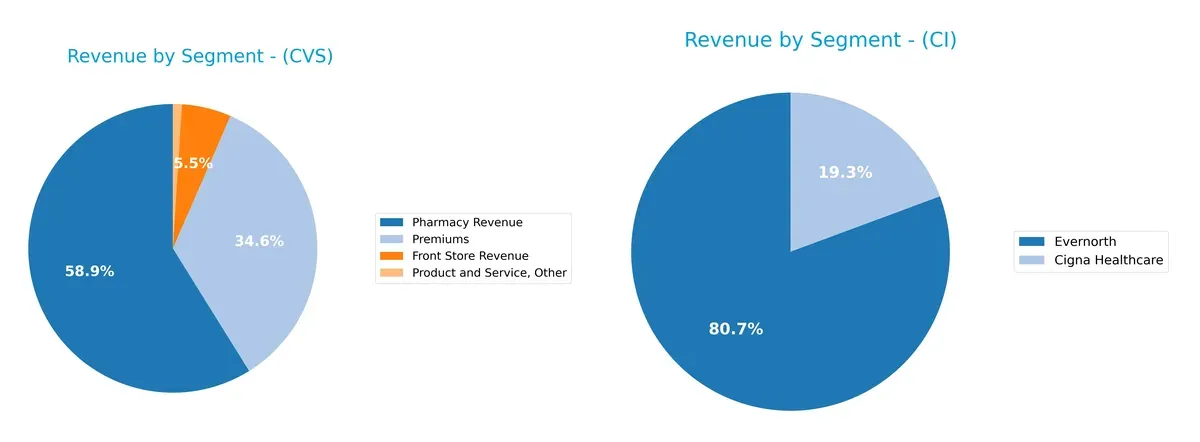
CVS anchors its revenue in Pharmacy at $229B, supplemented by $135B in Premiums and $21B from Front Store sales, showing moderate diversification. Cigna pivots heavily on Evernorth Health Services at $198B, with Cigna Healthcare contributing $47.5B. CVS’s spread reduces concentration risk but leans on retail infrastructure. Cigna’s dominance in Evernorth signals strong ecosystem lock-in but high reliance on one segment.
Strengths and Weaknesses Comparison
This table compares the Strengths and Weaknesses of CVS Health Corporation and Cigna Corporation:
CVS Strengths
- Highly diversified revenue streams including pharmacy, premiums, and front store
- Favorable asset turnover and fixed asset turnover ratios
- Solid dividend yield at 3.38%
Cigna Strengths
- Favorable PE ratio at 12.29 indicating relatively cheaper valuation
- Strong interest coverage ratio of 6.9
- Favorable debt-to-equity and debt-to-assets ratios
CVS Weaknesses
- Unfavorable profitability ratios: net margin 0.44%, ROE 2.35%, ROIC 4.92%
- Low liquidity ratios: current ratio 0.84, quick ratio 0.63
- High debt-to-equity ratio at 1.06 and weak interest coverage 1.68
Cigna Weaknesses
- Zero or unavailable ROE and ROIC indicating weak profitability
- Unfavorable liquidity ratios with current and quick ratios at 0
- Unfavorable asset turnover and fixed asset turnover ratios
CVS shows strength in diversified revenue sources and operational efficiency but struggles with profitability and liquidity. Cigna benefits from valuation and leverage metrics but reveals concerns in profitability and asset utilization. These contrasts highlight differing strategic challenges in balancing growth and financial health.
The Moat Duel: Analyzing Competitive Defensibility
A structural moat is the only true shield preserving long-term profits against relentless competition erosion:
CVS Health Corporation: Integrated Healthcare Ecosystem
CVS leverages extensive pharmacy and healthcare services, creating switching costs that stabilize margins despite modest ROIC decline in 2025. Its integrated model could deepen the moat via new care delivery innovations.
Cigna Corporation: Coordinated Care & Data Intelligence
Cigna’s moat rests on Evernorth’s coordinated services and data-driven health solutions, differentiating it from CVS’s retail-heavy focus. Its improving net margin growth signals strong operational leverage and expansion potential.
Moat Battle: Integrated Ecosystem vs. Coordinated Care Innovation
CVS’s broad service integration offers a wider moat, but declining ROIC warns of weakening economic profits. Cigna shows sharper margin improvements, yet lacks clear ROIC data for a definitive moat strength. CVS remains better positioned to defend market share, though risks merit close monitoring.
Which stock offers better returns?
Stock price movements over the past year reveal contrasting dynamics, with CVS Health Corporation showing stability and Cigna Corporation experiencing significant volatility and decline.
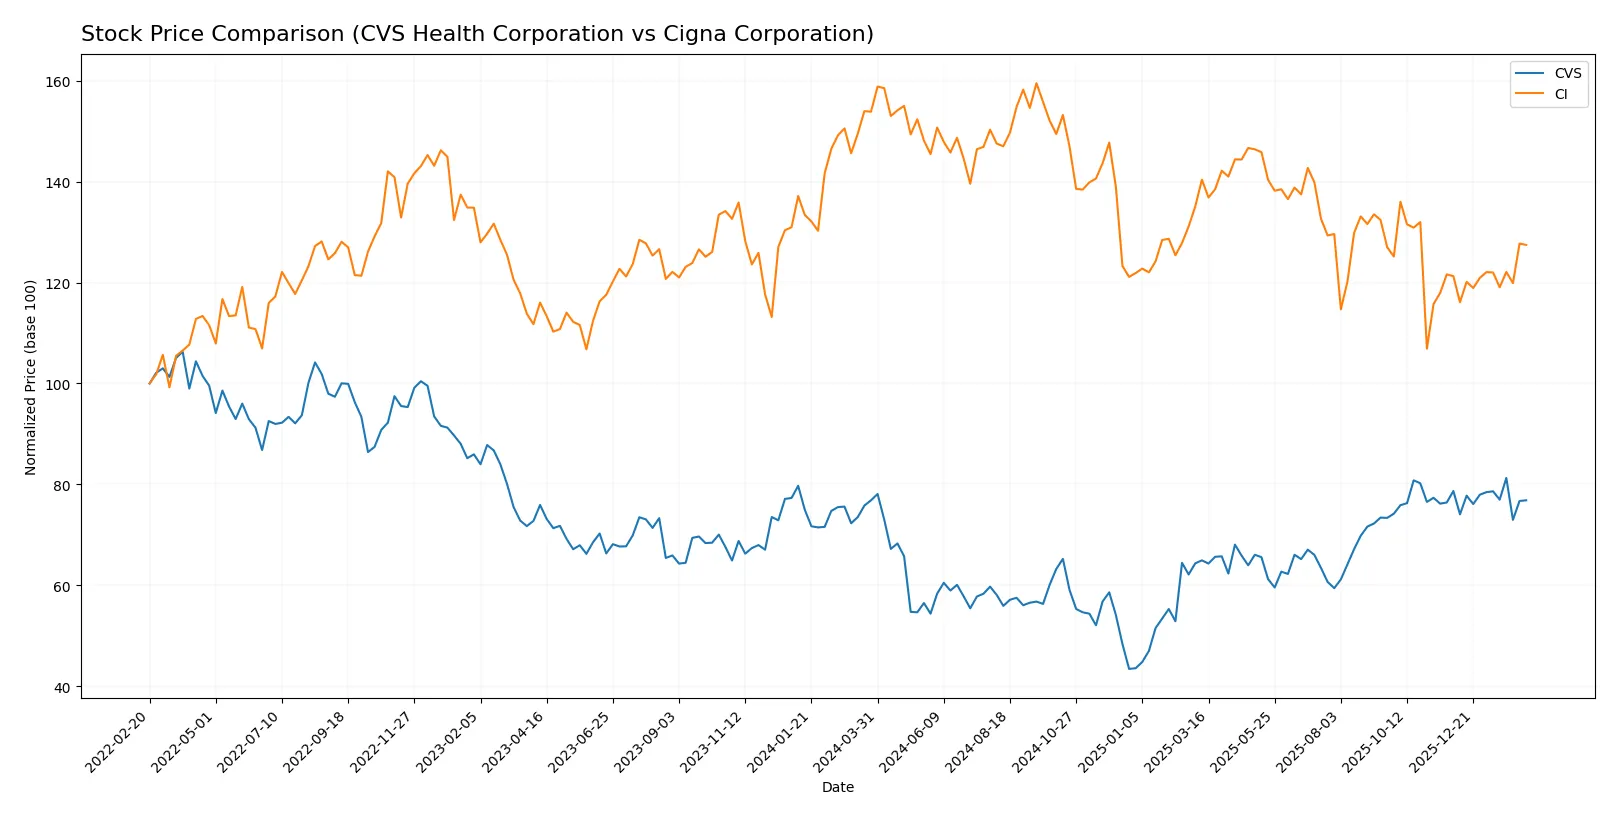
Trend Comparison
CVS Health Corporation’s stock remained flat over the past 12 months, with a 0.0% price change and a decelerating trend. The price ranged between 44.36 and 83.01.
Cigna Corporation’s stock showed a bearish trend with a -17.15% price decline over the same period, though recent months indicate accelerating recovery and a 5.11% gain.
Comparing both, CVS delivered stable market performance while Cigna experienced notable losses but signs of recent upward momentum.
Target Prices
Analysts present a solid target consensus for CVS Health Corporation and Cigna Corporation, indicating moderate upside potential.
| Company | Target Low | Target High | Consensus |
|---|---|---|---|
| CVS Health Corporation | 90 | 103 | 94.92 |
| Cigna Corporation | 300 | 375 | 324.83 |
CVS trades well below its consensus target, suggesting room for price appreciation. Cigna’s target consensus also exceeds its current price, reflecting positive analyst expectations.

Don’t Let Luck Decide Your Entry Point
Optimize your entry points with our advanced ProRealTime indicators. You’ll get efficient buy signals with precise price targets for maximum performance. Start outperforming now!
How do institutions grade them?
The following tables summarize the recent grades assigned by major financial institutions for each company:
CVS Health Corporation Grades
This table lists recent grades from reputable analysts for CVS Health Corporation.
| Grading Company | Action | New Grade | Date |
|---|---|---|---|
| Argus Research | Maintain | Buy | 2026-01-28 |
| B of A Securities | Maintain | Buy | 2026-01-27 |
| JP Morgan | Maintain | Overweight | 2025-12-17 |
| Bernstein | Maintain | Market Perform | 2025-12-12 |
| Baird | Maintain | Outperform | 2025-12-10 |
| Mizuho | Maintain | Outperform | 2025-12-10 |
| Truist Securities | Maintain | Buy | 2025-12-10 |
| UBS | Maintain | Buy | 2025-12-10 |
| Barclays | Maintain | Overweight | 2025-12-10 |
| Piper Sandler | Maintain | Overweight | 2025-12-10 |
Cigna Corporation Grades
This table shows recent grades from credible analysts for Cigna Corporation.
| Grading Company | Action | New Grade | Date |
|---|---|---|---|
| TD Cowen | Maintain | Buy | 2026-02-09 |
| Guggenheim | Maintain | Buy | 2026-02-06 |
| RBC Capital | Maintain | Outperform | 2026-02-06 |
| Barclays | Maintain | Overweight | 2026-02-06 |
| Guggenheim | Maintain | Buy | 2026-02-02 |
| Truist Securities | Maintain | Buy | 2026-01-05 |
| Barclays | Maintain | Overweight | 2026-01-05 |
| Bernstein | Maintain | Market Perform | 2025-11-12 |
| Wells Fargo | Maintain | Equal Weight | 2025-11-05 |
| TD Cowen | Maintain | Buy | 2025-11-04 |
Which company has the best grades?
Both CVS Health Corporation and Cigna Corporation receive predominantly positive grades, including multiple “Buy” and “Outperform” ratings. CVS shows more consistent “Buy” and “Outperform” recommendations, while Cigna’s ratings include a few “Equal Weight” and “Market Perform” grades. Investors may see CVS’s grades as slightly more robust, potentially reflecting greater analyst confidence.
Risks specific to each company
The following categories identify the critical pressure points and systemic threats facing both firms in the 2026 market environment:
1. Market & Competition
CVS Health Corporation
- Faces intense competition in retail pharmacy and healthcare benefits, pressured by margin erosion and pricing challenges.
Cigna Corporation
- Operates in a competitive insurance market with pressure on margins and customer retention amid evolving health plan models.
2. Capital Structure & Debt
CVS Health Corporation
- High debt-to-equity of 1.06 signals leveraged balance sheet and tight interest coverage at 1.68x, raising refinancing risks.
Cigna Corporation
- Low leverage with negligible debt, strong interest coverage of 6.9x, indicating conservative capital structure and financial flexibility.
3. Stock Volatility
CVS Health Corporation
- Beta of 0.50 suggests moderate volatility, less reactive to market swings, offering some downside protection.
Cigna Corporation
- Beta of 0.28 indicates lower volatility and defensive stock behavior in turbulent markets.
4. Regulatory & Legal
CVS Health Corporation
- Subject to stringent healthcare regulations and risk of reimbursement rate cuts impacting revenues.
Cigna Corporation
- Faces regulatory scrutiny in insurance underwriting and Medicare plan compliance, with potential for policy shifts affecting margins.
5. Supply Chain & Operations
CVS Health Corporation
- Complex retail and pharmacy operations vulnerable to supply chain disruptions and rising operational costs.
Cigna Corporation
- Operations focused on insurance services reduce direct supply chain risks but reliant on third-party providers’ stability.
6. ESG & Climate Transition
CVS Health Corporation
- Increasing pressure to decarbonize retail footprint and manage pharmaceutical waste responsibly.
Cigna Corporation
- Faces ESG scrutiny on data security and sustainable health plan offerings, with growing investor expectations.
7. Geopolitical Exposure
CVS Health Corporation
- Primarily US-focused, limiting direct geopolitical risk but exposed to domestic healthcare policy changes.
Cigna Corporation
- Limited international exposure reduces geopolitical volatility but dependent on US regulatory environment stability.
Which company shows a better risk-adjusted profile?
CVS’s highest risk stems from its leveraged balance sheet and tight interest coverage, raising distress concerns despite operational scale. Cigna’s principal vulnerability lies in weak profitability metrics and regulatory pressures, though its conservative leverage and lower volatility improve its risk profile. I observe that CVS’s debt levels and interest coverage ratio present a more immediate financial threat than Cigna’s operational challenges. Overall, Cigna offers a better risk-adjusted profile due to stronger financial stability and lower capital risk in 2026.
Final Verdict: Which stock to choose?
CVS Health’s superpower lies in its vast integrated healthcare ecosystem, driving unmatched operational scale and cash flow generation. Its point of vigilance is the stretched balance sheet and declining profitability metrics, which could pressure financial flexibility. CVS suits investors targeting aggressive growth with tolerance for balance sheet risks.
Cigna’s strategic moat centers on its strong risk management and recurring revenue from health insurance, providing a solid safety net versus CVS. It offers better interest coverage and a cleaner debt profile, appealing to those who prioritize stability. Cigna fits well in Growth at a Reasonable Price (GARP) portfolios focused on resilient cash flow.
If you prioritize scale-driven cash generation and market reach, CVS is compelling despite its financial strain. However, if you seek financial stability and a cleaner capital structure, Cigna offers better downside protection and steady growth. Both present distinct scenarios aligned with different investor risk appetites and growth expectations.
Disclaimer: Investment carries a risk of loss of initial capital. The past performance is not a reliable indicator of future results. Be sure to understand risks before making an investment decision.
Go Further
I encourage you to read the complete analyses of CVS Health Corporation and Cigna Corporation to enhance your investment decisions: