Home > Comparison > Industrials > CMI vs XYL
The strategic rivalry between Cummins Inc. and Xylem Inc. shapes the future of the industrial machinery sector. Cummins operates as a capital-intensive powerhouse specializing in engines and power systems. In contrast, Xylem focuses on engineered water solutions with higher service integration. This analysis pits heavy industrial manufacturing against specialized technology-driven water infrastructure, aiming to identify which trajectory offers superior risk-adjusted returns for a diversified portfolio.
Table of contents
Companies Overview
Cummins Inc. and Xylem Inc. hold pivotal roles in the industrial machinery sector, shaping global infrastructure and power solutions.
Cummins Inc.: Powertrain and Engine Innovator
Cummins Inc. dominates the diesel and natural gas engine market, generating revenue through manufacturing and servicing engines and powertrains worldwide. Its diverse product range spans heavy and medium-duty trucks, construction, mining, marine, and agricultural markets. In 2026, Cummins sharpened its strategic focus on electrified power systems and emission solutions, aiming to lead in next-generation energy technologies.
Xylem Inc.: Water Technology Leader
Xylem Inc. specializes in engineered products for water and wastewater management, driving revenue through pumps, filtration, and smart measurement systems. The company operates across Water Infrastructure, Applied Water, and Measurement & Control Solutions segments. In 2026, Xylem prioritized digital water technologies and sustainable water solutions, enhancing efficiency and smart monitoring capabilities globally.
Strategic Collision: Similarities & Divergences
Both companies leverage industrial machinery expertise but diverge in core markets—Cummins focuses on power generation while Xylem concentrates on water infrastructure. Their battle for market share centers on innovation in sustainability: engines vs. water technology. Cummins offers a broad energy portfolio with a heavy manufacturing moat; Xylem presents a niche in smart water systems, appealing to environmentally conscious investors.
Income Statement Comparison
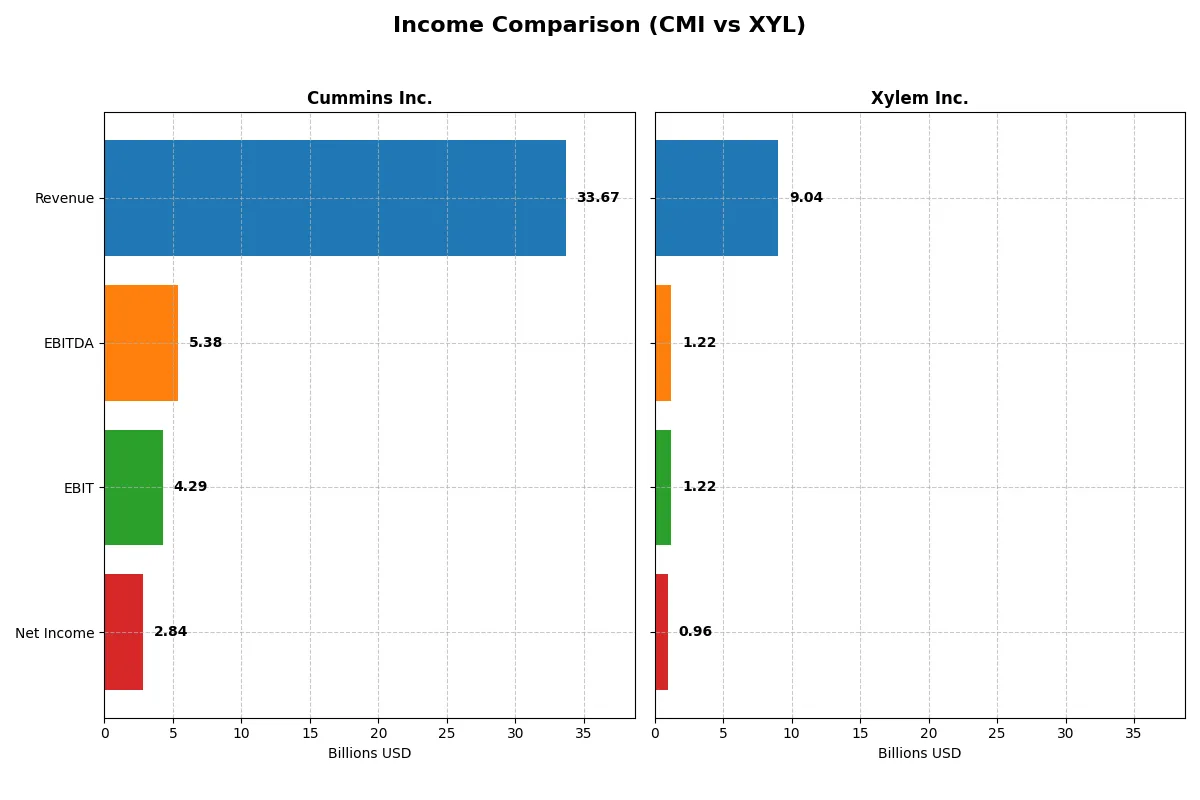
The following data dissects the core profitability and scalability of both corporate engines to reveal who dominates the bottom line:
| Metric | Cummins Inc. (CMI) | Xylem Inc. (XYL) |
|---|---|---|
| Revenue | 33.7B | 9.04B |
| Cost of Revenue | 25.15B | 5.56B |
| Operating Expenses | 4.52B | 2.25B |
| Gross Profit | 8.52B | 3.48B |
| EBITDA | 5.39B | 1.22B |
| EBIT | 4.29B | 1.22B |
| Interest Expense | 329M | 29M |
| Net Income | 2.84B | 957M |
| EPS | 20.62 | 3.93 |
| Fiscal Year | 2025 | 2025 |
Income Statement Analysis: The Bottom-Line Duel
This income statement comparison reveals which company converts sales into profits more efficiently, highlighting operational and financial momentum.
Cummins Inc. Analysis
Cummins shows strong revenue growth over five years, reaching $33.7B in 2025 but with a slight 1.3% revenue dip from 2024. Gross margin holds steady at 25.3%, while net margin contracts to 8.4%, reflecting margin pressure. Net income fell 28% year-over-year to $2.84B, signaling recent efficiency challenges despite solid long-term gains.
Xylem Inc. Analysis
Xylem delivers robust top-line growth, hitting $9.04B in 2025 with a 5.5% rise from 2024. Its gross margin outperforms at 38.5%, and net margin expands to 10.6%, demonstrating improving profitability. Net income rose 7.4% year-over-year to $957M, underscoring sustained momentum and superior operational leverage in recent periods.
Margin Resilience vs. Growth Trajectory
Cummins commands scale with higher absolute net income but faces margin and income setbacks in 2025. Xylem posts leaner revenues but excels in margin expansion and net income growth. For investors, Xylem’s profile suggests more attractive profitability momentum, while Cummins offers scale tempered by near-term margin headwinds.
Financial Ratios Comparison
These vital ratios act as a diagnostic tool to expose the underlying fiscal health, valuation premiums, and capital efficiency of each company analyzed:
| Ratios | Cummins Inc. (CMI) | Xylem Inc. (XYL) |
|---|---|---|
| ROE | 23.0% | 8.3% |
| ROIC | 12.0% | 6.4% |
| P/E | 24.8 | 34.6 |
| P/B | 5.7 | 2.9 |
| Current Ratio | 1.76 | 1.63 |
| Quick Ratio | 1.16 | 1.28 |
| D/E | 0.59 | 0.17 |
| Debt-to-Assets | 21.3% | 11.0% |
| Interest Coverage | 12.1 | 42.2 |
| Asset Turnover | 0.99 | 0.51 |
| Fixed Asset Turnover | 4.84 | 7.80 |
| Payout Ratio | 37.1% | 40.9% |
| Dividend Yield | 1.50% | 1.18% |
| Fiscal Year | 2025 | 2025 |
Efficiency & Valuation Duel: The Vital Signs
Financial ratios serve as a company’s DNA, unveiling hidden risks and operational strengths essential for investment insight.
Cummins Inc.
Cummins shows a robust 23% ROE, signaling strong profitability, while its net margin at 8.44% is stable but not outstanding. The P/E of 24.76 suggests a fairly valued stock, though its high PB ratio of 5.7 raises valuation concerns. Cummins supports shareholders with a 1.5% dividend yield, balancing returns with reinvestment in growth.
Xylem Inc.
Xylem’s net margin of 10.59% outperforms Cummins, indicating efficient cost control, yet its ROE at 8.34% lags behind, showing weaker equity returns. The stock trades at a stretched P/E of 34.64, reflecting premium valuation risks. Xylem offers a modest 1.18% yield and focuses on reinvestment, backing future growth and innovation.
Valuation Discipline vs. Margin Efficiency
Cummins provides stronger equity returns and a balanced valuation, while Xylem excels in margin efficiency but carries a higher valuation premium. Investors prioritizing consistent profitability and moderate risk may favor Cummins. Those seeking growth through margin strength at a premium might lean toward Xylem.
Which one offers the Superior Shareholder Reward?
Cummins Inc. (CMI) delivers a more attractive total shareholder return than Xylem Inc. (XYL) in 2026. CMI offers a higher dividend yield near 1.5% with a sustainable payout ratio around 37%, backed by strong free cash flow coverage above 65%. Its buyback program supports shareholder value amid stable capital allocation. Conversely, XYL yields only about 1.2%, with a payout ratio near 40%, but lower free cash flow per share limits distribution sustainability. XYL prefers moderate buybacks but invests heavily in growth, which may delay returns. Historically, I’ve observed that CMI’s balanced dividend and buyback strategy better rewards investors over market cycles. Therefore, I favor Cummins for superior shareholder reward in 2026.
Comparative Score Analysis: The Strategic Profile
The radar chart reveals the fundamental DNA and trade-offs of Cummins Inc. and Xylem Inc., highlighting their financial strengths and valuation nuances:
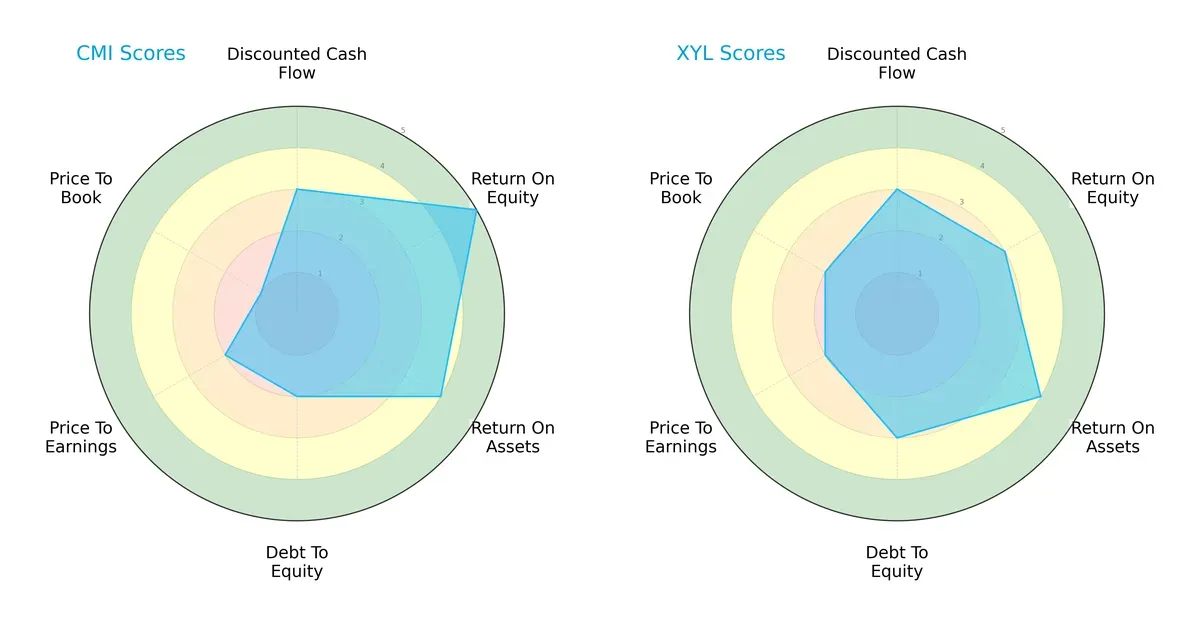
Cummins excels in return on equity (5 vs. 3) and return on assets (4 vs. 4), demonstrating operational efficiency. However, it carries higher financial risk with a weaker debt-to-equity score (2 vs. 3) and suffers from poor valuation metrics, especially price-to-book (1 vs. 2). Xylem presents a more balanced profile with moderate leverage and slightly better valuation scores, relying less on a single competitive edge.
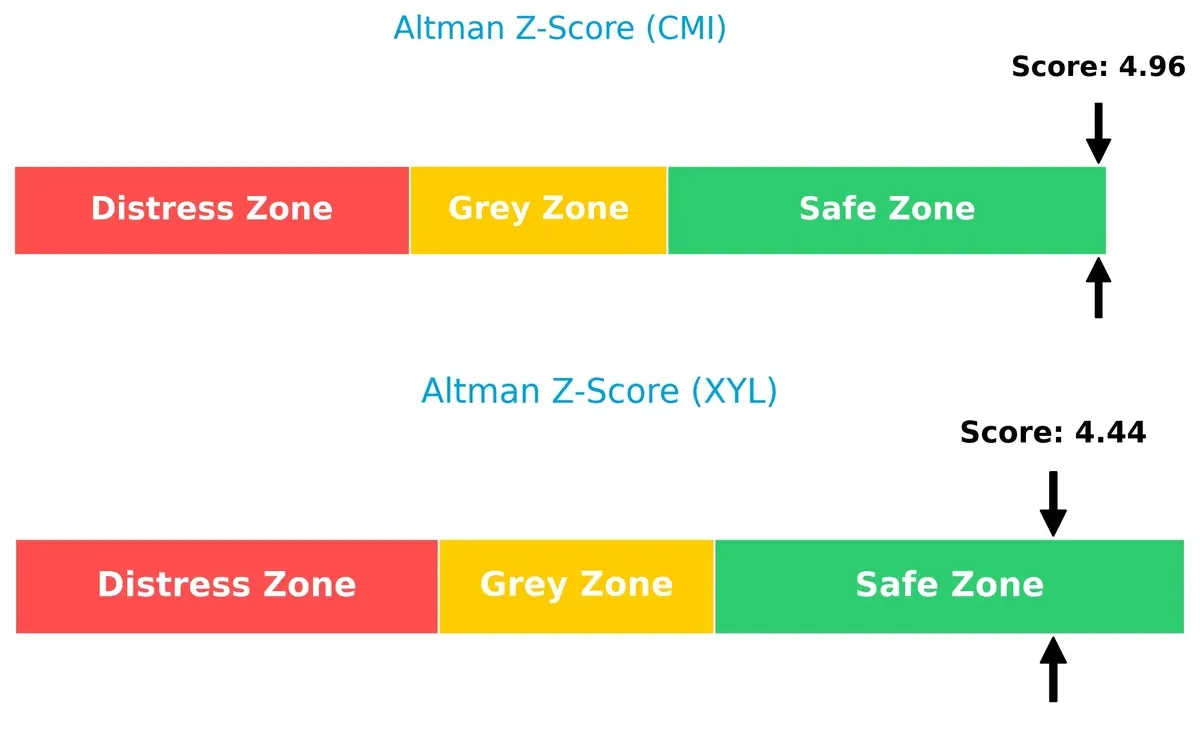
Bankruptcy Risk: Solvency Showdown
Cummins holds a marginally higher Altman Z-Score (4.96 vs. 4.44), signaling a stronger buffer against bankruptcy risk in this economic cycle:
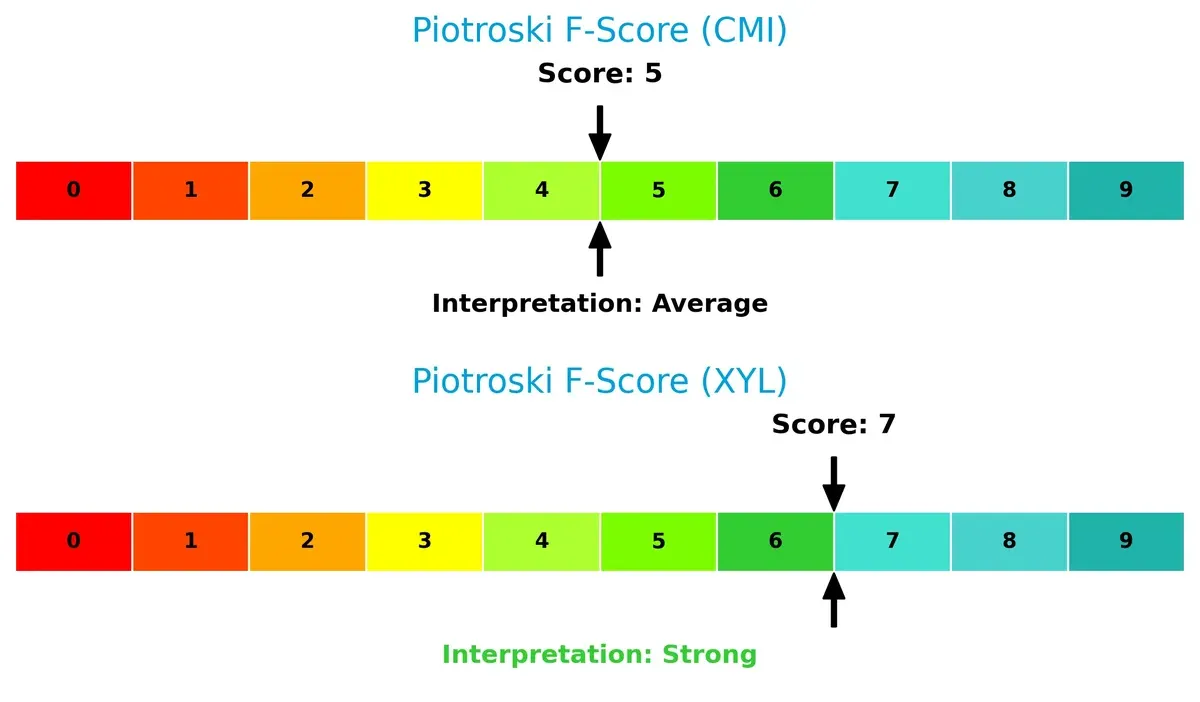
Financial Health: Quality of Operations
Xylem outperforms with a Piotroski F-Score of 7 versus Cummins’ 5, indicating superior internal financial quality and fewer red flags on profitability and liquidity measures:
How are the two companies positioned?
This section dissects the operational DNA of Cummins and Xylem by comparing their revenue distribution and internal dynamics. The goal is to confront their economic moats to reveal which model offers a more resilient, sustainable competitive advantage today.
Revenue Segmentation: The Strategic Mix
This visual comparison dissects how Cummins Inc. and Xylem Inc. diversify income streams and where their primary sector bets lie:
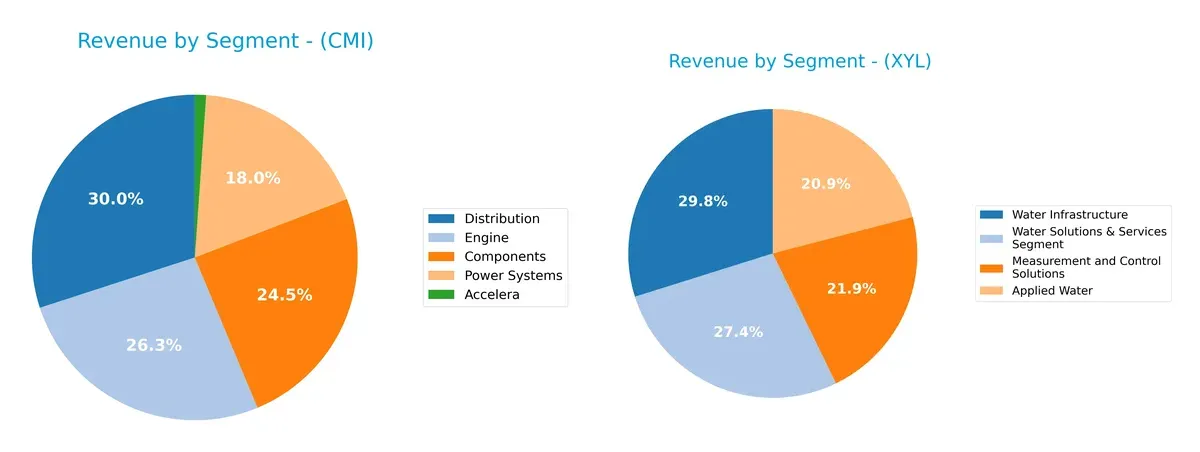
Cummins anchors revenue in Components ($10.1B), Distribution ($12.4B), and Engine ($10.9B), showing broad exposure across heavy equipment segments. Xylem pivots around Water Infrastructure ($2.56B) and Measurement & Control Solutions ($1.87B), but Applied Water ($1.79B) adds meaningful diversity. Cummins’ multi-segment approach reduces concentration risk, while Xylem’s focus on water infrastructure highlights ecosystem dominance but higher dependency on fewer markets.
Strengths and Weaknesses Comparison
This table compares the strengths and weaknesses of Cummins Inc. and Xylem Inc. based on key financial and market criteria:
Cummins Inc. Strengths
- Strong ROE of 23.02%
- Favorable ROIC at 12.01% above WACC
- Solid current and quick ratios above 1.0
- Diverse revenue across components, distribution, and engines
- Significant US and Non-US market presence with $19B US sales
- Favorable fixed asset turnover at 4.84
Xylem Inc. Strengths
- Higher net margin at 10.59%
- Very strong interest coverage at 42.17
- Low debt-to-equity ratio at 0.17
- Favorable quick ratio at 1.28
- Diversified water-focused segments and geographic presence
- High fixed asset turnover of 7.8
Cummins Inc. Weaknesses
- Unfavorable price-to-book ratio at 5.7 signals possible overvaluation
- Neutral net margin at 8.44% lower than sector leaders
- Moderate debt-to-equity ratio at 0.59
- Neutral asset turnover at 0.99
- Heavy reliance on US market with $19B sales
- Dividend yield only neutral at 1.5%
Xylem Inc. Weaknesses
- Lower ROE at 8.34%, below market averages
- Unfavorable high PE ratio of 34.64
- Moderate ROIC at 6.42%, near WACC
- Neutral asset turnover at 0.51
- Geographic concentration in US with $4.9B sales
- Dividend yield neutral at 1.18%
Cummins shows financial strength through superior returns and a balanced geographic footprint but faces valuation concerns. Xylem benefits from higher profitability and strong coverage ratios yet has lower returns and valuation challenges. Both companies maintain slightly favorable overall financial profiles, influencing their strategic focus on financial efficiency and market diversification.
The Moat Duel: Analyzing Competitive Defensibility
A structural moat alone shields long-term profits from relentless competition and margin pressure. Let’s dissect how Cummins and Xylem defend their turf:
Cummins Inc.: Durable Engineering Moat via Cost Advantage
Cummins leverages proprietary powertrain tech and a broad aftermarket network, yielding a favorable 3.6% ROIC premium over WACC. Despite slight ROIC decline, new electrification and hydrogen initiatives could reinforce its moat in 2026.
Xylem Inc.: Innovation-Heavy Moat Challenged by Profitability Pressures
Xylem’s moat stems from specialized water tech and integrated smart solutions. However, it sheds value with ROIC below WACC (-2.3%) and steep margin contraction. Growth in analytics and services offers upside but profitability erosion limits moat strength.
Cost Leadership vs. Innovation Resilience: The Moat Verdict
Cummins’ cost advantage delivers a wider, more stable moat than Xylem’s innovation-driven but financially strained position. Cummins stands better poised to defend market share amid evolving industrial demands.
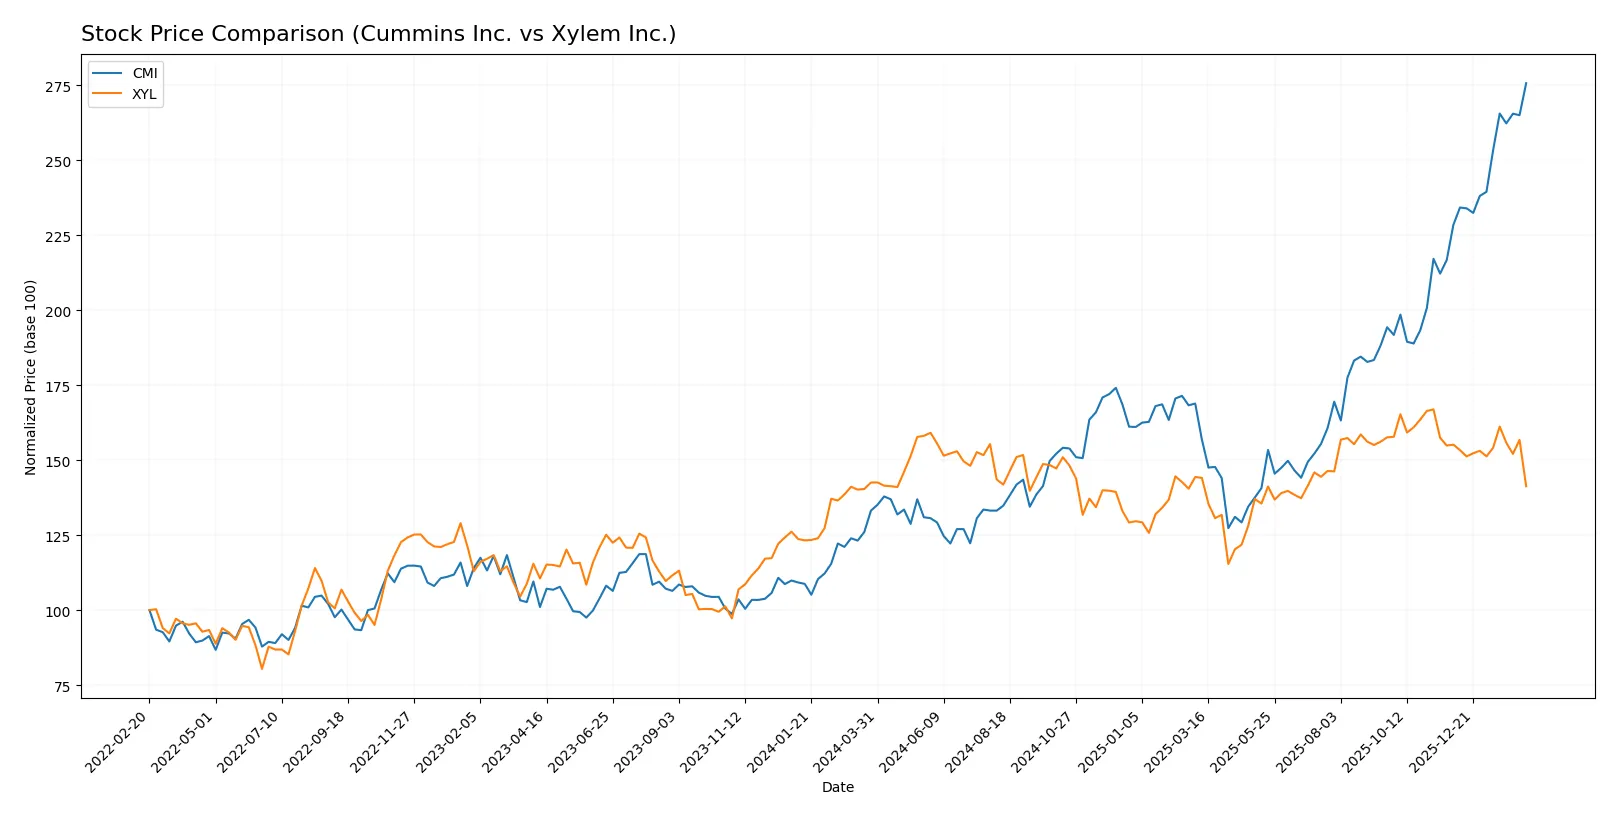
Which stock offers better returns?
The past year reveals starkly different price dynamics: Cummins Inc. doubled its stock price with accelerating momentum, while Xylem Inc. saw a slight decline amid decelerating trend forces.
Trend Comparison
Cummins Inc. gained 107.0% over the past 12 months, a clear bullish trend with accelerating price growth and high volatility reflecting strong market interest. Its price ranged from 266.48 to 601.01.
Xylem Inc. declined 0.87% over the same period, signaling a bearish trend with decelerating price movement and lower volatility. The stock price fluctuated between 104.6 and 151.31.
Cummins’ strong positive return outperformed Xylem’s marginal loss, delivering the highest market performance in this 12-month span.
Target Prices
Analysts present a confident target consensus for Cummins Inc. and Xylem Inc.
| Company | Target Low | Target High | Consensus |
|---|---|---|---|
| Cummins Inc. | 540 | 703 | 618.4 |
| Xylem Inc. | 138 | 176 | 162.67 |
Cummins’ target consensus exceeds its current price of 601.01, signaling moderate upside potential. Xylem’s consensus sits well above its 128.09 market price, reflecting bullish analyst sentiment.

Don’t Let Luck Decide Your Entry Point
Optimize your entry points with our advanced ProRealTime indicators. You’ll get efficient buy signals with precise price targets for maximum performance. Start outperforming now!
How do institutions grade them?
Below is a detailed comparison of institutional grades for Cummins Inc. and Xylem Inc.:
Cummins Inc. Grades
The table below summarizes recent institutional grades for Cummins Inc.
| Grading Company | Action | New Grade | Date |
|---|---|---|---|
| Raymond James | Maintain | Outperform | 2026-02-09 |
| Truist Securities | Maintain | Buy | 2026-02-06 |
| Wolfe Research | Downgrade | Peer Perform | 2026-01-26 |
| Barclays | Maintain | Overweight | 2026-01-23 |
| Wells Fargo | Maintain | Overweight | 2026-01-23 |
| JP Morgan | Maintain | Neutral | 2026-01-14 |
| Citigroup | Maintain | Buy | 2026-01-13 |
| Raymond James | Upgrade | Outperform | 2025-12-22 |
| Barclays | Upgrade | Overweight | 2025-12-19 |
| Truist Securities | Maintain | Buy | 2025-12-18 |
Xylem Inc. Grades
The table below summarizes recent institutional grades for Xylem Inc.
| Grading Company | Action | New Grade | Date |
|---|---|---|---|
| Citigroup | Maintain | Buy | 2026-02-11 |
| Stifel | Maintain | Buy | 2026-02-11 |
| RBC Capital | Maintain | Outperform | 2026-02-11 |
| Barclays | Maintain | Overweight | 2026-02-11 |
| Barclays | Maintain | Overweight | 2026-01-07 |
| Mizuho | Maintain | Neutral | 2026-01-05 |
| TD Cowen | Maintain | Hold | 2025-12-05 |
| UBS | Maintain | Buy | 2025-11-06 |
| Stifel | Maintain | Buy | 2025-10-29 |
| RBC Capital | Maintain | Outperform | 2025-10-29 |
Which company has the best grades?
Cummins Inc. and Xylem Inc. both earn mostly positive grades, with frequent “Buy,” “Outperform,” and “Overweight” ratings. Cummins shows a recent downgrade from Wolfe Research but also several upgrades. Xylem maintains consistent “Buy” and “Outperform” ratings without downgrades. Investors may interpret Xylem’s steadier grade profile as a sign of more uniform institutional confidence.
Risks specific to each company
The following categories identify the critical pressure points and systemic threats facing both firms in the 2026 market environment:
1. Market & Competition
Cummins Inc. (CMI)
- Faces intense competition in diesel and electrified powertrains, challenged by industry shift to clean energy.
Xylem Inc. (XYL)
- Operates in water solutions with growing competition but benefits from niche smart water tech leadership.
2. Capital Structure & Debt
Cummins Inc. (CMI)
- Moderate leverage with debt-to-assets at 21.3%, interest coverage strong at 13x, but debt-to-equity score unfavorable.
Xylem Inc. (XYL)
- Low leverage at 11% debt-to-assets, very strong interest coverage over 42x, indicating a robust balance sheet.
3. Stock Volatility
Cummins Inc. (CMI)
- Beta of 1.12 suggests moderate market sensitivity, with share price near all-time highs increasing volatility risk.
Xylem Inc. (XYL)
- Slightly higher beta at 1.16, but more stable trading volume and narrower price range limit volatility exposure.
4. Regulatory & Legal
Cummins Inc. (CMI)
- Exposure to evolving emissions standards pressures engine product lines; compliance costs could rise.
Xylem Inc. (XYL)
- Water treatment regulations require ongoing innovation but offer growth potential; legal risks relatively contained.
5. Supply Chain & Operations
Cummins Inc. (CMI)
- Complex global supply chain for engines and components vulnerable to raw material cost inflation and delays.
Xylem Inc. (XYL)
- Supply chain focused on water tech components, benefitting from more localized suppliers but sensitive to semiconductor shortages.
6. ESG & Climate Transition
Cummins Inc. (CMI)
- Transitioning to electrified powertrain tech aligns with decarbonization but requires heavy R&D investment.
Xylem Inc. (XYL)
- Positioned well with water sustainability solutions, benefiting from rising ESG regulations and climate adaptation demand.
7. Geopolitical Exposure
Cummins Inc. (CMI)
- Global footprint exposes CMI to trade tensions and tariffs, especially in Asia and Europe.
Xylem Inc. (XYL)
- Less exposed to geopolitical risks due to diversified global presence and focus on critical infrastructure markets.
Which company shows a better risk-adjusted profile?
Xylem’s low leverage, strong interest coverage, and ESG alignment reduce financial and systemic risks. Cummins carries higher debt and faces heavier regulatory and supply chain pressures. However, Cummins’ superior ROE and solid Altman Z-score show resilience despite these risks. Recent data signal Xylem’s stronger operational safety margin, making it the better risk-adjusted choice.
Final Verdict: Which stock to choose?
Cummins Inc. (CMI) impresses with its unmatched capital efficiency and consistent value creation, reflected in a ROIC comfortably above its WACC. Its main point of vigilance lies in a recent dip in profitability and elevated valuation multiples, suggesting caution. CMI fits well within an Aggressive Growth portfolio seeking operational strength amid cyclical challenges.
Xylem Inc. (XYL) offers a strategic moat rooted in its recurring revenue streams and solid cash flow quality. It presents a safer balance sheet profile than Cummins, with lower leverage and stronger interest coverage, albeit at a premium valuation and weaker returns on invested capital. XYL aligns with a GARP (Growth at a Reasonable Price) portfolio focusing on stability and measured growth.
If you prioritize robust value creation and operational leverage, Cummins outshines as the compelling choice due to its superior ROIC and bullish price momentum. However, if you seek better stability and resilient cash flows with moderate growth, Xylem offers a safer profile despite its value destruction trend. Each scenario demands careful risk tolerance calibration.
Disclaimer: Investment carries a risk of loss of initial capital. The past performance is not a reliable indicator of future results. Be sure to understand risks before making an investment decision.
Go Further
I encourage you to read the complete analyses of Cummins Inc. and Xylem Inc. to enhance your investment decisions: