Home > Comparison > Industrials > CMI vs SYM
The strategic rivalry between Cummins Inc. and Symbotic Inc. shapes the future of industrial machinery. Cummins, a capital-intensive manufacturer of engines and power systems, contrasts with Symbotic’s innovative warehouse automation technology. This head-to-head pits traditional industrial manufacturing against cutting-edge robotics-driven efficiency. This analysis aims to identify which company’s trajectory offers a superior risk-adjusted return, guiding investors seeking durable growth within the Industrials sector.
Table of contents
Companies Overview
Cummins Inc. and Symbotic Inc. stand as pivotal players reshaping the industrial machinery landscape in the US.
Cummins Inc.: Global Powertrain Innovator
Cummins Inc. dominates as a manufacturer of diesel and natural gas engines and power systems worldwide. Its revenue flows from engines, components, and electrified powertrain products. In 2026, Cummins sharpens its focus on integrating emission solutions and electrification technologies to meet evolving regulatory standards and market demand.
Symbotic Inc.: Warehouse Automation Leader
Symbotic Inc. leads in robotics and automation technology for retail and wholesale warehousing in the US. It generates revenue through its proprietary Symbotic System, which drives operational efficiency and inventory management. The company prioritizes expanding its footprint by enhancing its full-service automation solutions to reduce costs and improve client productivity.
Strategic Collision: Similarities & Divergences
Cummins and Symbotic both emphasize industrial innovation but diverge sharply in approach—Cummins invests in powertrain electrification and emissions compliance, while Symbotic bets on automation software and robotics hardware. Their battleground lies in optimizing operational efficiency, one through mechanical power solutions, the other via smart logistics automation. This contrast defines distinct investment profiles: Cummins as a tech-adapting industrial giant; Symbotic as a nimble automation disruptor.
Income Statement Comparison
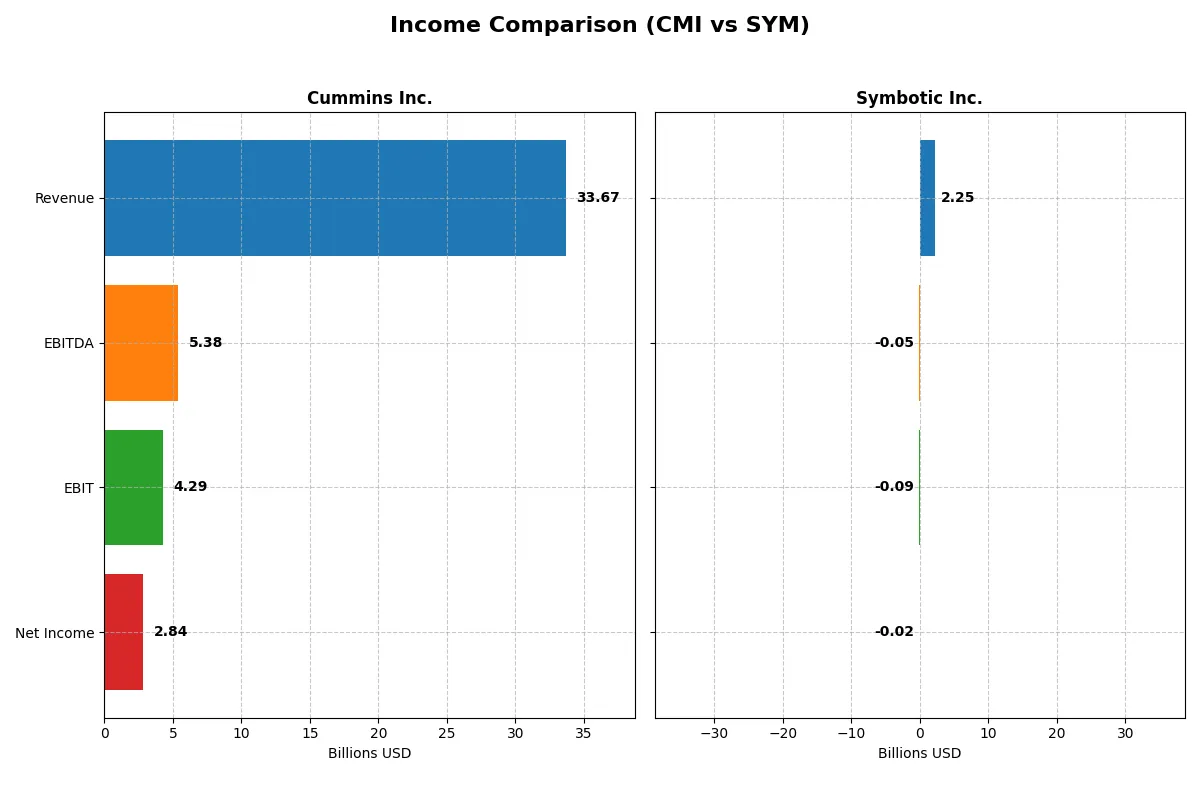
This data dissects the core profitability and scalability of both corporate engines to reveal who dominates the bottom line:
| Metric | Cummins Inc. (CMI) | Symbotic Inc. (SYM) |
|---|---|---|
| Revenue | 33.7B | 2.25B |
| Cost of Revenue | 25.2B | 1.82B |
| Operating Expenses | 4.52B | 538M |
| Gross Profit | 8.52B | 423M |
| EBITDA | 5.39B | -48M |
| EBIT | 4.29B | -92M |
| Interest Expense | 329M | 0 |
| Net Income | 2.84B | -17M |
| EPS | 20.62 | -0.16 |
| Fiscal Year | 2025 | 2025 |
Income Statement Analysis: The Bottom-Line Duel
This income statement comparison reveals which company runs a more efficient and profitable corporate engine in 2025.
Cummins Inc. Analysis
Cummins posts a strong revenue base of $33.7B in 2025, slightly down from $34.1B in 2024. Net income declines to $2.84B, reflecting margin pressure despite solid gross margin of 25.3%. Operating efficiency slips as EBIT falls 18.6% year-over-year, signaling headwinds after years of robust growth.
Symbotic Inc. Analysis
Symbotic’s revenue surged 25.7% to $2.25B in 2025, with gross margin improving to 18.8%. However, the company remains unprofitable, reporting a net loss of $17M. EBIT margin stays negative at -4.1%, highlighting ongoing operational inefficiencies despite rapid top-line momentum.
Margin Power vs. Revenue Scale
Cummins dominates with scale and consistent profitability, boasting positive margins and $2.8B net income in 2025. Symbotic delivers faster revenue growth but struggles to convert sales into profits. For investors prioritizing stable cash flows, Cummins’ profile offers a more reliable foundation than Symbotic’s high-growth yet loss-making model.
Financial Ratios Comparison
These vital ratios act as a diagnostic tool to expose the underlying fiscal health, valuation premiums, and capital efficiency of the companies analyzed:
| Ratios | Cummins Inc. (CMI) | Symbotic Inc. (SYM) |
|---|---|---|
| ROE | 23.0% | -7.7% |
| ROIC | 12.0% | -16.6% |
| P/E | 24.8 | -334.5 |
| P/B | 5.7 | 25.6 |
| Current Ratio | 1.76 | 1.08 |
| Quick Ratio | 1.16 | 0.99 |
| D/E (Debt-to-Equity) | 0.59 | 0.25 |
| Debt-to-Assets | 21.3% | 2.3% |
| Interest Coverage | 12.1 | 0 |
| Asset Turnover | 0.99 | 0.94 |
| Fixed Asset Turnover | 4.84 | 15.92 |
| Payout Ratio | 37.1% | -6.9% |
| Dividend Yield | 1.50% | 0.02% |
| Fiscal Year | 2025 | 2025 |
Efficiency & Valuation Duel: The Vital Signs
Financial ratios act as the company’s DNA, revealing hidden risks and operational excellence critical for investment decisions.
Cummins Inc.
Cummins displays robust profitability with a 23.02% ROE and a favorable 12.01% ROIC, reflecting strong capital efficiency. Its P/E ratio at 24.76 is neutral, while a high P/B at 5.7 signals valuation stretch. The company offers a 1.5% dividend yield, balancing shareholder returns with growth investments.
Symbotic Inc.
Symbotic struggles with negative profitability metrics: ROE at -7.65% and ROIC at -16.63%, signaling operational challenges. Despite a highly unfavorable P/B of 25.6, it posts a negative P/E skewed by losses. Minimal dividend yield near zero indicates reinvestment focus in R&D, aiming for future growth.
Valuation Discipline vs. Growth Risk
Cummins offers a balanced profile with solid returns and moderate valuation, while Symbotic bears high risk and stretched multiples. Investors seeking operational safety lean toward Cummins. Those with a tolerance for growth uncertainty may consider Symbotic’s aggressive reinvestment approach.
Which one offers the Superior Shareholder Reward?
I compare Cummins Inc. (CMI) and Symbotic Inc. (SYM) on shareholder rewards by examining dividends, payout ratios, and buyback intensity. CMI offers a 1.5% yield with a moderate 37% payout ratio, well-covered by free cash flow (66%). Its steady buybacks support total returns sustainably. SYM pays negligible dividends (0.02% yield) and runs minimal buybacks, focusing on reinvestment in growth and R&D. This strategy suits its early-stage profile but lacks immediate shareholder payouts. Given CMI’s reliable dividend and buyback program, I conclude CMI delivers the more attractive total return profile for investors in 2026.
Comparative Score Analysis: The Strategic Profile
The radar chart reveals the fundamental DNA and trade-offs of Cummins Inc. and Symbotic Inc., highlighting their core financial strengths and vulnerabilities:
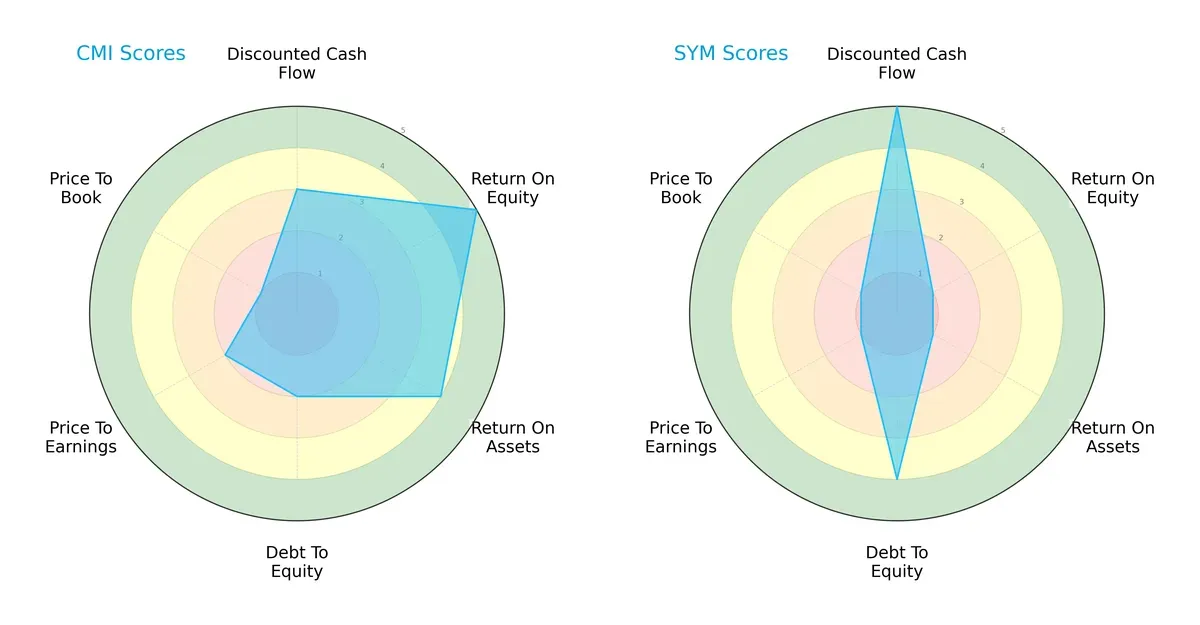
Cummins Inc. shows a balanced profile with strong ROE (5) and ROA (4), but weaker valuation scores (P/E 2, P/B 1) and high leverage risk (Debt/Equity 2). Symbotic leans heavily on DCF strength (5) and low debt (4) but struggles with profitability metrics (ROE 1, ROA 1) and valuation (P/E and P/B both 1). Cummins offers a more well-rounded financial foundation, while Symbotic depends on discounted cash flow advantages amid operational weaknesses.
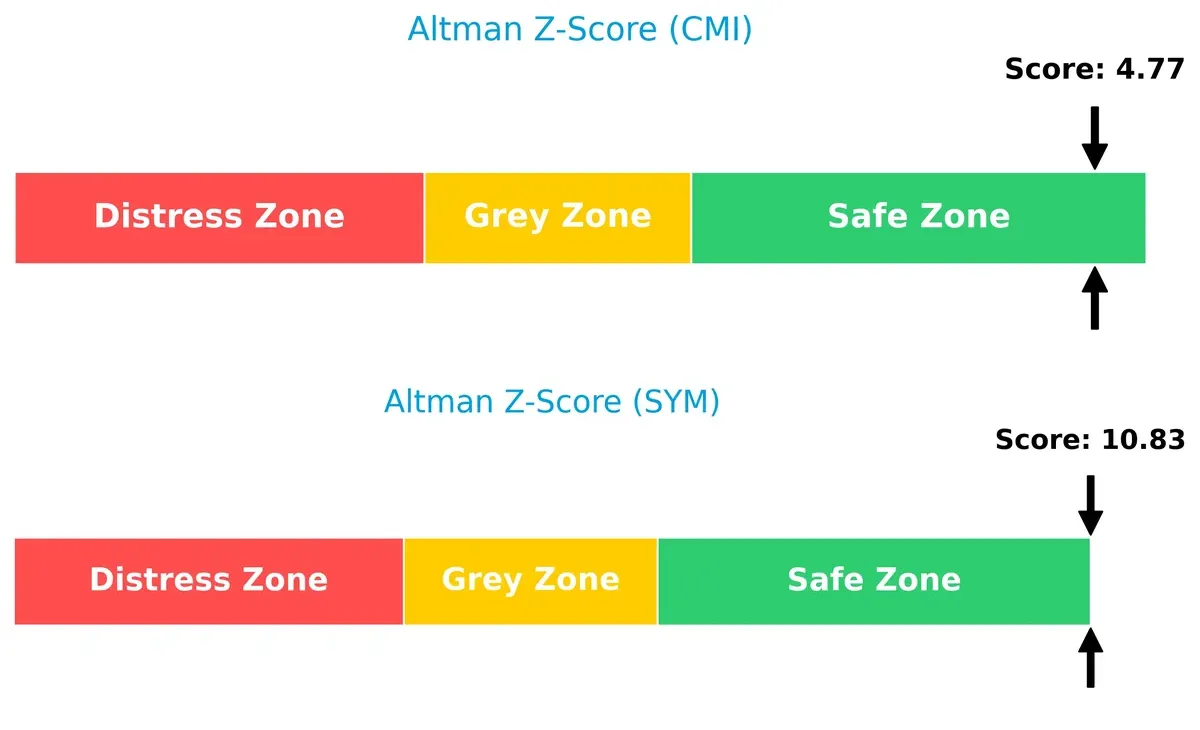
Bankruptcy Risk: Solvency Showdown
Cummins (Altman Z-Score 4.77) and Symbotic (10.83) both reside in the safe zone, but Symbotic’s higher score signals a stronger buffer against bankruptcy risk in this cycle:
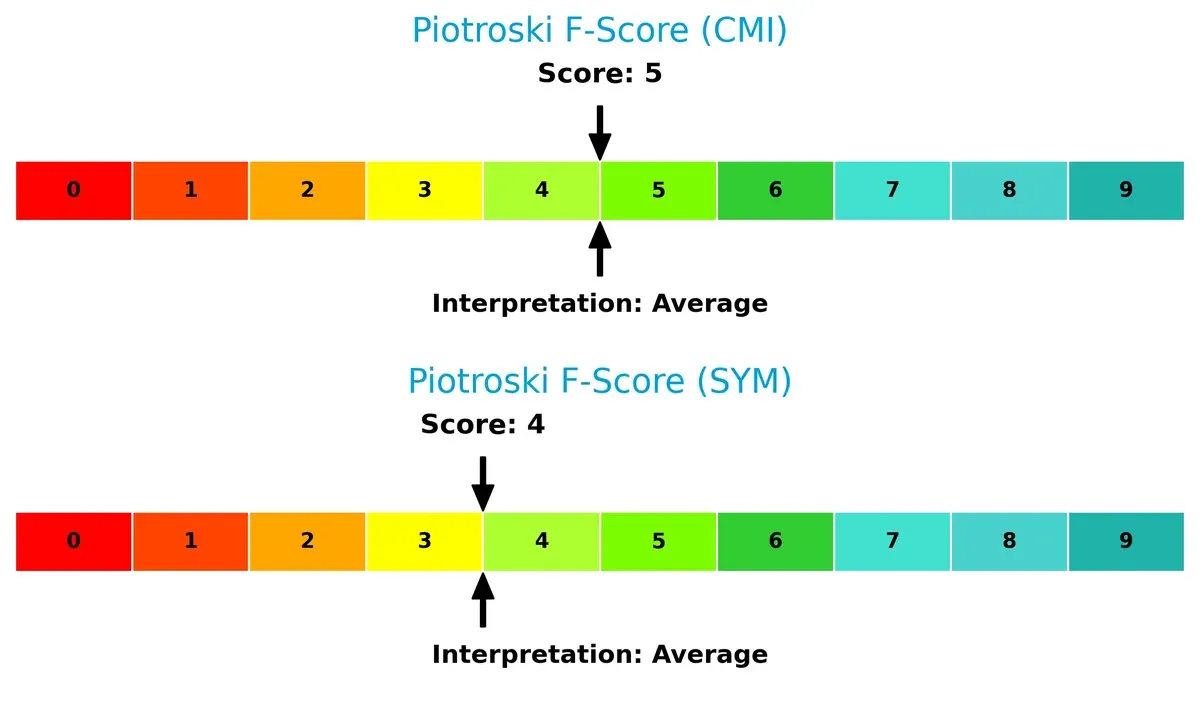
Financial Health: Quality of Operations
Cummins (Piotroski F-Score 5) and Symbotic (4) both display average financial health, with no clear red flags but also no peak operational strength:
How are the two companies positioned?
This section dissects Cummins Inc. and Symbotic Inc.’s operational DNA by comparing revenue distribution and internal strengths and weaknesses. The goal is to confront their economic moats and identify which model offers the most resilient, sustainable competitive advantage today.
Revenue Segmentation: The Strategic Mix
This comparison dissects how Cummins Inc. and Symbotic Inc. diversify their income streams and reveals their primary sector bets:
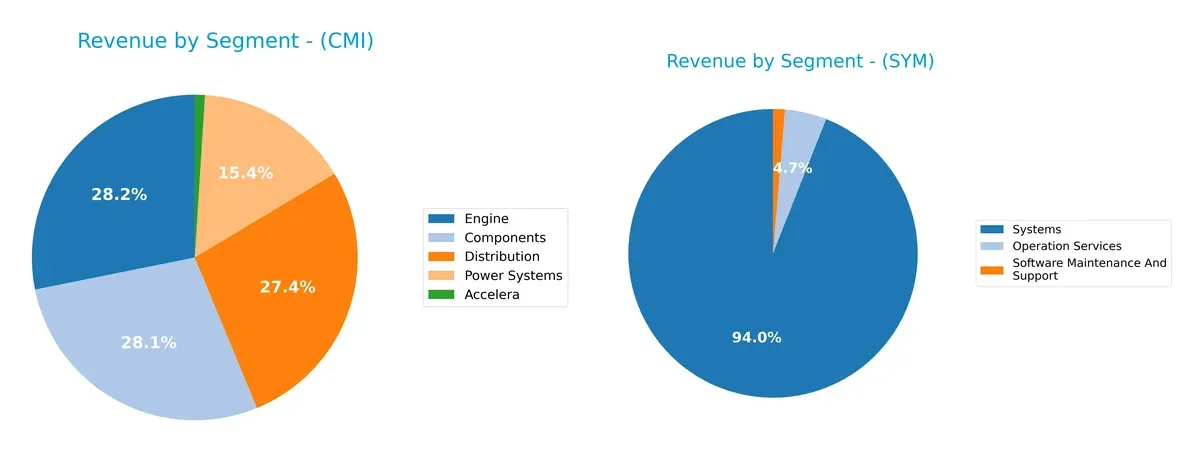
Cummins Inc. anchors revenue in Engines ($11.7B) and Components ($11.7B), supported by Distribution ($11.4B) and Power Systems ($6.4B). This broad industrial mix diversifies risk across product lines. Symbotic Inc. pivots heavily on Systems ($2.1B), dwarfing Operation Services ($105M) and Software Maintenance ($30M), signaling high concentration risk but strong ecosystem lock-in in automation technology. Cummins offers infrastructure dominance; Symbotic bets on software-driven robotics.
Strengths and Weaknesses Comparison
This table compares the strengths and weaknesses of Cummins Inc. and Symbotic Inc. based on diversification, profitability, financials, innovation, global presence, and market share:
Cummins Inc. Strengths
- Diversified revenue streams across multiple segments and geographies
- Favorable ROE and ROIC indicating efficient capital allocation
- Strong liquidity ratios with current ratio at 1.76
- Low debt-to-assets at 21.3% supports financial stability
- Significant US and international presence
- Solid fixed asset turnover at 4.84
Symbotic Inc. Strengths
- Low debt-to-assets ratio at 2.32% and debt-to-equity at 0.25 provide conservative leverage
- High fixed asset turnover at 15.92 indicates efficient use of assets
- Favorable P/E ratio despite negative earnings suggests market growth expectations
- Growing revenues in Systems and Operation Services segments
- Primarily US revenue base with some Canadian exposure
Cummins Inc. Weaknesses
- Elevated price-to-book ratio at 5.7 signals potential overvaluation
- Net margin is neutral at 8.44%, limiting profitability upside
- Moderate debt-to-equity ratio at 0.59
- Asset turnover near 1.0 is average for the sector
- Dividend yield is modest at 1.5%
Symbotic Inc. Weaknesses
- Negative profitability metrics: net margin (-0.75%), ROE (-7.65%), and ROIC (-16.63%)
- Unfavorable WACC at 13.75% increases capital costs
- Interest coverage at zero raises solvency concerns
- Very low dividend yield at 0.02%
- Concentrated geographic exposure mainly in the US
Cummins exhibits broad diversification and solid profitability supported by efficient capital use. Symbotic’s low leverage and asset efficiency contrast with its current unprofitable status and concentrated market exposure. These factors highlight differing strategic and financial profiles for each company.
The Moat Duel: Analyzing Competitive Defensibility
A structural moat is the only reliable shield protecting long-term profits from relentless competitive erosion:
Cummins Inc.: Durable Cost and Intangible Asset Moat
Cummins leverages cost advantages and proprietary engine technology, reflected in stable 25% gross margins and 8.4% net margins. Despite a slight ROIC decline in 2025, new powertrain innovations could reinforce its moat.
Symbotic Inc.: Emerging Network Effects and Automation Moat
Symbotic’s moat centers on network effects through integrated warehouse robotics, yet negative EBIT margins and declining ROIC reveal early-stage struggles. Rapid revenue growth suggests future moat expansion but also execution risk.
Moat Strength Battle: Established Cost Leadership vs. Nascent Automation Network
Cummins possesses a wider, more proven moat with consistent value creation and margin stability. Symbotic’s moat is narrower and unproven, making Cummins better positioned to defend market share in 2026.
Which stock offers better returns?
The past year shows distinct price movements and trading dynamics for Cummins Inc. and Symbotic Inc., revealing divergent momentum and market engagement patterns.
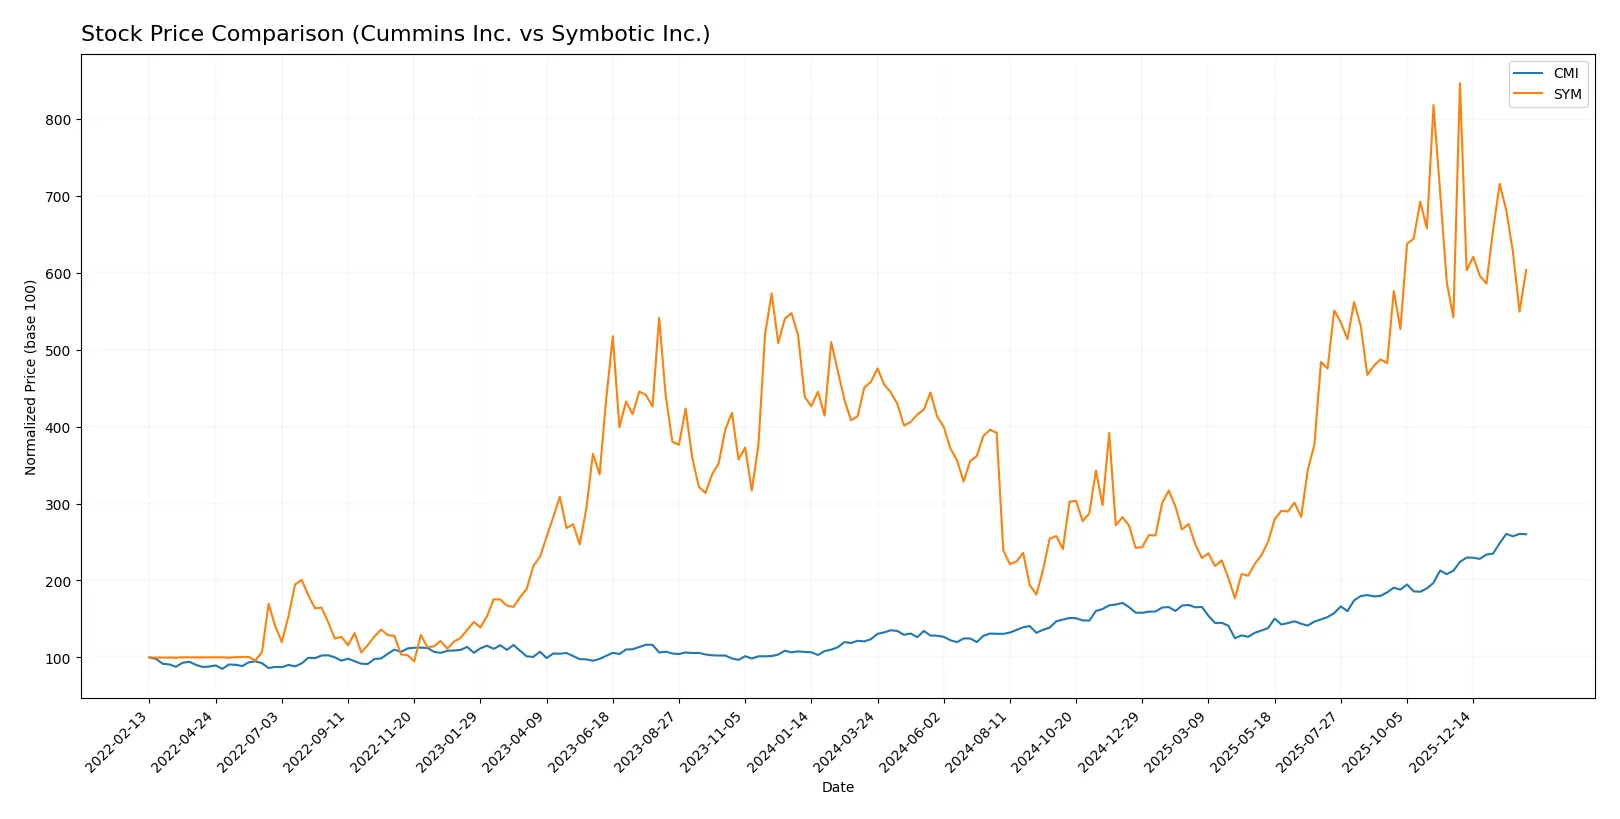
Trend Comparison
Cummins Inc. exhibits a strong bullish trend with a 110.21% price increase over the past year, showing accelerating momentum and high volatility with a 79.49 std deviation. The stock reached a high of 578.94.
Symbotic Inc. also posts a bullish trend but with a more moderate 31.7% gain and decelerating momentum. It shows lower volatility at 15.78 std deviation, with a peak price of 83.77.
Cummins Inc. leads in market performance with significantly higher gains and accelerating trend, while Symbotic’s growth is positive but more subdued and decelerating.
Target Prices
Analysts present a bullish consensus for both Cummins Inc. and Symbotic Inc., reflecting strong growth expectations.
| Company | Target Low | Target High | Consensus |
|---|---|---|---|
| Cummins Inc. | 540 | 703 | 606.1 |
| Symbotic Inc. | 42 | 83 | 66.44 |
Cummins’ target consensus sits about 5% above its current price, signaling moderate upside. Symbotic’s targets imply roughly 11% potential appreciation from its latest price.

Don’t Let Luck Decide Your Entry Point
Optimize your entry points with our advanced ProRealTime indicators. You’ll get efficient buy signals with precise price targets for maximum performance. Start outperforming now!
How do institutions grade them?
Here is a summary of recent institutional grades for Cummins Inc. and Symbotic Inc.:
Cummins Inc. Grades
The table below shows Cummins Inc.’s latest grades from reputable firms:
| Grading Company | Action | New Grade | Date |
|---|---|---|---|
| Truist Securities | Maintain | Buy | 2026-02-06 |
| Wolfe Research | Downgrade | Peer Perform | 2026-01-26 |
| Barclays | Maintain | Overweight | 2026-01-23 |
| Wells Fargo | Maintain | Overweight | 2026-01-23 |
| JP Morgan | Maintain | Neutral | 2026-01-14 |
| Citigroup | Maintain | Buy | 2026-01-13 |
| Raymond James | Upgrade | Outperform | 2025-12-22 |
| Barclays | Upgrade | Overweight | 2025-12-19 |
| Truist Securities | Maintain | Buy | 2025-12-18 |
| Citigroup | Maintain | Buy | 2025-12-11 |
Symbotic Inc. Grades
The table below presents Symbotic Inc.’s most recent grades from known institutions:
| Grading Company | Action | New Grade | Date |
|---|---|---|---|
| Needham | Maintain | Buy | 2026-02-05 |
| Barclays | Maintain | Underweight | 2026-01-12 |
| Goldman Sachs | Downgrade | Sell | 2025-12-02 |
| Barclays | Maintain | Underweight | 2025-11-26 |
| Baird | Maintain | Neutral | 2025-11-26 |
| Cantor Fitzgerald | Maintain | Overweight | 2025-11-25 |
| Craig-Hallum | Upgrade | Buy | 2025-11-25 |
| DA Davidson | Maintain | Neutral | 2025-11-25 |
| Needham | Maintain | Buy | 2025-11-25 |
| Northland Capital Markets | Maintain | Outperform | 2025-11-25 |
Which company has the best grades?
Cummins Inc. holds stronger and more consistent buy and overweight ratings compared to Symbotic Inc., which shows mixed grades including sell and underweight. This suggests Cummins currently commands greater institutional confidence, potentially influencing investor sentiment positively.
Risks specific to each company
The following categories identify the critical pressure points and systemic threats facing both firms in the 2026 market environment:
1. Market & Competition
Cummins Inc.
- Established leader in heavy machinery with diversified product lines, facing intense competition but strong brand moat.
Symbotic Inc.
- Rapidly growing automation tech company with innovative solutions but exposed to fierce competition and market adoption risks.
2. Capital Structure & Debt
Cummins Inc.
- Moderate leverage (D/E 0.59), strong interest coverage (13x), indicating controlled financial risk.
Symbotic Inc.
- Low leverage (D/E 0.25), but zero interest coverage suggests vulnerability to debt servicing if earnings don’t improve.
3. Stock Volatility
Cummins Inc.
- Beta of 1.12 reflects slightly above-market volatility, typical for industrials.
Symbotic Inc.
- Beta of 2.14 indicates high volatility, increasing risk for investors in turbulent markets.
4. Regulatory & Legal
Cummins Inc.
- Subject to stringent emissions and safety regulations, with ongoing investments in clean technologies to comply.
Symbotic Inc.
- Faces evolving robotics and automation standards, with potential regulatory uncertainty around AI and data security.
5. Supply Chain & Operations
Cummins Inc.
- Global manufacturing footprint mitigates supply risks but exposed to raw material price fluctuations.
Symbotic Inc.
- Smaller scale and reliance on specialized components heighten supply chain fragility and operational disruptions risk.
6. ESG & Climate Transition
Cummins Inc.
- Investing in electrification and emissions reduction; ESG integration is advanced but costly.
Symbotic Inc.
- ESG focus is emerging, with opportunities to lead in sustainable automation but currently less mature.
7. Geopolitical Exposure
Cummins Inc.
- Broad international presence exposes it to trade tensions and tariffs, though diversified markets provide some buffer.
Symbotic Inc.
- Primarily US-focused, limiting direct geopolitical risk but sensitive to domestic policy shifts affecting automation adoption.
Which company shows a better risk-adjusted profile?
Cummins’ most impactful risk lies in regulatory and supply chain pressures tied to global operations and emissions standards. Symbotic faces the critical challenge of negative profitability combined with high stock volatility, exposing it to market skepticism. Cummins demonstrates a stronger risk-adjusted profile, supported by robust interest coverage and a safe Altman Z-Score. Symbotic’s negative ROIC and weak liquidity metrics justify caution despite its innovative edge.
Final Verdict: Which stock to choose?
Cummins Inc. stands out with its unmatched capital efficiency and consistent value creation. Its strong ROIC above WACC signals a durable economic moat. However, investors should watch its slightly declining profitability and elevated price-to-book ratio as points of vigilance. It suits portfolios aiming for steady, industrial growth with moderate risk tolerance.
Symbotic Inc. offers a compelling moat through rapid innovation and strategic positioning in automation, supported by strong revenue growth. Its capital structure appears conservative, providing a safer balance sheet than Cummins. Yet, ongoing losses and negative returns on invested capital highlight significant execution risks. It fits a growth-at-a-reasonable-price strategy for investors comfortable with volatility.
If you prioritize established value creation and operational resilience, Cummins outshines as the compelling choice due to its proven capital returns and financial stability. However, if you seek high-growth potential with a tolerance for early-stage risk, Symbotic offers superior upside through innovation-driven expansion despite its current profitability challenges.
Disclaimer: Investment carries a risk of loss of initial capital. The past performance is not a reliable indicator of future results. Be sure to understand risks before making an investment decision.
Go Further
I encourage you to read the complete analyses of Cummins Inc. and Symbotic Inc. to enhance your investment decisions: