Home > Comparison > Industrials > CMI vs ROP
The strategic rivalry between Cummins Inc. and Roper Technologies defines the current trajectory of the industrial machinery sector. Cummins operates as a capital-intensive manufacturer of diesel engines and power systems, while Roper excels as a high-margin provider of software and engineered solutions. This head-to-head contrasts manufacturing scale with technological integration. This analysis will identify which corporate path delivers superior risk-adjusted returns for a diversified portfolio navigating industrial innovation.
Table of contents
Companies Overview
Cummins Inc. and Roper Technologies, Inc. are pivotal players in the industrial machinery sector, shaping their markets with distinct approaches.
Cummins Inc.: Powertrain and Engine Innovator
Cummins Inc. dominates as a manufacturer of diesel and natural gas engines, electric powertrains, and related components. Its core revenue derives from engine sales, parts, and services across heavy-duty transportation, construction, and energy sectors. In 2026, Cummins emphasizes expanding electrified power systems and emission solutions to address evolving regulatory and environmental demands.
Roper Technologies, Inc.: Diversified Software and Engineered Products
Roper Technologies leads in software and engineered product solutions across multiple verticals, including healthcare, transportation, and financial services. It generates revenue from cloud-based software platforms, data analytics, and precision instruments. The company’s 2026 strategy focuses on innovation in cloud analytics and automation technologies, reinforcing its position in niche industrial and software markets.
Strategic Collision: Similarities & Divergences
Cummins pursues a hardware-centric model with a growing electrification push, while Roper relies on diversified software and engineered products. Both compete indirectly for industrial innovation but differ markedly in business philosophy: Cummins builds a closed ecosystem around power solutions; Roper thrives on open, scalable software platforms. Their investment profiles diverge accordingly—Cummins offers industrial scale with evolving green tech, Roper presents steady growth through specialized software and services.
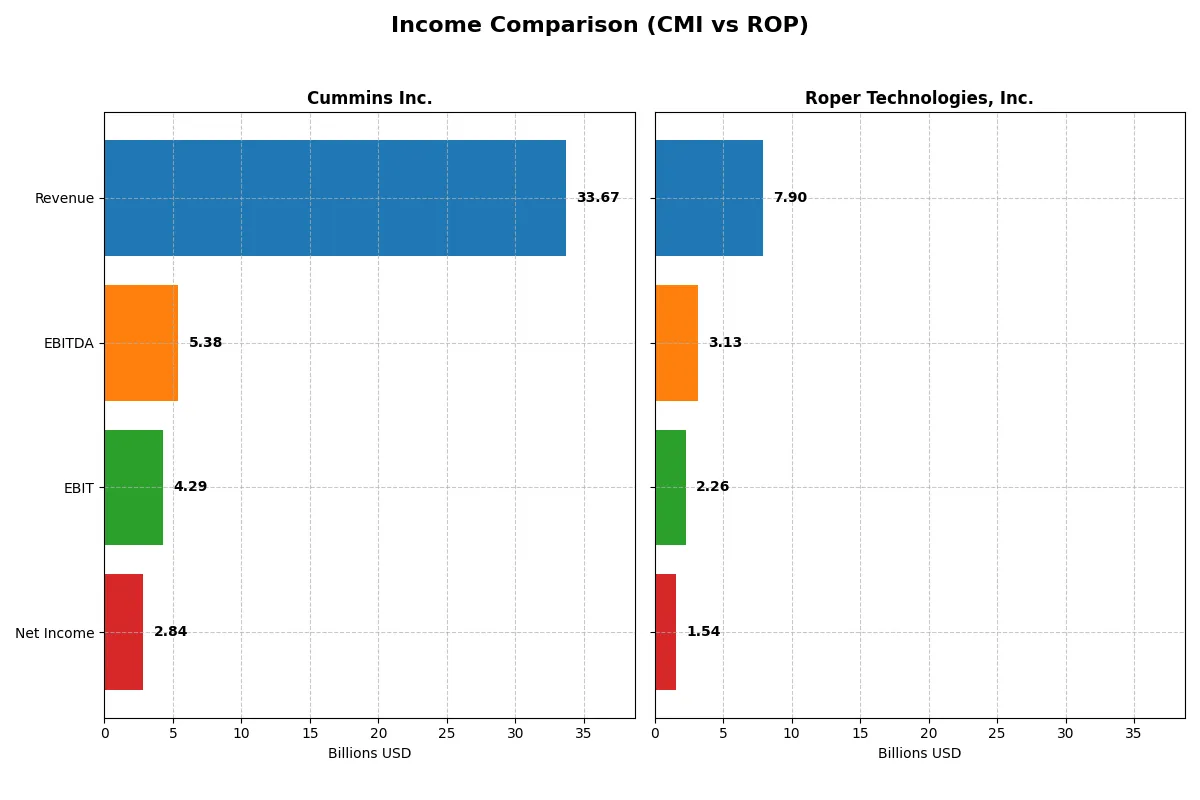
Income Statement Comparison
This data dissects the core profitability and scalability of both corporate engines to reveal who dominates the bottom line:
| Metric | Cummins Inc. (CMI) | Roper Technologies, Inc. (ROP) |
|---|---|---|
| Revenue | 33.7B | 7.9B |
| Cost of Revenue | 25.2B | 2.4B |
| Operating Expenses | 4.5B | 3.2B |
| Gross Profit | 8.5B | 5.5B |
| EBITDA | 5.4B | 3.1B |
| EBIT | 4.3B | 2.3B |
| Interest Expense | 329M | 325M |
| Net Income | 2.8B | 1.5B |
| EPS | 20.62 | 14.31 |
| Fiscal Year | 2025 | 2025 |
Income Statement Analysis: The Bottom-Line Duel
The income statement comparison reveals which company runs a more efficient and profitable engine in the evolving market environment.
Cummins Inc. Analysis
Cummins reports steady revenue growth from $24B in 2021 to $34B in 2024, then a slight dip to $33.7B in 2025. Net income climbed from $2.13B in 2021 to $3.95B in 2024 but fell sharply to $2.84B in 2025. Gross margins remain robust around 25%, while net margins hover near 8.4%, reflecting solid operational control despite recent margin pressure.
Roper Technologies, Inc. Analysis
Roper shows consistent revenue growth, rising from $4.83B in 2021 to $7.9B in 2025. Net income increased from $1.09B in 2021 to $1.54B in 2025, despite a modest decline in net margin to 19.4%. Gross margin shines at 69%, and EBIT margin at 28.6%, signaling superior profitability and operational leverage compared to peers.
Margin Strength vs. Scale Efficiency
Roper dominates on margin strength with a gross margin nearly three times higher than Cummins and a net margin more than double. Cummins delivers greater revenue scale but struggles with recent margin contraction and earnings volatility. Investors seeking high-margin growth may favor Roper’s efficient model, while those valuing scale might consider Cummins’ broader footprint.
Financial Ratios Comparison
These vital ratios act as a diagnostic tool to expose the underlying fiscal health, valuation premiums, and capital efficiency of the companies compared below:
| Ratios | Cummins Inc. (CMI) | Roper Technologies, Inc. (ROP) |
|---|---|---|
| ROE | 23.0% | 7.7% |
| ROIC | 12.0% | 5.6% |
| P/E | 24.8 | 31.1 |
| P/B | 5.7 | 2.4 |
| Current Ratio | 1.76 | 0.52 |
| Quick Ratio | 1.16 | 0.48 |
| D/E (Debt-to-Equity) | 0.59 | 0.47 |
| Debt-to-Assets | 21.3% | 26.9% |
| Interest Coverage | 12.1x | 6.9x |
| Asset Turnover | 0.99 | 0.23 |
| Fixed Asset Turnover | 4.84 | 50.4 |
| Payout Ratio | 37.1% | 23.1% |
| Dividend Yield | 1.50% | 0.74% |
| Fiscal Year | 2025 | 2025 |
Efficiency & Valuation Duel: The Vital Signs
Financial ratios serve as a company’s DNA, exposing hidden risks and operational strength that numbers alone cannot reveal.
Cummins Inc.
Cummins delivers strong shareholder returns with a 23% ROE and a solid 8.44% net margin, signaling operational efficiency. Its P/E ratio of 24.8 is fairly valued, though the elevated P/B at 5.7 suggests some premium on assets. A 1.5% dividend yield complements steady capital allocation, balancing growth and income.
Roper Technologies, Inc.
Roper shows a robust 19.4% net margin but a modest 7.7% ROE, indicating less efficient equity use. Its P/E of 31.1 appears stretched relative to industry norms. The low 0.74% dividend yield points to a growth focus, likely reinvesting heavily given its sizeable intangible asset base and strong cash flow metrics.
Premium Valuation vs. Operational Safety
Cummins offers a better risk-reward balance, combining solid returns and a reasonable valuation. Roper’s high margin and valuation come with weaker equity efficiency and liquidity concerns. Investors seeking operational safety and steady income may lean toward Cummins, while growth-focused profiles might consider Roper’s premium.
Which one offers the Superior Shareholder Reward?
I compare Cummins Inc. (CMI) and Roper Technologies, Inc. (ROP) on dividend yield, payout ratios, and buybacks. CMI yields 1.5% with a 37% payout, supported by solid free cash flow coverage (1.58x). ROP yields just 0.74%, with a 23% payout ratio but excels in free cash flow conversion at 98%. Both deploy buybacks, yet ROP’s leaner capex (0.44/share) versus CMI’s 9/share signals higher buyback potential. ROP’s distribution is more conservative, preserving cash for growth, reflecting its tech-driven reinvestment strategy. CMI’s higher yield is attractive but less sustainable amid cyclical pressures. I find ROP’s balanced payout and robust buyback strategy offer a superior total return profile in 2026.
Comparative Score Analysis: The Strategic Profile
The radar chart reveals the fundamental DNA and trade-offs of Cummins Inc. and Roper Technologies, highlighting their financial strengths and weaknesses:
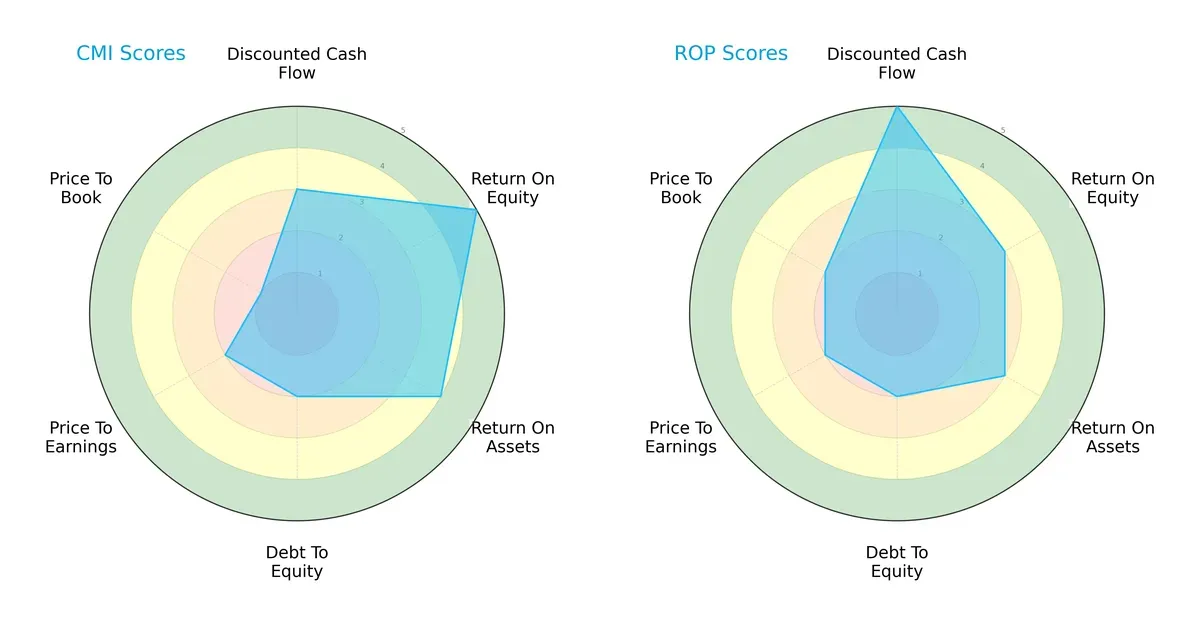
Cummins exhibits superior profitability with a higher ROE (5) and ROA (4), but struggles with valuation and leverage metrics, scoring poorly in price-to-book (1) and debt-to-equity (2). Roper shines with an excellent discounted cash flow score (5), indicating strong future cash generation, though its profitability scores are moderate. Overall, Cummins has a more balanced operational profile driven by efficiency, while Roper relies heavily on cash flow strength.
Bankruptcy Risk: Solvency Showdown
Cummins’ Altman Z-Score of 4.77 places it firmly in the safe zone, while Roper’s 2.65 signals moderate risk in the grey zone:
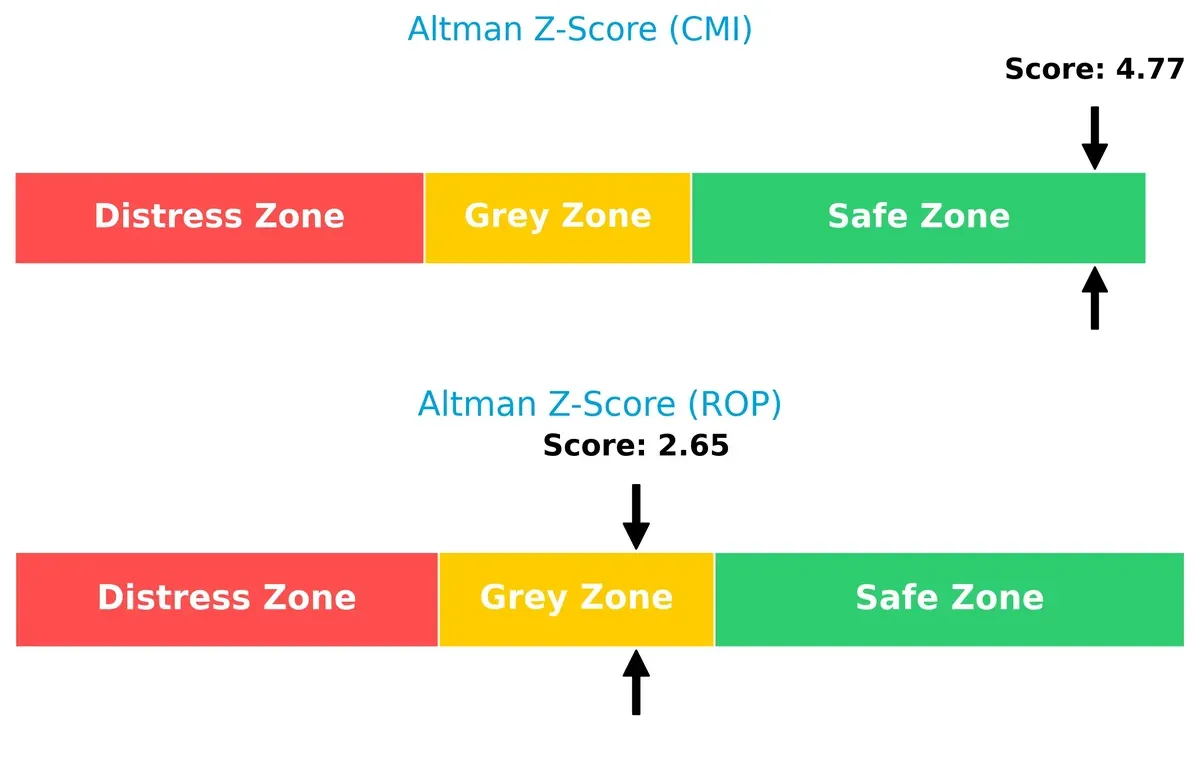
This gap suggests Cummins is better positioned to withstand economic downturns. Roper’s moderate score warrants caution, especially in volatile markets where financial resilience is key.
Financial Health: Quality of Operations
Roper’s Piotroski F-Score of 8 indicates very strong financial health, surpassing Cummins’ average score of 5:
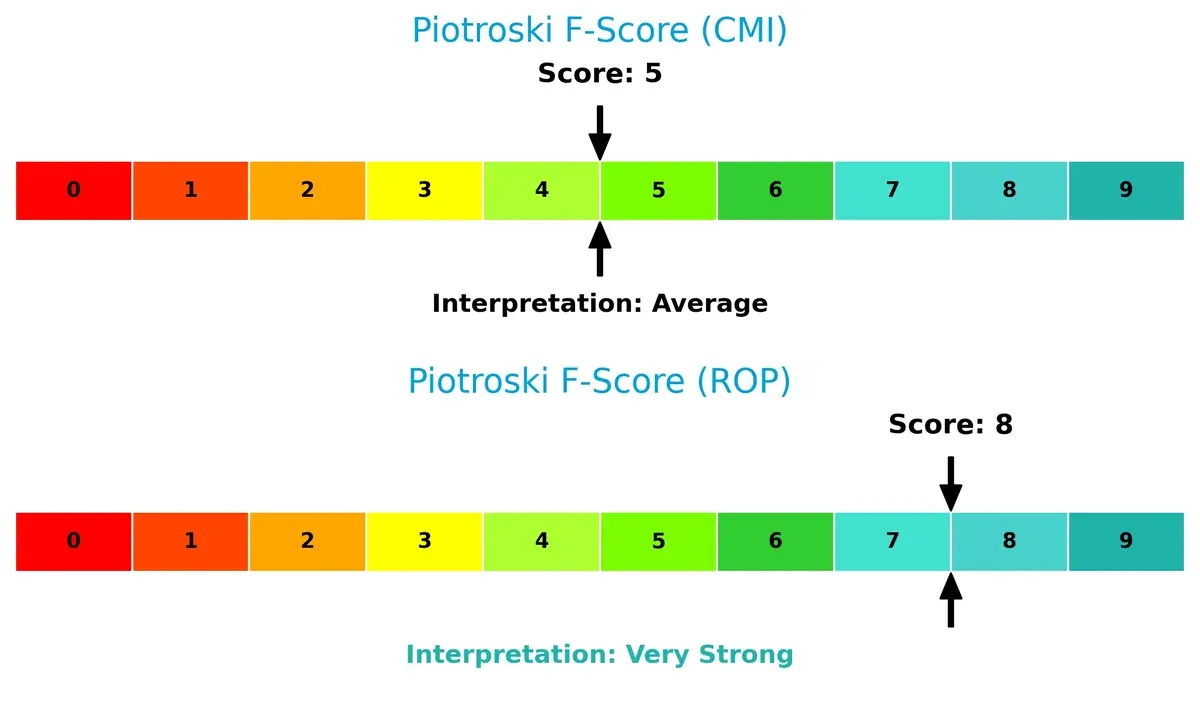
Roper demonstrates superior internal financial quality, signaling robust profitability, liquidity, and operational efficiency. Cummins’ middling score raises red flags about its internal financial metrics relative to Roper. Investors seeking quality should weigh this contrast carefully.
How are the two companies positioned?
This section dissects the operational DNA of Cummins and Roper by comparing their revenue distribution and internal dynamics. The goal is to confront their economic moats to identify which model offers the most resilient competitive advantage today.
Revenue Segmentation: The Strategic Mix
This visual comparison dissects how Cummins Inc. and Roper Technologies diversify their income streams and reveals their primary sector bets:
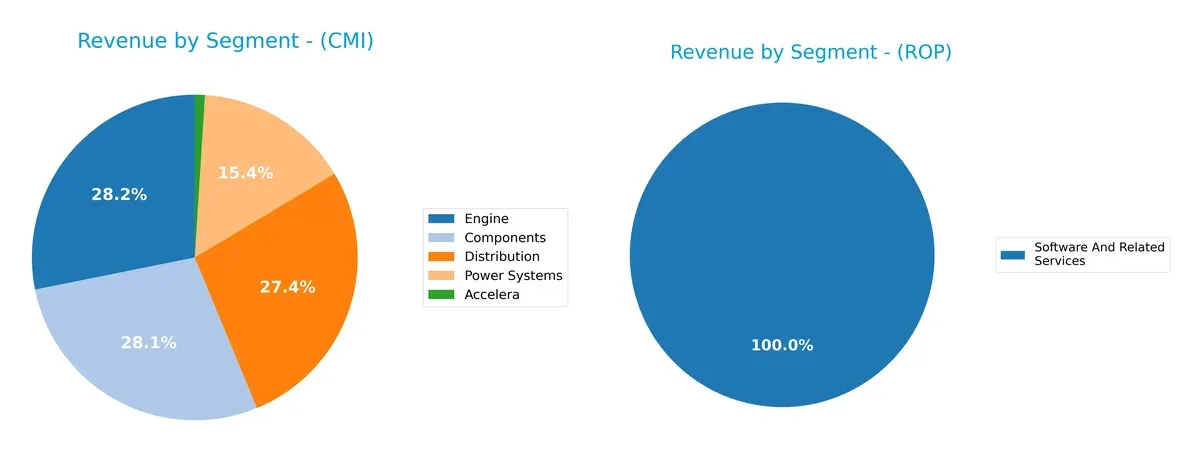
Cummins anchors revenue in Engines ($11.7B) and Components ($11.7B), maintaining a balanced industrial portfolio. Distribution ($11.4B) and Power Systems ($6.4B) add depth but less dominance. Roper’s $10.7B revenue in Software and Related Services dwarfs other segments, showing a concentrated tech focus. Cummins’ diversity reduces concentration risk; Roper pivots on software strength, banking on ecosystem lock-in and high-margin recurring revenues.
Strengths and Weaknesses Comparison
This table compares the Strengths and Weaknesses of Cummins Inc. and Roper Technologies, Inc.:
Cummins Inc. Strengths
- Diversified segments including Engine, Components, Distribution, Power Systems
- Strong profitability with ROE 23% and ROIC 12%
- Favorable liquidity ratios with current ratio 1.76
- Solid global presence with $19.4B US and $9.9B Non-US revenue
Roper Technologies Strengths
- High net margin at 19.4% indicating operational efficiency
- Favorable debt metrics with debt-to-assets 26.9% and interest coverage 6.96
- Exceptional fixed asset turnover at 50.37
- Broad software and technology product mix with $10.7B software revenue
Cummins Inc. Weaknesses
- Unfavorable high price-to-book ratio at 5.7 signals expensive valuation
- Neutral asset turnover at 0.99 may limit growth visibility
- Net margin moderate at 8.4% compared to Roper
- Limited innovation detail from revenue segments
Roper Technologies Weaknesses
- Weak liquidity ratios with current ratio 0.52 and quick ratio 0.48 raise short-term risk
- Low ROE at 7.7% despite strong net margin
- High PE ratio 31.06 suggests premium valuation
- Low asset turnover at 0.23 indicates less efficient use of assets
Both companies display distinct strategic strengths. Cummins boasts strong profitability and liquidity backed by diverse industrial segments and a broad geographic footprint. Roper excels in margin efficiency and asset utilization in tech-driven markets but faces liquidity challenges and valuation pressures. These contrasts shape their strategic positioning and risk profiles.
The Moat Duel: Analyzing Competitive Defensibility
A structural moat is the only reliable shield protecting long-term profits from relentless competition and market disruption:
Cummins Inc.: Intangible Assets and Integrated Solutions
Cummins leverages deep intangible assets and a broad ecosystem of engineered power solutions. Its stable 12.75% EBIT margin confirms strong operational leverage. New electrification products in 2026 may deepen this moat, though declining ROIC signals caution.
Roper Technologies, Inc.: Niche Software and Data Ecosystem
Roper’s moat centers on specialized software platforms and data analytics, dominating niche markets unlike Cummins’ industrial machinery. Despite a negative ROIC spread versus WACC, improving ROIC trends and 28.6% EBIT margin signal strengthening competitive positioning and growth potential.
Industrial Powerhouse vs. Software Precision
Cummins holds a wider moat with consistent value creation and robust margins. Roper shows a narrower moat but accelerating profitability. Cummins remains better equipped to defend market share amid industrial shifts in 2026.
Which stock offers better returns?
The past year shows a stark contrast between Cummins Inc. and Roper Technologies, with Cummins exhibiting strong gains and Roper facing notable declines.
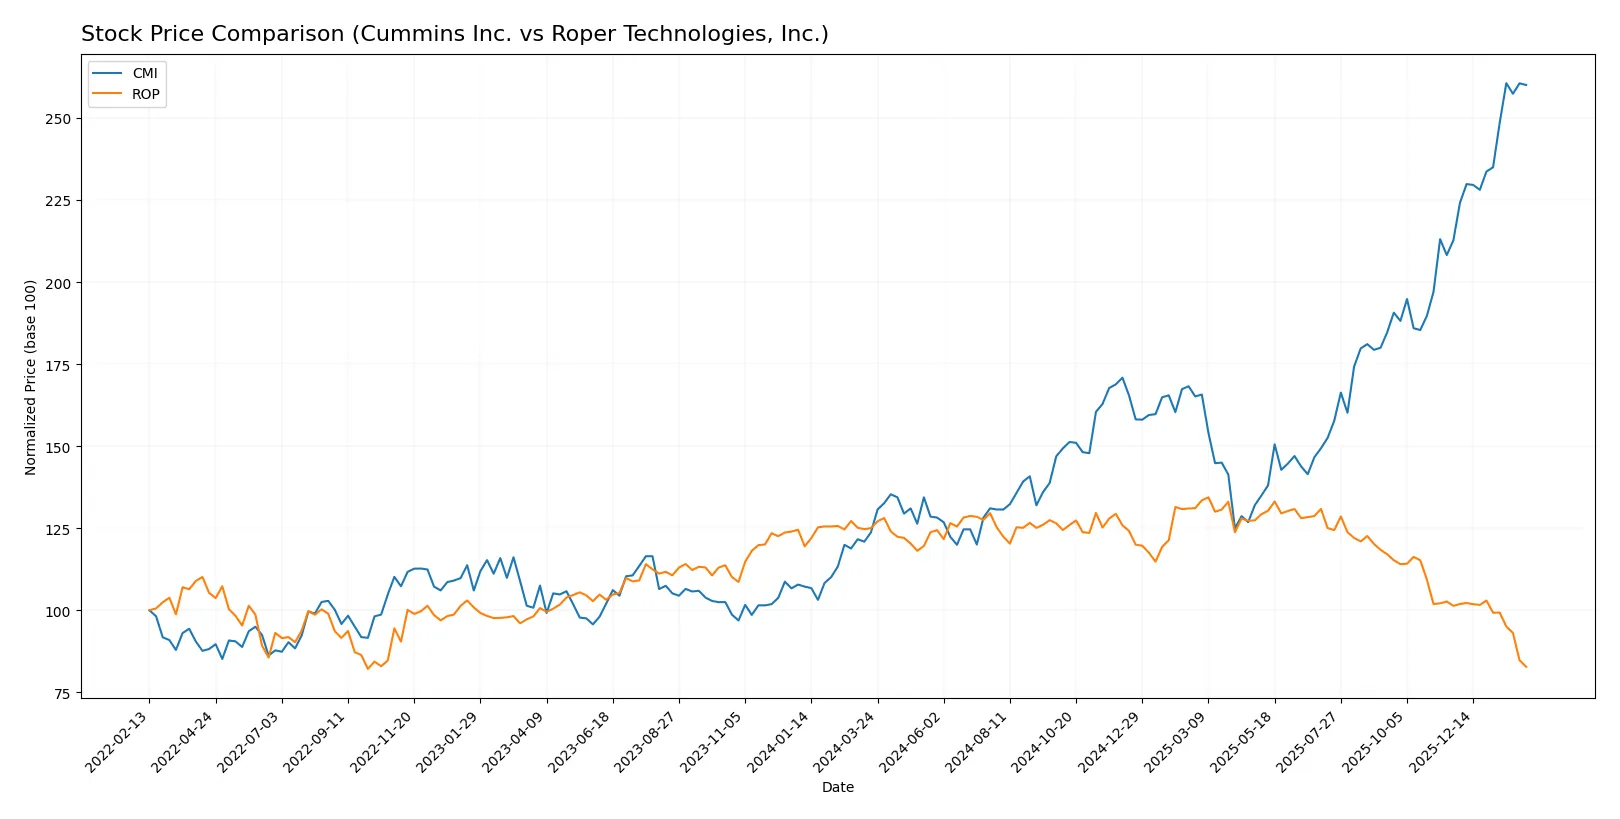
Trend Comparison
Cummins Inc. (CMI) shows a bullish trend over 12 months with a 110.21% price increase and accelerating momentum, despite high volatility and a wide price range between 266.48 and 578.94.
Roper Technologies, Inc. (ROP) experiences a bearish trend over the same period, dropping 33.79% with decelerating decline and moderate volatility, hitting a low of 362.42 against a high of 588.38.
Cummins outperforms Roper substantially, delivering the highest market return with a clear upward trajectory versus Roper’s sustained downward trend.
Target Prices
Analyst consensus indicates a mixed but cautiously optimistic outlook for these Industrials leaders.
| Company | Target Low | Target High | Consensus |
|---|---|---|---|
| Cummins Inc. | 540 | 703 | 606.1 |
| Roper Technologies, Inc. | 365 | 575 | 475.5 |
Cummins’ consensus target at 606.1 suggests modest upside from the current 577.73 price. Roper’s target consensus at 475.5 implies significant potential above the current 362.42 share price.

Don’t Let Luck Decide Your Entry Point
Optimize your entry points with our advanced ProRealTime indicators. You’ll get efficient buy signals with precise price targets for maximum performance. Start outperforming now!
How do institutions grade them?
Here is a summary of recent institutional grades for Cummins Inc. and Roper Technologies, Inc.:
Cummins Inc. Grades
The following table lists recent grades from verified grading companies for Cummins Inc.
| Grading Company | Action | New Grade | Date |
|---|---|---|---|
| Truist Securities | Maintain | Buy | 2026-02-06 |
| Wolfe Research | Downgrade | Peer Perform | 2026-01-26 |
| Barclays | Maintain | Overweight | 2026-01-23 |
| Wells Fargo | Maintain | Overweight | 2026-01-23 |
| JP Morgan | Maintain | Neutral | 2026-01-14 |
| Citigroup | Maintain | Buy | 2026-01-13 |
| Raymond James | Upgrade | Outperform | 2025-12-22 |
| Barclays | Upgrade | Overweight | 2025-12-19 |
| Truist Securities | Maintain | Buy | 2025-12-18 |
| Citigroup | Maintain | Buy | 2025-12-11 |
Roper Technologies, Inc. Grades
The following table lists recent grades from verified grading companies for Roper Technologies, Inc.
| Grading Company | Action | New Grade | Date |
|---|---|---|---|
| Goldman Sachs | Maintain | Neutral | 2026-01-29 |
| Barclays | Maintain | Underweight | 2026-01-28 |
| Argus Research | Downgrade | Hold | 2026-01-28 |
| Stifel | Downgrade | Hold | 2026-01-28 |
| Oppenheimer | Downgrade | Perform | 2026-01-28 |
| RBC Capital | Maintain | Sector Perform | 2026-01-28 |
| JP Morgan | Maintain | Underweight | 2026-01-28 |
| Mizuho | Maintain | Underperform | 2026-01-28 |
| Truist Securities | Maintain | Buy | 2026-01-28 |
| Citigroup | Maintain | Buy | 2026-01-28 |
Which company has the best grades?
Cummins Inc. generally holds stronger grades, with multiple “Buy” and “Overweight” ratings compared to Roper’s mix of “Hold,” “Underweight,” and “Neutral” grades. Investors may see Cummins as having more favorable analyst sentiment, potentially implying better near-term performance expectations.
Risks specific to each company
The following categories pinpoint critical pressure points and systemic threats confronting Cummins Inc. and Roper Technologies in the 2026 market environment:
1. Market & Competition
Cummins Inc.
- Faces intense competition in industrial engines and power systems; market cycles pressure innovation and cost efficiency.
Roper Technologies, Inc.
- Competes in diversified software and engineered products with high innovation demands; niche markets expose it to sector shifts.
2. Capital Structure & Debt
Cummins Inc.
- Moderate leverage (D/E 0.59) with favorable interest coverage (13.05x) indicates financial strength.
Roper Technologies, Inc.
- Lower leverage (D/E 0.47) but weak liquidity ratios (current ratio 0.52) raise short-term solvency concerns.
3. Stock Volatility
Cummins Inc.
- Beta at 1.12 signals slightly above-market volatility, typical for industrial machinery in cyclical environments.
Roper Technologies, Inc.
- Lower beta (0.93) suggests less sensitivity to market swings, reflecting stable software-driven revenues.
4. Regulatory & Legal
Cummins Inc.
- Exposure to evolving emissions regulations poses compliance costs and operational risks.
Roper Technologies, Inc.
- Faces data privacy and cybersecurity regulations due to software-centric business; legal compliance is critical.
5. Supply Chain & Operations
Cummins Inc.
- Complex global supply chain for hardware components vulnerable to raw material price volatility and disruptions.
Roper Technologies, Inc.
- Operational reliance on software development and specialized instruments reduces physical supply chain risks but demands talent retention.
6. ESG & Climate Transition
Cummins Inc.
- Active in emission solutions and electrified power systems, positioning well for climate transition but capital intensive.
Roper Technologies, Inc.
- Less direct exposure to carbon footprint; ESG risks tied to governance and data security practices.
7. Geopolitical Exposure
Cummins Inc.
- Global manufacturing footprint subjects it to trade tensions, tariffs, and geopolitical supply risks.
Roper Technologies, Inc.
- Primarily US-based software operations face lower geopolitical risks but remain exposed to global client markets.
Which company shows a better risk-adjusted profile?
Cummins’ most impactful risk is regulatory and supply chain vulnerability, but strong liquidity and capital structure provide a buffer. Roper’s key risk is weak liquidity and higher operational dependence on software innovation amid competitive pressure. Cummins shows a more balanced risk-adjusted profile, supported by a strong Altman Z-score (4.77, safe zone) despite the industrial cyclicality. Roper’s lower Z-score (2.65, grey zone) and liquidity red flags reduce its risk resilience, despite its very strong Piotroski score signaling operational quality. Recent liquidity metrics for Roper are a concerning trend, suggesting caution on short-term financial flexibility.
Final Verdict: Which stock to choose?
Cummins Inc. impresses with its superpower of consistent value creation through efficient capital allocation and robust returns on equity. Its primary point of vigilance lies in a modest decline in profitability trends, which may temper near-term momentum. Cummins suits investors with an appetite for aggressive growth seeking resilient industrial exposure.
Roper Technologies, Inc. builds a strategic moat through its diversified recurring revenue streams and high gross margins, offering a cushion of stability absent in more cyclical peers. Although it carries a weaker balance sheet and slower asset turnover, Roper appeals to Growth at a Reasonable Price (GARP) investors prioritizing steady cash flow and expanding profitability.
If you prioritize capital efficiency and higher return on invested capital, Cummins outshines as the compelling choice due to its value-creating track record and accelerating stock momentum. However, if you seek better stability with a strategic recurring revenue base, Roper offers superior income quality and a stronger earnings growth trajectory despite near-term valuation pressure.
Disclaimer: Investment carries a risk of loss of initial capital. The past performance is not a reliable indicator of future results. Be sure to understand risks before making an investment decision.
Go Further
I encourage you to read the complete analyses of Cummins Inc. and Roper Technologies, Inc. to enhance your investment decisions: