Home > Comparison > Industrials > CMI vs ROK
The strategic rivalry between Cummins Inc. and Rockwell Automation, Inc. shapes the future of industrial machinery. Cummins operates as a capital-intensive manufacturer of engines and power systems, while Rockwell excels as a high-tech provider of automation and digital solutions. This head-to-head pits traditional industrial manufacturing against advanced digital transformation. This analysis will identify which business model delivers superior risk-adjusted returns for a diversified investment portfolio.

Table of contents
Companies Overview
Cummins Inc. and Rockwell Automation, Inc. stand as key industrial players shaping machinery and automation markets.
Cummins Inc.: Powertrain and Engine Innovator
Cummins Inc. dominates as a global designer and manufacturer of diesel and natural gas engines, electric powertrains, and related components. Its core revenue comes from diversified segments including engines, power systems, and aftermarket parts servicing heavy-duty trucks, construction, and agriculture. In 2026, Cummins focuses strategically on expanding electrified power systems and emission solutions to address evolving environmental regulations and market demand.
Rockwell Automation, Inc.: Automation and Digital Transformation Leader
Rockwell Automation leads in industrial automation and digital solutions, offering hardware, software, and lifecycle services worldwide. Its revenue engine centers on intelligent devices, control software, and consulting services targeting discrete and process industries. The 2026 strategy emphasizes digital transformation through advanced software platforms and cybersecurity to enhance operational efficiency and client integration.
Strategic Collision: Similarities & Divergences
Both companies excel in industrial machinery but diverge in focus—Cummins emphasizes powertrain innovation, while Rockwell prioritizes automation software and services. They compete primarily in industrial efficiency—Cummins on fuel and power solutions, Rockwell on digital control. Their investment profiles differ sharply: Cummins offers a capital-intensive manufacturing moat; Rockwell presents a software-driven growth model with higher beta risk.
Income Statement Comparison
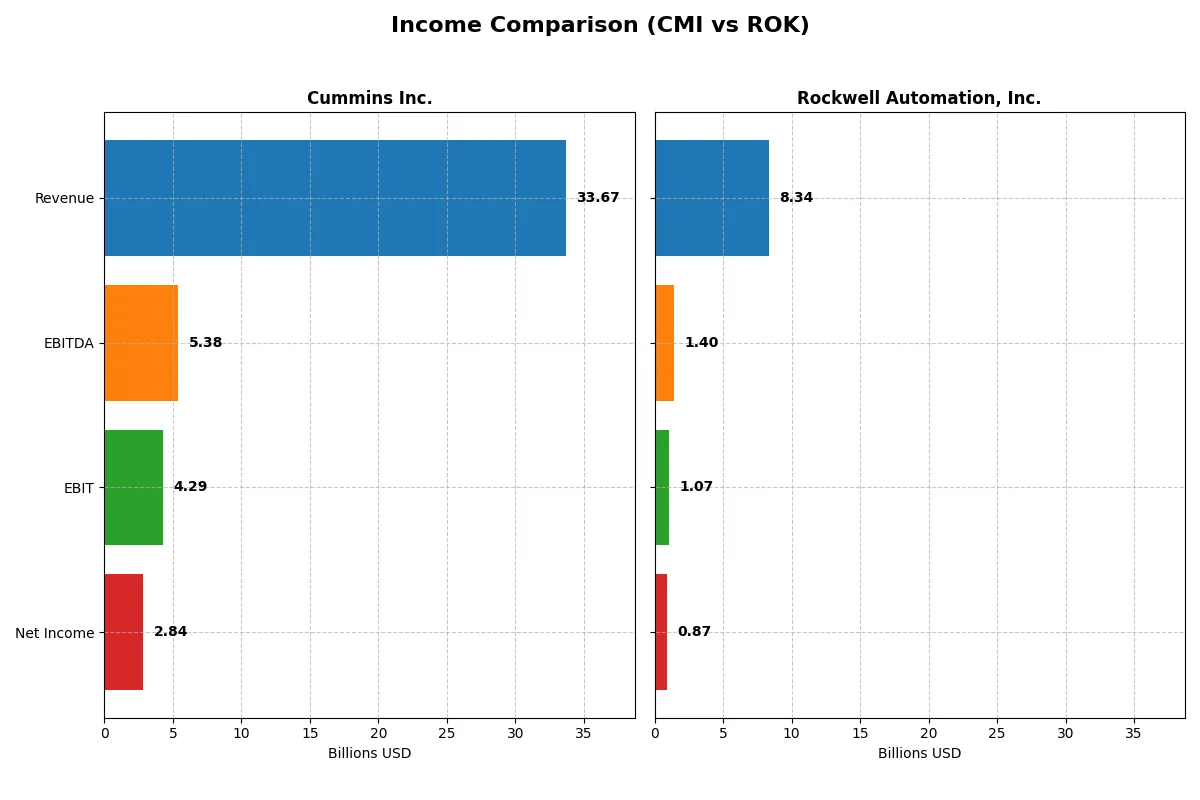
This data dissects the core profitability and scalability of both corporate engines to reveal who dominates the bottom line:
| Metric | Cummins Inc. (CMI) | Rockwell Automation, Inc. (ROK) |
|---|---|---|
| Revenue | 33.7B | 8.34B |
| Cost of Revenue | 25.2B | 4.33B |
| Operating Expenses | 4.52B | 2.59B |
| Gross Profit | 8.52B | 4.02B |
| EBITDA | 5.39B | 1.40B |
| EBIT | 4.29B | 1.07B |
| Interest Expense | 329M | 156M |
| Net Income | 2.84B | 867M |
| EPS | 20.62 | 7.69 |
| Fiscal Year | 2025 | 2025 |
Income Statement Analysis: The Bottom-Line Duel
This income statement comparison reveals which company operates its business more efficiently and converts revenue into profit effectively.
Cummins Inc. Analysis
Cummins shows a strong revenue growth of 40% from 2021 to 2025, peaking at $33.7B in 2025 but with a slight 1.3% decline from 2024. Net income surged overall by 33%, yet dropped 28% in the last year to $2.84B. Gross margin holds steady at 25.3%, while net margin remains healthy at 8.4%, reflecting solid margin control despite recent earnings pressure.
Rockwell Automation, Inc. Analysis
Rockwell’s revenue grew 19% over five years, reaching $8.34B in 2025, with a modest 1% increase from 2024. Net income declined sharply by 36% over the period and fell 7% last year to $867M. Its gross margin impresses at 48.1%, superior to Cummins, and net margin stands at 10.4%. However, recent margin contraction and earnings decline signal operational challenges.
Margin Strength vs. Earnings Growth
Cummins dominates with robust long-term revenue and net income growth, despite a recent margin dip. Rockwell boasts superior gross and net margins but struggles with declining earnings and margin erosion over time. For investors prioritizing consistent earnings growth, Cummins offers a more attractive profile, while Rockwell’s margin strength may appeal to those focused on profitability metrics.
Financial Ratios Comparison
These vital ratios act as a diagnostic tool to expose the underlying fiscal health, valuation premiums, and capital efficiency of the companies compared below:
| Ratios | Cummins Inc. (CMI) | Rockwell Automation, Inc. (ROK) |
|---|---|---|
| ROE | 23.0% | 23.8% |
| ROIC | 12.0% | 13.7% |
| P/E | 24.8 | 45.3 |
| P/B | 5.7 | 10.8 |
| Current Ratio | 1.76 | 1.14 |
| Quick Ratio | 1.16 | 0.77 |
| D/E | 0.59 | 1.00 |
| Debt-to-Assets | 21.3% | 32.5% |
| Interest Coverage | 12.1 | 9.1 |
| Asset Turnover | 0.99 | 0.74 |
| Fixed Asset Turnover | 4.84 | 6.95 |
| Payout ratio | 37.1% | 68.0% |
| Dividend yield | 1.5% | 1.5% |
| Fiscal Year | 2025 | 2025 |
Efficiency & Valuation Duel: The Vital Signs
Financial ratios act as the company’s DNA, exposing operational strengths and hidden risks crucial for assessing investment quality.
Cummins Inc. (CMI)
Cummins delivers solid profitability with a 23% ROE and favorable 12% ROIC, indicating efficient capital use. Its P/E of 24.8 suggests a fair valuation, though a high P/B of 5.7 signals a stretched equity price. The 1.5% dividend yield supports shareholder returns, balancing income with reinvestment in R&D.
Rockwell Automation, Inc. (ROK)
Rockwell posts a strong 23.8% ROE and superior 13.7% ROIC, reflecting robust operational efficiency. However, its valuation is expensive, with a P/E of 45.3 and P/B at 10.8, indicating stretched market expectations. The company pays a 1.5% dividend but faces weaker liquidity and higher leverage risks.
Balanced Efficiency vs. Premium Valuation
Cummins offers a better risk-reward balance with solid profitability and reasonable valuation metrics. Rockwell’s efficiency is strong but comes at a premium price and higher financial risk. Investors prioritizing operational safety may prefer Cummins, while those favoring growth at a cost might lean toward Rockwell.
Which one offers the Superior Shareholder Reward?
Cummins Inc. (CMI) and Rockwell Automation, Inc. (ROK) show contrasting shareholder return strategies in 2026. I observe CMI maintains a higher dividend yield around 1.5% to 2.7% with a moderate payout ratio near 37%, indicating balanced cash returns and reinvestment. Its free cash flow coverage ratio above 65% signals sustainable dividends. CMI’s buybacks appear consistent but modest, supporting shareholder value without overleveraging. Conversely, ROK delivers lower dividend yields, about 1.5% to 2.1%, with higher payout ratios close to 60-68%, implying less retained cash for growth. However, ROK’s aggressive buyback programs enhance total returns but raise leverage risks, with debt-to-equity near 1.0 and financial leverage over 3.0. I find CMI’s distribution approach more prudent and sustainable, blending dividends and buybacks with healthier FCF coverage and balance sheet strength. For 2026, I judge Cummins offers a superior total return profile, balancing income reliability and capital appreciation potential.
Comparative Score Analysis: The Strategic Profile
The radar chart reveals the fundamental DNA and trade-offs of both Cummins Inc. and Rockwell Automation, Inc., highlighting strengths and weaknesses across key financial metrics:
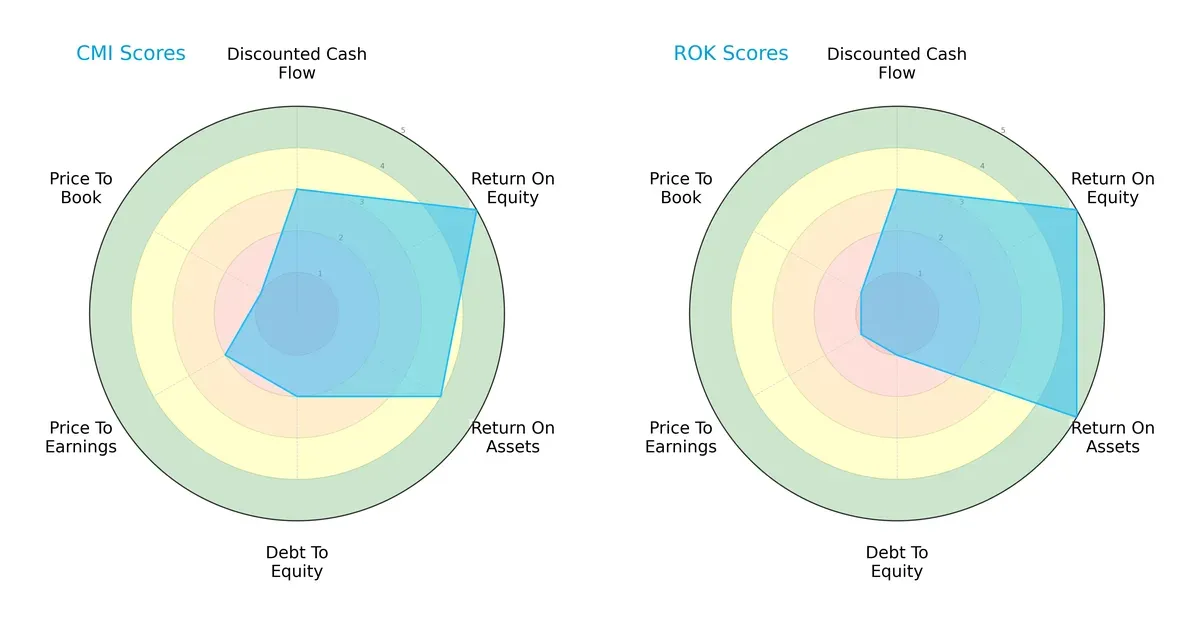
Both companies share moderate overall and discounted cash flow scores, reflecting comparable valuation frameworks. Cummins shows a more balanced return on assets (4 vs. 5) and a better price-to-earnings score (2 vs. 1), suggesting relative valuation advantages. Rockwell Automation excels in return on assets and equity equally (5 each) but carries higher financial risk, indicated by a weaker debt-to-equity score (1 vs. 2). Cummins appears less reliant on any single edge, while Rockwell leverages operational efficiency at the expense of financial leverage.
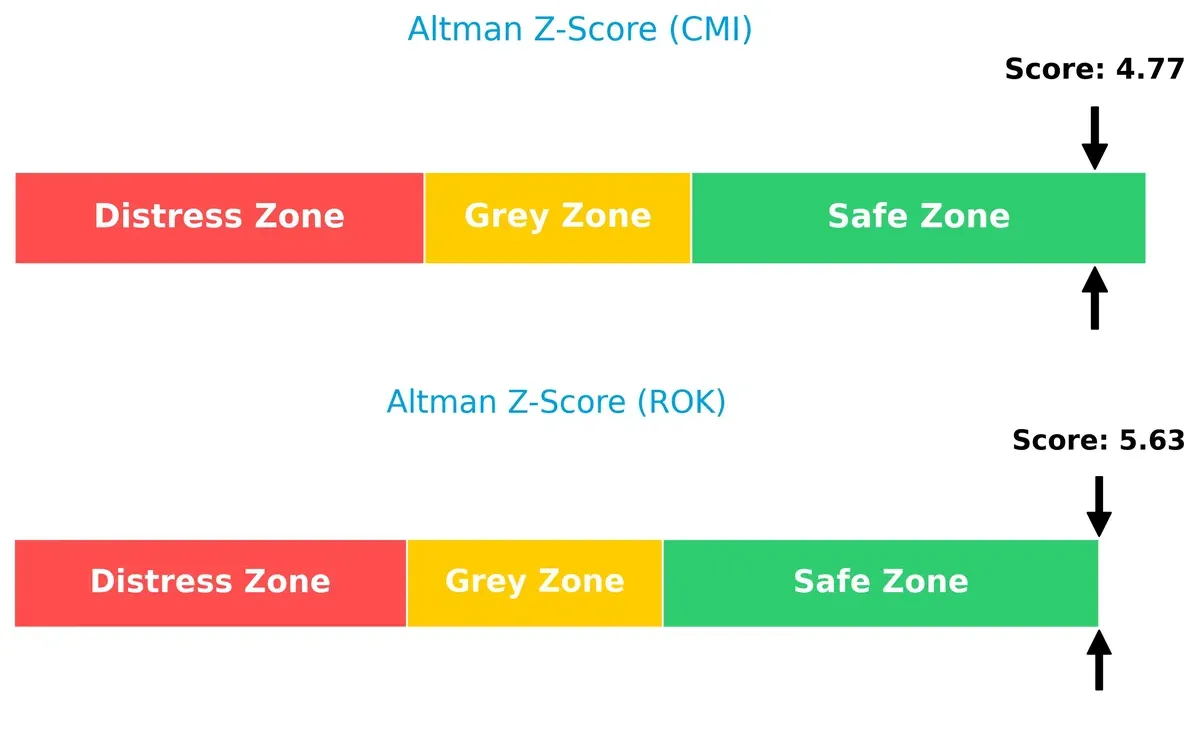
Bankruptcy Risk: Solvency Showdown
The Altman Z-Scores place both companies firmly in the safe zone, with Rockwell Automation scoring 5.63 versus Cummins’ 4.77, indicating superior long-term solvency and resilience in this market cycle:
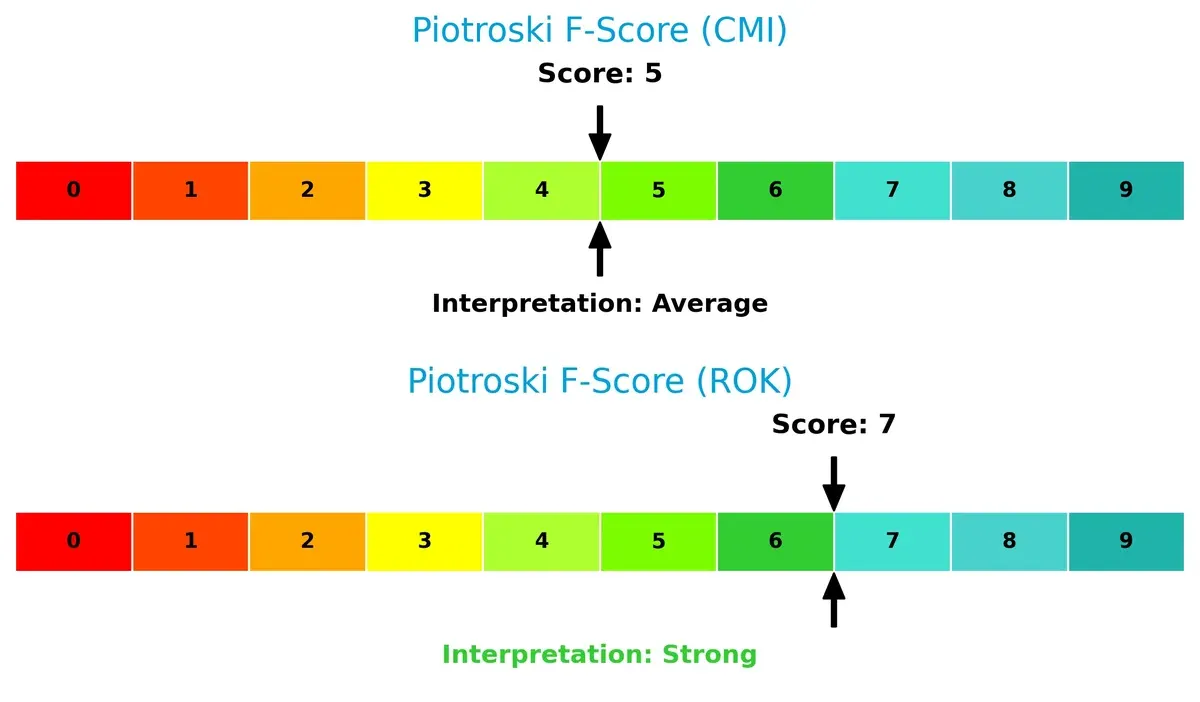
Financial Health: Quality of Operations
Rockwell Automation’s Piotroski F-Score of 7 signals strong financial health, outperforming Cummins’ average score of 5. This suggests Rockwell maintains higher internal operational quality and fewer red flags in profitability, leverage, and liquidity metrics:
How are the two companies positioned?
This section dissects the operational DNA of Cummins and Rockwell by comparing their revenue distribution and internal dynamics. The goal is to confront their economic moats and identify which model offers the most resilient competitive advantage today.
Revenue Segmentation: The Strategic Mix
This comparison dissects how Cummins Inc. and Rockwell Automation, Inc. diversify their income streams and where their primary sector bets lie:
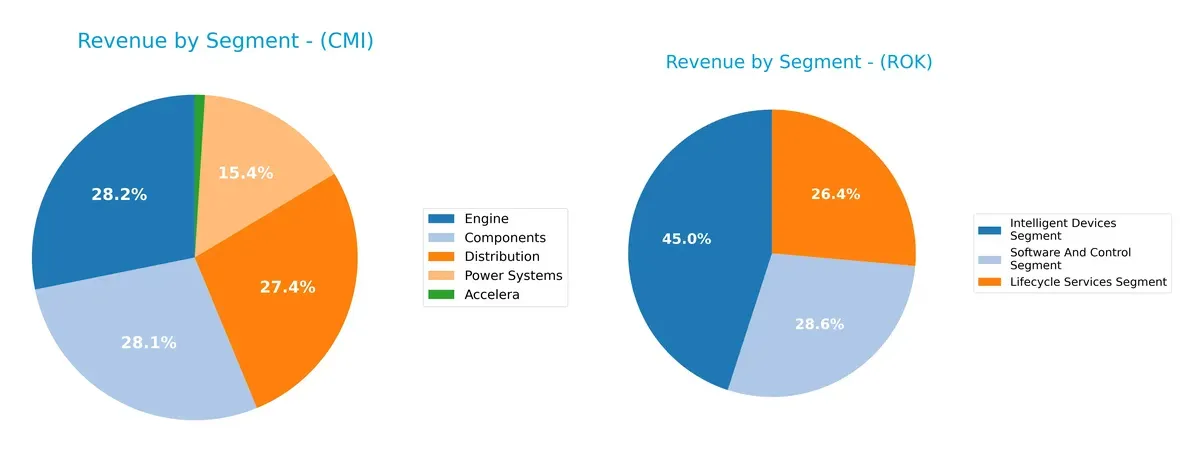
Cummins leans heavily on its Engine segment, generating $11.7B in 2024, alongside robust Components ($11.7B) and Distribution ($11.4B) revenues. This mix shows moderate diversification anchored in industrial power solutions. Rockwell Automation presents a more balanced profile with Intelligent Devices leading at $3.8B, closely followed by Lifecycle Services ($2.3B) and Software and Control ($2.2B), signaling a strategic pivot to integrated automation ecosystems. Cummins’ concentration in engines carries higher sector cyclicality risk, whereas Rockwell’s diversified tech and services mix offers resilience and ecosystem lock-in.
Strengths and Weaknesses Comparison
This table compares the Strengths and Weaknesses of Cummins Inc. and Rockwell Automation, Inc.:
Cummins Inc. Strengths
- Strong ROE (23.02%) and ROIC (12.01%) above WACC (8.56%)
- Favorable liquidity ratios (current 1.76, quick 1.16)
- Low debt-to-assets (21.3%) and solid interest coverage (13.05)
- Diverse revenue from Components, Engine, Distribution, and Power Systems
- Significant U.S. and Non-U.S. geographic presence with strong China and India sales
Rockwell Automation Strengths
- Highest net margin (10.42%) among peers
- Strong ROE (23.78%) and ROIC (13.71%) despite higher WACC (10.45%)
- Favorable fixed asset turnover (6.95) and interest coverage (6.88)
- Revenue diversification across Intelligent Devices, Lifecycle Services, Software & Control
- Large North American and growing Asia Pacific, EMEA presence
Cummins Inc. Weaknesses
- Unfavorable high price-to-book ratio (5.7) suggests possible overvaluation
- Neutral net margin (8.44%) lags Rockwell’s
- Neutral to high valuation multiples (PE 24.76)
- Moderate asset turnover (0.99) signals room for operational improvement
Rockwell Automation Weaknesses
- Unfavorable high PE (45.33) and PB (10.78) ratios indicate premium valuation risk
- Lower liquidity (quick ratio 0.77) may constrain flexibility
- Higher debt-to-assets (32.5%) and neutral debt/equity ratio (1.0) increase leverage risk
- Neutral asset turnover (0.74) below Cummins’ level
Cummins demonstrates solid financial health with conservative leverage and broad geographic reach. Rockwell excels in profitability and segment diversity but carries higher valuation and leverage risks. These contrasting profiles highlight differing strategic focuses between operational efficiency and market premium positioning.
The Moat Duel: Analyzing Competitive Defensibility
A structural moat alone shields long-term profits from relentless competitive pressure and market entry threats:
Cummins Inc.: Engineered Durability via Cost Advantage
Cummins leverages cost advantages rooted in manufacturing scale and integrated powertrain solutions. Its stable 12.75% EBIT margin reflects efficient capital use. In 2026, expansion into electrified power systems could deepen this moat but rising input costs pose risk.
Rockwell Automation, Inc.: Expanding Moat through Software & Services
Rockwell’s moat stems from intangible assets—its software ecosystem and lifecycle services. Unlike Cummins’ product focus, Rockwell drives value with growing ROIC (+77% trend) and margin stability. Continued digital transformation opens fresh market disruption avenues in 2026.
Cost Leadership vs. Digital Ecosystem Lock-in
Both firms create value with ROIC above WACC (~3.4% for Cummins, ~3.3% for Rockwell), but Rockwell’s rising ROIC and software-driven moat appear deeper. It is better positioned to defend and grow market share amid industrial digitization.
Which stock offers better returns?
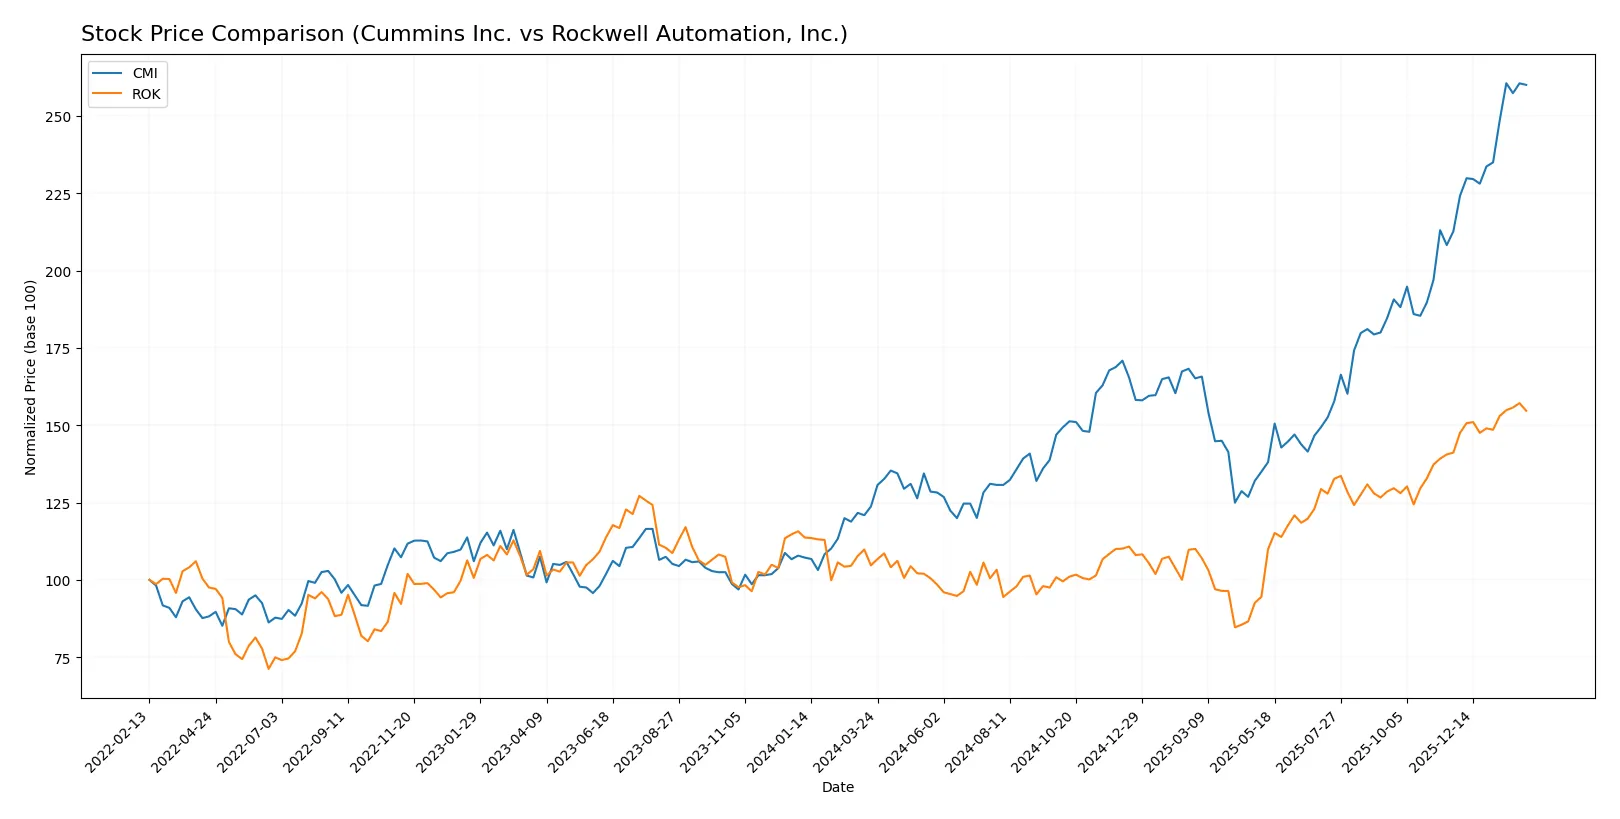
The past year reveals strong upward momentum for both stocks, highlighted by notable price surges and sustained buyer interest, reflecting robust trading dynamics and accelerating trends.
Trend Comparison
Cummins Inc. (CMI) shows a bullish trend with a remarkable 110.21% price increase over the past 12 months. The trend accelerates, hitting a high of 578.94, with significant volatility at a 79.49 standard deviation.
Rockwell Automation, Inc. (ROK) also posts a bullish trend, gaining 47.76% over the same period. It experiences acceleration with lower volatility than CMI, peaking at 421.65 and maintaining steady upward momentum.
Comparing trends, CMI outperforms ROK with more than double the price appreciation. CMI delivers the highest market performance amid stronger acceleration and volatility.
Target Prices
Analysts present a bullish consensus for both Cummins Inc. and Rockwell Automation, Inc., signaling growth potential.
| Company | Target Low | Target High | Consensus |
|---|---|---|---|
| Cummins Inc. | 540 | 703 | 606.1 |
| Rockwell Automation, Inc. | 391 | 470 | 433.63 |
Cummins trades near $578, below its $606 consensus, suggesting upside. Rockwell trades at $415, also under its $434 target, indicating room for appreciation.

Don’t Let Luck Decide Your Entry Point
Optimize your entry points with our advanced ProRealTime indicators. You’ll get efficient buy signals with precise price targets for maximum performance. Start outperforming now!
How do institutions grade them?
The following grades summarize recent institutional assessments for Cummins Inc. and Rockwell Automation, Inc.:
Cummins Inc. Grades
Below is a summary of recent grades assigned to Cummins Inc. by reputable grading companies.
| Grading Company | Action | New Grade | Date |
|---|---|---|---|
| Truist Securities | maintain | Buy | 2026-02-06 |
| Wolfe Research | downgrade | Peer Perform | 2026-01-26 |
| Barclays | maintain | Overweight | 2026-01-23 |
| Wells Fargo | maintain | Overweight | 2026-01-23 |
| JP Morgan | maintain | Neutral | 2026-01-14 |
| Citigroup | maintain | Buy | 2026-01-13 |
| Raymond James | upgrade | Outperform | 2025-12-22 |
| Barclays | upgrade | Overweight | 2025-12-19 |
| Truist Securities | maintain | Buy | 2025-12-18 |
| Citigroup | maintain | Buy | 2025-12-11 |
Rockwell Automation, Inc. Grades
Below is a summary of recent grades assigned to Rockwell Automation, Inc. by reputable grading companies.
| Grading Company | Action | New Grade | Date |
|---|---|---|---|
| Mizuho | maintain | Neutral | 2026-02-06 |
| Oppenheimer | downgrade | Perform | 2026-01-20 |
| JP Morgan | maintain | Neutral | 2026-01-16 |
| Morgan Stanley | maintain | Overweight | 2026-01-13 |
| Barclays | maintain | Overweight | 2026-01-07 |
| Wells Fargo | maintain | Equal Weight | 2026-01-07 |
| Goldman Sachs | upgrade | Neutral | 2025-12-16 |
| Jefferies | maintain | Buy | 2025-12-10 |
| Citigroup | maintain | Buy | 2025-12-08 |
| Barclays | maintain | Overweight | 2025-12-04 |
Which company has the best grades?
Cummins Inc. holds generally stronger grades, including multiple Buy and Overweight ratings, compared to Rockwell Automation’s more mixed Neutral and Overweight ratings. This difference suggests investors may view Cummins as having a slightly more favorable outlook.
Risks specific to each company
The following categories identify critical pressure points and systemic threats facing both Cummins Inc. and Rockwell Automation in the 2026 market environment:
1. Market & Competition
Cummins Inc.
- Strong presence in diversified engine markets but faces intense competition from electric powertrain disruptors.
Rockwell Automation, Inc.
- Leading in industrial automation and digital transformation but contends with rapid tech innovation and price pressure.
2. Capital Structure & Debt
Cummins Inc.
- Moderate debt-to-equity (0.59) with favorable interest coverage (13.05), indicating manageable leverage.
Rockwell Automation, Inc.
- Higher debt-to-equity (1.0) and weaker interest coverage (6.88) increase financial risk amid higher WACC (10.45%).
3. Stock Volatility
Cummins Inc.
- Beta of 1.12 suggests moderate volatility aligned with industrial sector norms.
Rockwell Automation, Inc.
- Beta of 1.53 signals elevated volatility, reflecting sensitivity to market swings and tech sector dynamics.
4. Regulatory & Legal
Cummins Inc.
- Exposure to emissions regulations pressures engine innovation and compliance costs.
Rockwell Automation, Inc.
- Faces regulatory scrutiny on data security and software standards in automation solutions.
5. Supply Chain & Operations
Cummins Inc.
- Global supply chain vulnerable to raw material price swings and logistics disruptions.
Rockwell Automation, Inc.
- Relies on specialized components; supply delays could impair project delivery and service contracts.
6. ESG & Climate Transition
Cummins Inc.
- Transitioning to electrified power systems mitigates climate risk but requires heavy R&D investment.
Rockwell Automation, Inc.
- Digital solutions support clients’ sustainability goals, positioning it well for climate transition demand.
7. Geopolitical Exposure
Cummins Inc.
- Significant global footprint exposes it to trade tensions and tariff risks.
Rockwell Automation, Inc.
- International operations face geopolitical uncertainties impacting cross-border contracts and supply chains.
Which company shows a better risk-adjusted profile?
Cummins’ most impactful risk is market disruption from electric powertrain innovation, challenging its traditional engine dominance. Rockwell’s greatest risk lies in its elevated leverage and stock volatility amid a demanding tech environment. Cummins shows a stronger risk-adjusted profile, supported by its favorable interest coverage and moderate leverage. Rockwell’s high beta and debt levels warrant caution despite its strong market position. The recent widening of Rockwell’s P/E and P/B multiples underscores valuation concerns in a volatile sector.
Final Verdict: Which stock to choose?
Cummins Inc. showcases a superpower in delivering steady value creation with a strong return on invested capital exceeding its cost of capital. Its robust liquidity underpins operational resilience. The point of vigilance lies in its recent decline in profitability metrics, suggesting cautious monitoring. Cummins suits portfolios seeking solid, slightly favorable value creation with moderate growth appetite.
Rockwell Automation, Inc. commands a strategic moat through its sustainable and growing profitability, supported by a very favorable ROIC trend. Its high gross margins reflect operational excellence and recurring revenue strength. Relative to Cummins, Rockwell carries higher leverage and valuation multiples, indicating elevated risk but also premium growth potential. It fits well within growth-at-a-reasonable-price (GARP) focused portfolios.
If you prioritize stable value creation and operational efficiency, Cummins outshines with its proven capital discipline and liquidity cushion. However, if you seek a growth-oriented strategy embracing competitive advantage expansion, Rockwell offers better stability in profitability growth despite its premium valuation. Both present analytical scenarios dependent on individual risk tolerance and investment horizon.
Disclaimer: Investment carries a risk of loss of initial capital. The past performance is not a reliable indicator of future results. Be sure to understand risks before making an investment decision.
Go Further
I encourage you to read the complete analyses of Cummins Inc. and Rockwell Automation, Inc. to enhance your investment decisions: