Home > Comparison > Industrials > CMI vs PNR
The strategic rivalry between Cummins Inc. and Pentair plc shapes the industrial machinery sector’s evolution. Cummins stands as a capital-intensive engine manufacturer with a global footprint in powertrain solutions. Pentair operates as a specialized water solutions provider, focusing on filtration and fluid control technologies. This analysis explores their contrasting operational models and growth trajectories to determine which offers a superior risk-adjusted return for a diversified portfolio in 2026.

Table of contents
Companies Overview
Cummins Inc. and Pentair plc are key players in the industrial machinery sector with distinct market footprints.
Cummins Inc.: Global Powertrain Innovator
Cummins Inc. dominates the diesel and natural gas engine market by designing, manufacturing, and servicing engines worldwide. Its core revenue engine spans heavy-duty trucks, construction, marine, and power generation. In 2026, Cummins prioritizes electrified power systems and emission solutions to maintain its competitive edge amid shifting energy trends.
Pentair plc: Water Solutions Specialist
Pentair plc commands the water treatment and fluid management market with diverse residential and industrial solutions. It generates revenue from pool equipment, filtration systems, and fluid treatment technologies under multiple trusted brands. The company’s 2026 strategy focuses on expanding industrial flow technologies to capture growth in water management and environmental sustainability.
Strategic Collision: Similarities & Divergences
Both firms excel in industrial machinery yet pursue divergent paths: Cummins invests heavily in electrification and emission controls, while Pentair centers on water and fluid technologies. Their primary battleground lies in capitalizing on global infrastructure trends—energy transition for Cummins versus water sustainability for Pentair. These contrasting focuses yield distinct investment profiles: Cummins appeals to those favoring powertrain innovation, Pentair to environmental technology proponents.
Income Statement Comparison
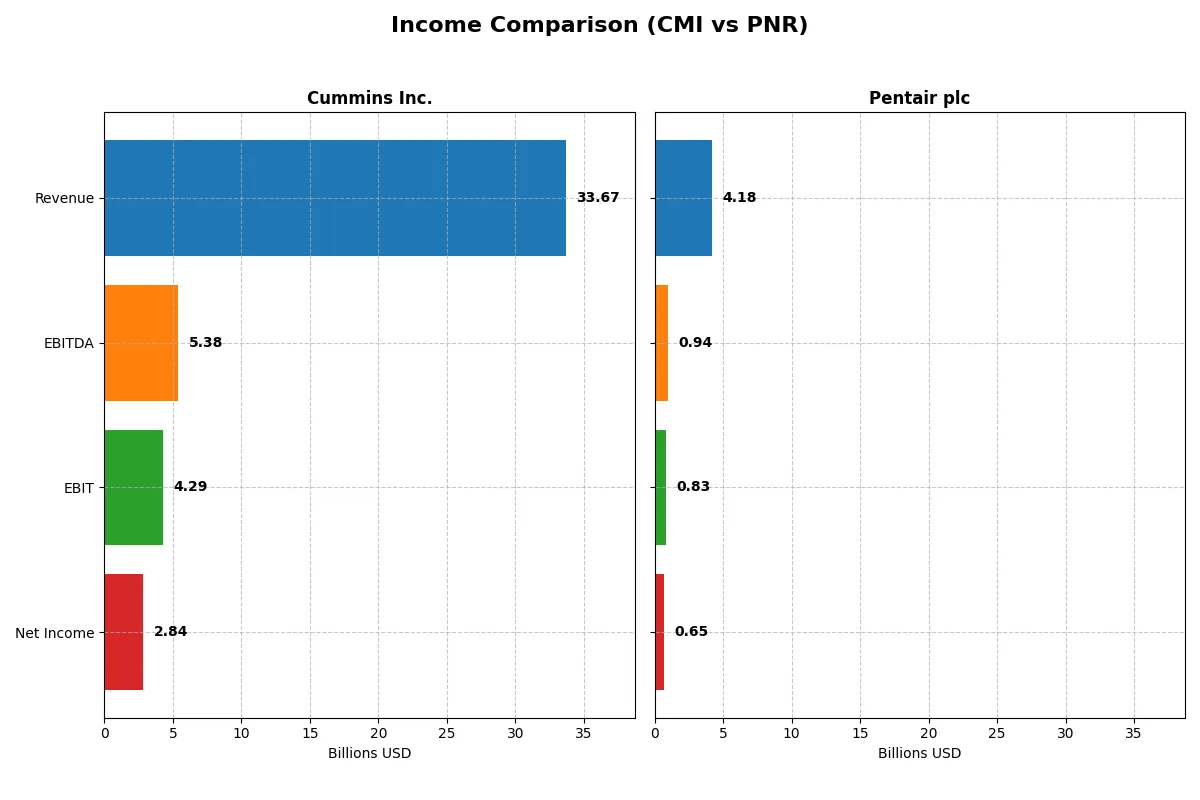
The following data dissects the core profitability and scalability of both corporate engines to reveal who dominates the bottom line:
| Metric | Cummins Inc. (CMI) | Pentair plc (PNR) |
|---|---|---|
| Revenue | 33.7B | 4.18B |
| Cost of Revenue | 25.15B | 2.49B |
| Operating Expenses | 4.52B | 833M |
| Gross Profit | 8.52B | 1.69B |
| EBITDA | 5.39B | 944M |
| EBIT | 4.29B | 826M |
| Interest Expense | 329M | 69M |
| Net Income | 2.84B | 654M |
| EPS | 20.62 | 3.99 |
| Fiscal Year | 2025 | 2025 |
Income Statement Analysis: The Bottom-Line Duel
This income statement comparison reveals how efficiently Cummins Inc. and Pentair plc convert revenue into profit and sustain growth momentum.
Cummins Inc. Analysis
Cummins’ revenue climbed 40% from 2021 to 2025, peaking at $34B before slipping 1.3% in 2025. Net income rose 33% over five years but dropped 28% last year to $2.8B. Gross margin stays healthy near 25%, yet net margin contracted to 8.4%, signaling margin pressure despite solid top-line scale. Efficiency weakened in 2025 with EBIT down 19%, reflecting rising expenses and a tougher market.
Pentair plc Analysis
Pentair’s revenue grew steadily by 11% over five years to $4.2B in 2025, with a modest 2.3% increase last year. Net income expanded 18% overall and rose 4% in 2025 to $650M. Notably, Pentair’s gross margin of 40.5% and net margin of 15.7% outperform Cummins, reflecting stronger operational leverage. EBIT margin improved slightly to 19.8%, underscoring consistent profitability and efficiency gains amidst moderate growth.
Margin Strength vs. Scale Growth
Pentair leads in margin quality and consistent profit growth, while Cummins commands larger scale but faces margin erosion and recent profit declines. Pentair’s higher profitability and improving margins appear more resilient. For investors prioritizing steady returns and operational discipline, Pentair’s profile holds greater appeal than Cummins’ volume-driven but margin-challenged trajectory.
Financial Ratios Comparison
These vital ratios act as a diagnostic tool to expose the underlying fiscal health, valuation premiums, and capital efficiency of the companies compared below:
| Ratios | Cummins Inc. (CMI) | Pentair plc (PNR) |
|---|---|---|
| ROE | 23.02% | 16.90% |
| ROIC | 12.01% | 12.46% |
| P/E | 24.76 | 26.14 |
| P/B | 5.70 | 4.42 |
| Current Ratio | 1.76 | 1.61 |
| Quick Ratio | 1.16 | 0.95 |
| D/E | 0.59 | 0.42 |
| Debt-to-Assets | 21.30% | 23.86% |
| Interest Coverage | 12.14 | 12.36 |
| Asset Turnover | 0.99 | 0.61 |
| Fixed Asset Turnover | 4.84 | 11.08 |
| Payout ratio | 37.11% | 25.13% |
| Dividend yield | 1.50% | 0.96% |
| Fiscal Year | 2025 | 2025 |
Efficiency & Valuation Duel: The Vital Signs
Financial ratios act as a company’s DNA, uncovering hidden risks and operational strengths essential for investment insight.
Cummins Inc.
Cummins delivers a strong 23% ROE and a solid 8.44% net margin, signaling robust profitability. Its P/E of 24.76 appears fair but the high P/B of 5.7 flags stretched valuation. The 1.5% dividend yield reflects moderate shareholder returns, balancing growth with steady income.
Pentair plc
Pentair posts a 16.9% ROE with an impressive 15.66% net margin, showing efficient core profitability. Its P/E of 26.14 suggests a somewhat expensive stock. A lower 0.96% dividend yield indicates restrained payouts, likely favoring reinvestment into growth initiatives and innovation.
Balanced Profitability vs. Valuation Stretch
Pentair offers higher net margins but trades at a pricier multiple, while Cummins combines favorable returns with a more moderate valuation. Cummins suits investors seeking steady income and operational resilience; Pentair appeals to those prioritizing growth despite valuation risks.
Which one offers the Superior Shareholder Reward?
I compare Cummins Inc. (CMI) and Pentair plc (PNR) on dividends, payout ratios, and buybacks. Cummins yields 1.5–2.7% with a payout ratio around 25–40%, showing solid free cash flow coverage. Pentair yields below 1%, paying out just 24–25%, but boasts strong free cash flow conversion and a more aggressive buyback approach. Cummins balances dividends and buybacks sustainably, while Pentair reinvests heavily with modest dividends and robust buybacks. I see Cummins offering a steadier, more reliable total return in 2026 given its consistent dividend and manageable payout, despite Pentair’s growth tilt. For income-focused investors, Cummins leads; for growth and buyback-driven return, Pentair offers upside but with more risk. Overall, I favor Cummins for superior shareholder reward in 2026.
Comparative Score Analysis: The Strategic Profile
The radar chart reveals the fundamental DNA and trade-offs of Cummins Inc. and Pentair plc, highlighting their financial strengths and vulnerabilities:
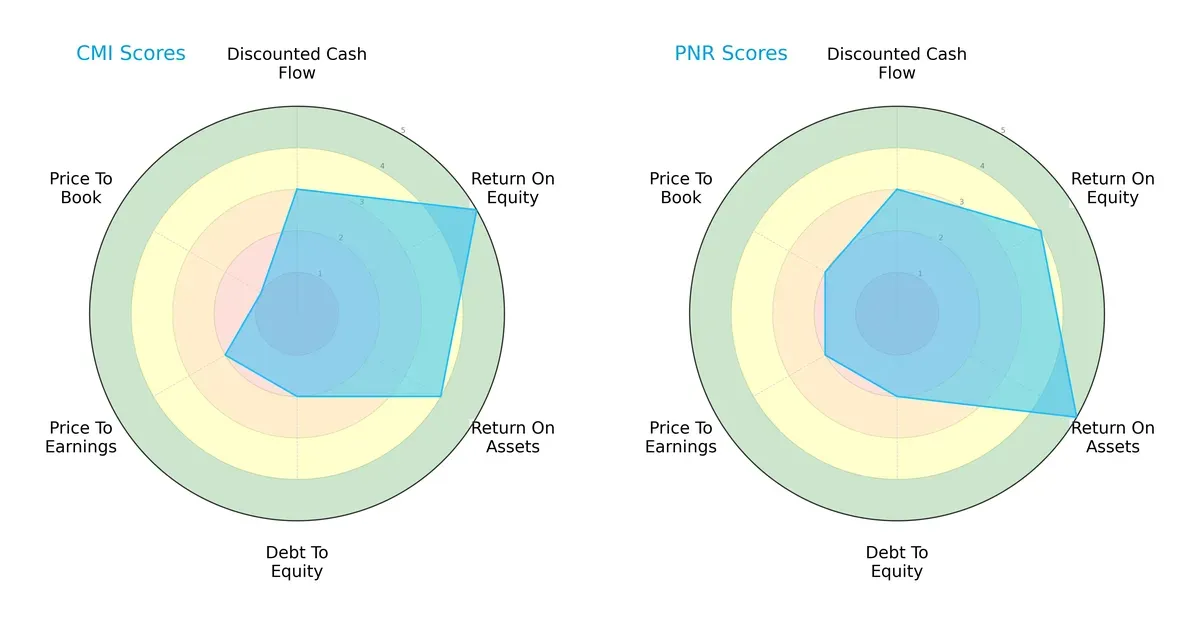
Cummins excels in Return on Equity (5) and Return on Assets (4), showing efficient capital use. Pentair leads in ROA (5) and has a slightly better Price-to-Book score (2 vs. 1), indicating relatively less valuation risk. Both share moderate DCF (3) and overall scores (3), but they face similar challenges with Debt-to-Equity (2) and Price-to-Earnings (2). Cummins presents a more equity-driven profit profile, while Pentair shows asset efficiency and marginally better valuation balance.
Bankruptcy Risk: Solvency Showdown
Cummins’ Altman Z-Score of 4.77 surpasses Pentair’s 4.21, placing both comfortably in the safe zone for bankruptcy risk in this cycle:
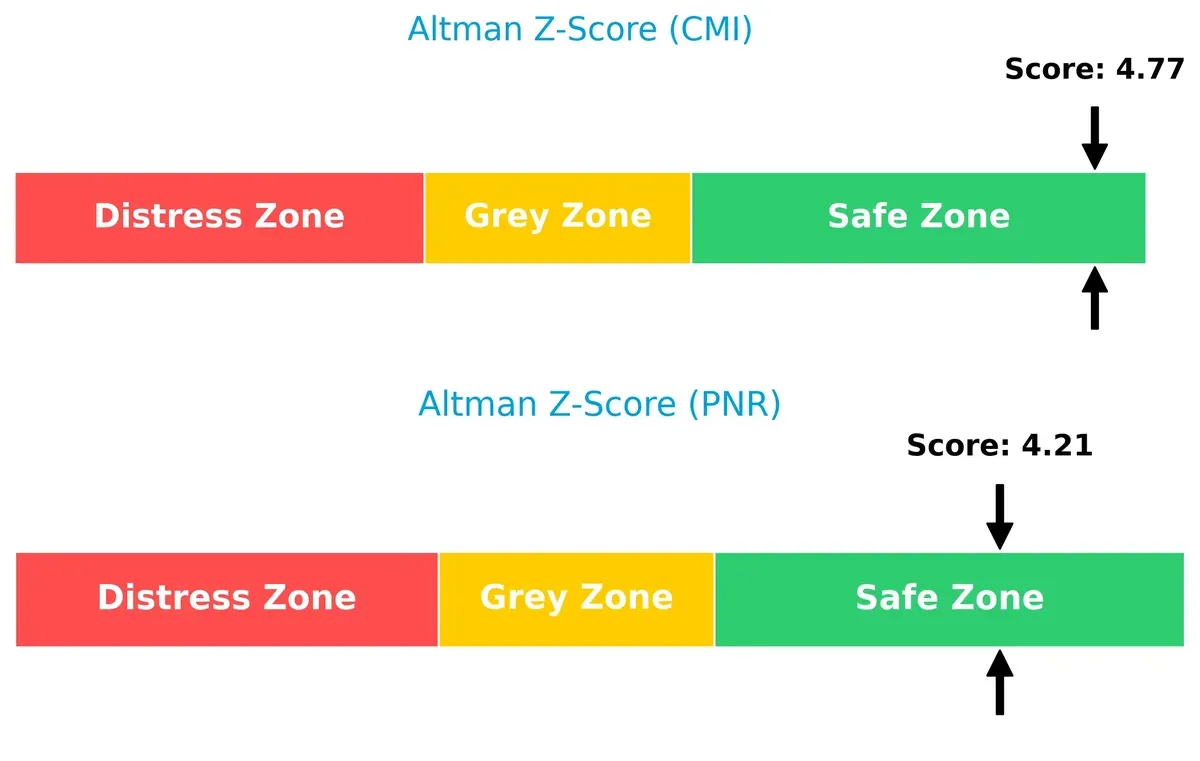
This gap suggests Cummins holds a marginally stronger buffer against financial distress, reinforcing its resilience amid economic uncertainty.
Financial Health: Quality of Operations
Pentair scores an 8 on the Piotroski F-Score, signaling robust financial health. Cummins’ score of 5 indicates average condition with some internal efficiency concerns:
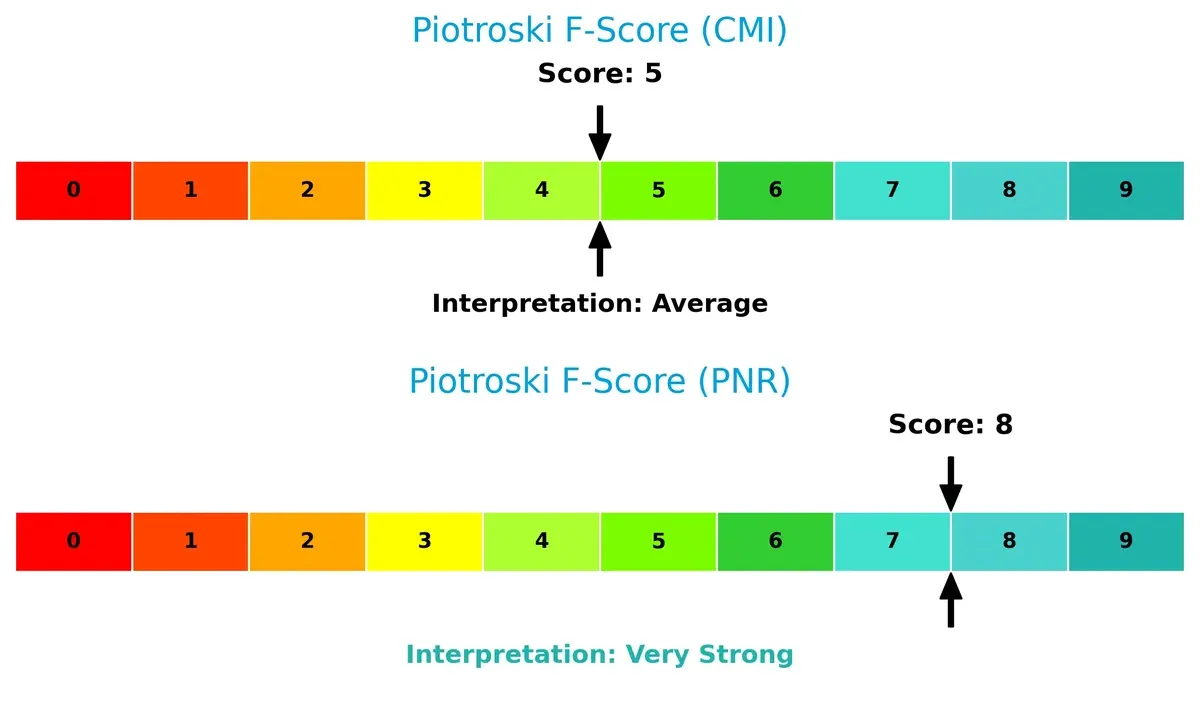
Pentair’s high score reflects superior operational quality and value potential. Cummins, while stable, exhibits red flags in internal metrics that warrant close monitoring for sustained strength.
How are the two companies positioned?
This section dissects Cummins and Pentair’s operational DNA by comparing their revenue distribution and internal strengths and weaknesses. The goal is to confront their economic moats and identify which business model provides the most resilient, sustainable competitive advantage today.
Revenue Segmentation: The Strategic Mix
This visual comparison dissects how Cummins Inc. and Pentair plc diversify their income streams and where their primary sector bets lie:
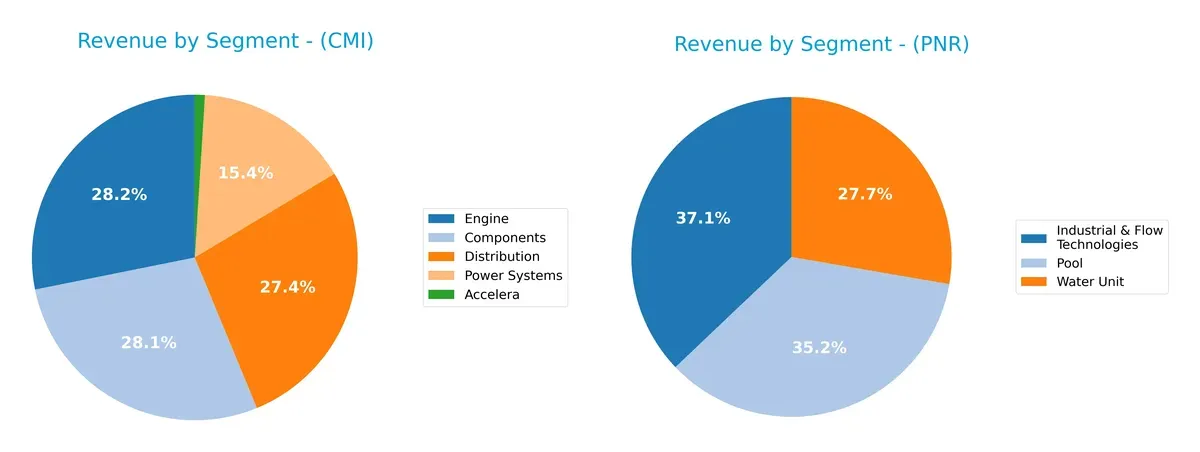
Cummins Inc. anchors its revenue in four major segments: Engine at $11.7B, Components at $11.7B, Distribution at $11.4B, and Power Systems at $6.4B. This mix reveals a balanced industrial ecosystem with moderate diversification. Pentair plc, however, pivots around three segments near parity: Industrial & Flow Technologies at $1.5B, Pool at $1.4B, and Water Unit at $1.1B, showing a narrower focus and potential concentration risk. Cummins’ broader base supports infrastructure dominance, while Pentair’s relies on specialized water solutions.
Strengths and Weaknesses Comparison
This table compares the strengths and weaknesses of Cummins Inc. and Pentair plc based on key financial and operational metrics:
Cummins Inc. Strengths
- Strong ROE at 23.02% indicating efficient equity use
- Favorable ROIC of 12.01% above WACC
- Solid liquidity with current ratio 1.76 and quick ratio 1.16
- Diversified revenue segments including Engines and Power Systems
- Significant US revenue base (~19.4B) and robust presence in China and India
- Favorable debt-to-assets at 21.3% supports conservative leverage
Pentair plc Strengths
- Higher net margin at 15.66% demonstrates strong profitability
- Favorable ROIC at 12.46% above WACC
- Favorable debt-to-equity and coverage ratios support financial stability
- Diversified product segments including Industrial & Flow Technologies and Pool
- Strong fixed asset turnover at 11.08 reflects operational efficiency
- Balanced geographic exposure with significant US and developing markets revenue
Cummins Inc. Weaknesses
- Price-to-book ratio at 5.7 flagged unfavorable, indicating potential overvaluation
- Neutral net margin at 8.44% lags competitor profitability
- Moderate asset turnover at 0.99 suggests room for efficiency gains
- Limited quick ratio compared to current ratio may signal inventory reliance
- Revenue decline in some segments like Accelera and New Power in recent years
- Heavy US revenue concentration could pose regional risk
Pentair plc Weaknesses
- Price-to-earnings at 26.14 and price-to-book at 4.42 noted unfavorable valuation metrics
- Quick ratio near 0.95 signals weaker short-term liquidity
- Dividend yield at 0.96% rated unfavorable for income investors
- Lower asset turnover of 0.61 points to less efficient asset use
- Geographic revenue less balanced with concentration in US and fewer emerging markets
Both companies show strong capital efficiency and diversified product lines. Cummins displays better liquidity metrics, while Pentair leads in profitability and asset utilization. Valuation metrics caution investors to weigh price risks alongside operational strengths.
The Moat Duel: Analyzing Competitive Defensibility
A structural moat is the only reliable shield protecting long-term profits from relentless competitive pressure. Let’s dissect the moats of Cummins Inc. and Pentair plc:
Cummins Inc.: Intangible Assets and Integrated Solutions
Cummins leverages strong intangible assets, including proprietary engine technology and emission solutions. This moat drives steady 25% gross margins and supports high ROIC, despite recent margin pressure. Expansion in electrified powertrains could deepen the moat by 2026, yet intensifying competition in alternative power challenges durability.
Pentair plc: Cost Advantage and Diversified Water Solutions
Pentair’s moat centers on cost-efficient manufacturing and a broad water solutions portfolio. It sustains superior 40% gross margins and robust EBIT margins, outperforming Cummins financially. However, a sharper ROIC decline signals potential margin pressure. Growth in residential and industrial water treatment markets offers upside if innovation sustains cost leadership.
Integrated Innovation vs. Cost Efficiency: The Moat Face-off
Both firms demonstrate slight competitive advantages with ROIC exceeding WACC by ~3.4%, but both show declining profitability trends. Pentair’s higher margins and focused cost advantage give it a wider moat. Yet, Cummins’ diversified technology base better equips it to defend market share amid evolving industrial power demands.
Which stock offers better returns?
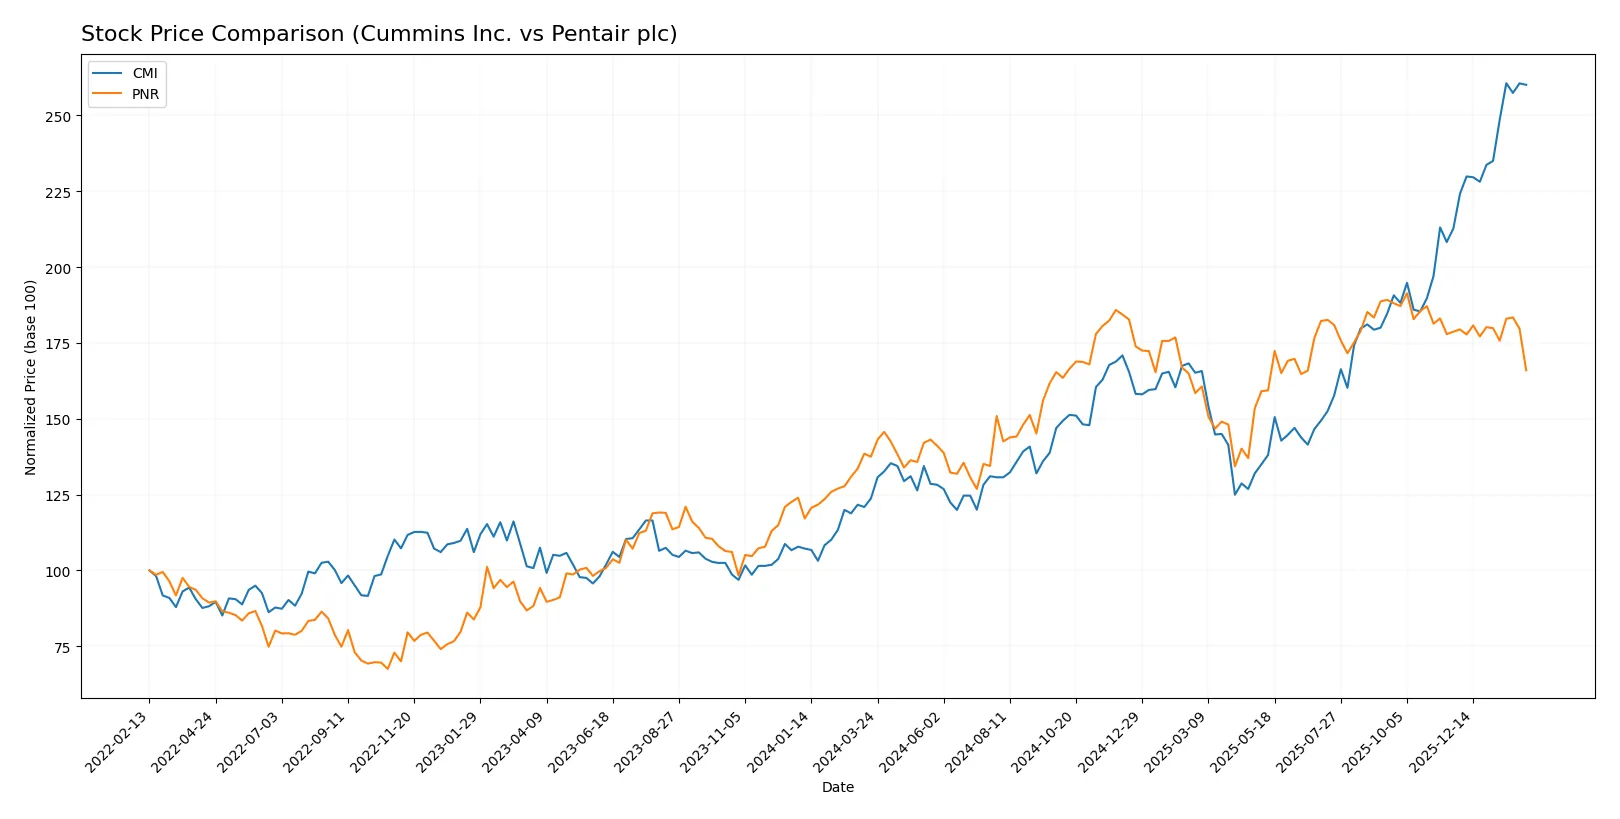
The 12-month stock price movements show Cummins Inc. surging sharply with accelerating gains, while Pentair plc posts moderate growth but recent declines under seller pressure.
Trend Comparison
Cummins Inc. shows a strong bullish trend with a 110.21% price increase over the past year. The trend accelerates, reaching a high of 578.94, despite high volatility (std dev 79.49).
Pentair plc also posts a bullish trend overall with a 20.74% gain over 12 months, but the trend decelerates. Recent price action turns bearish with a 7.1% decline and lower volatility (std dev 10.7).
Cummins Inc. outperforms Pentair plc significantly, delivering the highest market returns with accelerating momentum versus Pentair’s slowing gains and recent downturn.
Target Prices
Analysts present a solid consensus on target prices for Cummins Inc. and Pentair plc, indicating moderate upside potential.
| Company | Target Low | Target High | Consensus |
|---|---|---|---|
| Cummins Inc. | 540 | 703 | 606.1 |
| Pentair plc | 90 | 135 | 118.56 |
Cummins trades near $578, below the $606 consensus, implying modest upside. Pentair’s $97 price is well below its $118 consensus, signaling more significant growth expectations.

Don’t Let Luck Decide Your Entry Point
Optimize your entry points with our advanced ProRealTime indicators. You’ll get efficient buy signals with precise price targets for maximum performance. Start outperforming now!
How do institutions grade them?
Cummins Inc. Grades
The table below summarizes recent grades assigned to Cummins Inc. by major financial institutions.
| Grading Company | Action | New Grade | Date |
|---|---|---|---|
| Truist Securities | Maintain | Buy | 2026-02-06 |
| Wolfe Research | Downgrade | Peer Perform | 2026-01-26 |
| Barclays | Maintain | Overweight | 2026-01-23 |
| Wells Fargo | Maintain | Overweight | 2026-01-23 |
| JP Morgan | Maintain | Neutral | 2026-01-14 |
| Citigroup | Maintain | Buy | 2026-01-13 |
| Raymond James | Upgrade | Outperform | 2025-12-22 |
| Barclays | Upgrade | Overweight | 2025-12-19 |
| Truist Securities | Maintain | Buy | 2025-12-18 |
| Citigroup | Maintain | Buy | 2025-12-11 |
Pentair plc Grades
The following table details recent grades given to Pentair plc by recognized grading firms.
| Grading Company | Action | New Grade | Date |
|---|---|---|---|
| Citigroup | Maintain | Buy | 2026-02-04 |
| Oppenheimer | Maintain | Outperform | 2026-02-04 |
| JP Morgan | Maintain | Overweight | 2026-01-16 |
| Citigroup | Maintain | Buy | 2026-01-12 |
| BNP Paribas Exane | Downgrade | Underperform | 2026-01-07 |
| TD Cowen | Downgrade | Sell | 2026-01-05 |
| Jefferies | Upgrade | Buy | 2025-12-10 |
| Barclays | Downgrade | Equal Weight | 2025-12-04 |
| Oppenheimer | Maintain | Outperform | 2025-11-20 |
| UBS | Maintain | Buy | 2025-10-22 |
Which company has the best grades?
Cummins Inc. holds more consistent Buy and Overweight ratings with fewer downgrades. Pentair shows mixed ratings, including several downgrades to Sell and Underperform. Investors may view Cummins as having stronger institutional support.
Risks specific to each company
The following categories identify the critical pressure points and systemic threats facing both firms in the 2026 market environment:
1. Market & Competition
Cummins Inc.
- Faces intense competition in diesel and hybrid engine markets, pressured by shifting automotive trends.
Pentair plc
- Competes in water solutions with rising innovation demands and consolidation in filtration technologies.
2. Capital Structure & Debt
Cummins Inc.
- Moderate leverage with D/E at 0.59, interest coverage strong at 13x, signaling manageable debt risk.
Pentair plc
- Lower leverage at D/E 0.42, good interest coverage near 12x, reflecting a stronger balance sheet.
3. Stock Volatility
Cummins Inc.
- Beta 1.12 indicates moderate volatility relative to the market, with a wide price range of $260-$618.
Pentair plc
- Higher beta at 1.22, suggesting elevated volatility; stock trades between $74 and $114.
4. Regulatory & Legal
Cummins Inc.
- Subject to stringent emissions and environmental regulations impacting engine manufacturing costs.
Pentair plc
- Faces regulations tied to water quality standards and environmental compliance in global markets.
5. Supply Chain & Operations
Cummins Inc.
- Complex global supply chain vulnerable to raw material costs and geopolitical disruptions.
Pentair plc
- Supply chain focused on fluid treatment components, sensitive to commodity price swings and logistics challenges.
6. ESG & Climate Transition
Cummins Inc.
- Transition risks due to shift from diesel to electrification and hydrogen technologies.
Pentair plc
- ESG focus on sustainable water solutions offers growth but requires continuous innovation investments.
7. Geopolitical Exposure
Cummins Inc.
- Exposure to US-China trade tensions and global infrastructure spending shifts.
Pentair plc
- UK-based with global footprint, exposed to Brexit aftermath and regional trade policy changes.
Which company shows a better risk-adjusted profile?
Cummins’ primary risk lies in its heavy reliance on traditional powertrain markets amid climate transition pressures. Pentair’s key risk is elevated stock volatility amid competitive and regulatory challenges. Despite this, Pentair’s stronger balance sheet and very strong Piotroski score indicate a better risk-adjusted profile. Notably, Pentair’s fixed asset turnover at 11.08 versus Cummins’ 4.84 highlights superior operational efficiency, justifying cautious optimism despite market headwinds.
Final Verdict: Which stock to choose?
Cummins Inc. stands out for its robust capital efficiency and solid economic moat, consistently generating returns well above its cost of capital. Its main point of vigilance is a recent dip in profitability trends, which could pressure future growth. This stock suits investors seeking aggressive growth with a tolerance for cyclical swings.
Pentair plc’s strategic moat lies in its recurring revenue model and superior asset turnover, underpinning steady cash flow generation. Relative to Cummins, Pentair offers better stability and a more favorable margin profile, appealing to those favoring growth at a reasonable price with moderate risk.
If you prioritize capital efficiency and are comfortable with cyclical volatility, Cummins Inc. emerges as the compelling choice due to its strong ROIC and bullish price momentum. However, if you seek income stability and smoother growth, Pentair plc offers better stability and consistent cash flow despite a premium valuation. Both create value but cater to different investor profiles.
Disclaimer: Investment carries a risk of loss of initial capital. The past performance is not a reliable indicator of future results. Be sure to understand risks before making an investment decision.
Go Further
I encourage you to read the complete analyses of Cummins Inc. and Pentair plc to enhance your investment decisions: