Home > Comparison > Industrials > CMI vs PSN
The strategic rivalry between Cummins Inc. and Parsons Corporation shapes the evolving landscape of the industrial machinery sector. Cummins operates as a capital-intensive global manufacturer of engines and power systems. Parsons focuses on integrated defense and critical infrastructure solutions, emphasizing technology-driven services. This analysis pits manufacturing scale against specialized innovation to identify which trajectory delivers superior risk-adjusted returns for a diversified portfolio in today’s complex industrial environment.

Table of contents
Companies Overview
Cummins Inc. and Parsons Corporation hold pivotal roles in the industrial machinery sector, shaping critical infrastructure and defense markets.
Cummins Inc.: Global Powertrain Innovator
Cummins Inc. dominates the diesel and natural gas engine market with diversified revenue streams from engines, components, and electrified powertrains. Its 2026 strategy emphasizes expanding clean energy solutions and hybrid powertrain technologies, aiming to lead the transition toward sustainable industrial power. Cummins leverages a broad product portfolio across heavy-duty transportation and industrial applications worldwide.
Parsons Corporation: Defense and Infrastructure Specialist
Parsons Corporation focuses on defense, intelligence, and critical infrastructure with integrated cybersecurity, geospatial intelligence, and smart city systems driving revenue. In 2026, Parsons prioritizes innovation in missile defense, C5ISR, and infrastructure cyber protection, targeting government and private sectors. Its expertise in complex, technology-driven projects underpins growth in high-demand security and infrastructure markets.
Strategic Collision: Similarities & Divergences
Both firms operate within industrial machinery but diverge sharply: Cummins pursues a product-centric powertrain ecosystem, while Parsons embraces a service-oriented, technology-driven defense model. Their competition centers on government infrastructure and industrial innovation contracts. Cummins offers a capital-intensive, manufacturing-heavy profile; Parsons delivers a nimble, tech-focused investment opportunity with lower beta risk.
Income Statement Comparison
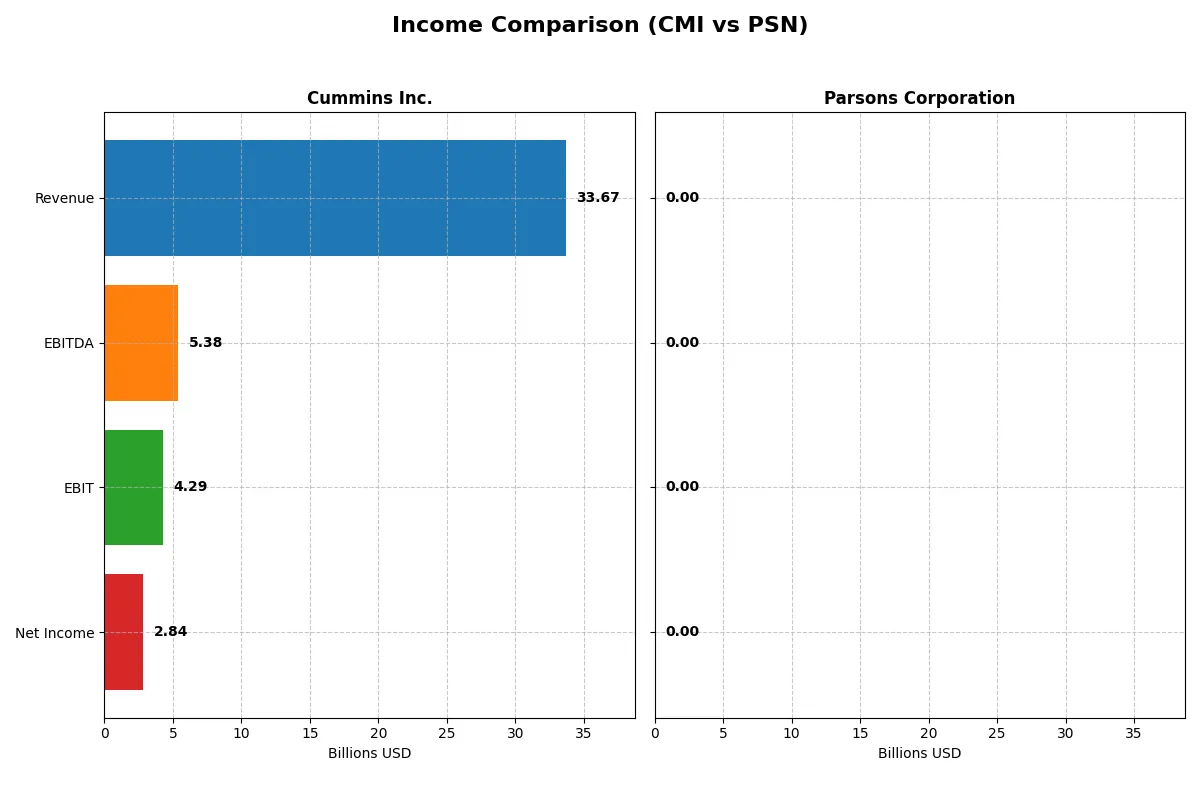
The following data dissects the core profitability and scalability of both corporate engines to reveal who dominates the bottom line:
| Metric | Cummins Inc. (CMI) | Parsons Corporation (PSN) |
|---|---|---|
| Revenue | 33.7B | 100K |
| Cost of Revenue | 25.2B | 0 |
| Operating Expenses | 4.52B | 16K |
| Gross Profit | 8.52B | 0 |
| EBITDA | 5.39B | 6.6K |
| EBIT | 4.29B | 0 |
| Interest Expense | 329M | -800 |
| Net Income | 2.84B | 3.8K |
| EPS | 20.62 | 0 |
| Fiscal Year | 2025 | 2025 |
Income Statement Analysis: The Bottom-Line Duel
This income statement comparison uncovers which company runs a more efficient and profitable corporate engine amid recent market shifts.
Cummins Inc. Analysis
Cummins shows a strong revenue base around $33.7B in 2025, with a net income of $2.84B, reflecting solid scale. Its gross margin holds steady at 25.3%, and net margin at 8.4%, indicating efficient cost management. Although revenue declined slightly last year, Cummins maintains favorable margins and a positive long-term growth trend, signaling resilience.
Parsons Corporation Analysis
Parsons exhibits a dramatic revenue drop to $100K in 2025 from $6.75B in 2024, collapsing gross profit to zero. Despite this, it reports a modest net income of $3.8K, with a net margin near 3.8%, suggesting minimal profitability. The sharp one-year declines highlight operational challenges and volatility, overshadowing previous steady growth.
Verdict: Scale and Margin Stability vs. Collapse and Recovery Hopes
Cummins clearly outperforms Parsons in revenue scale, margin health, and net income consistency. Parsons’ severe revenue contraction and zero gross margin mark a critical red flag. Investors seeking durable earnings and stable margins will find Cummins’ profile more attractive despite recent slight setbacks, while Parsons faces significant turnaround risks.
Financial Ratios Comparison
These vital ratios act as a diagnostic tool to expose the underlying fiscal health, valuation premiums, and capital efficiency of the companies analyzed:
| Ratios | Cummins Inc. (CMI) | Parsons Corporation (PSN) |
|---|---|---|
| ROE | 23.0% | 0.0001% |
| ROIC | 12.0% | 0.0002% |
| P/E | 24.8 | N/A |
| P/B | 5.7 | N/A |
| Current Ratio | 1.76 | 1.75 |
| Quick Ratio | 1.16 | 1.75 |
| D/E | 0.59 | 0.52 |
| Debt-to-Assets | 21.3% | 23.9% |
| Interest Coverage | 12.1 | -8.25 |
| Asset Turnover | 0.99 | 0.00002 |
| Fixed Asset Turnover | 4.84 | 0.00036 |
| Payout ratio | 37.1% | 0% |
| Dividend yield | 1.5% | 0% |
| Fiscal Year | 2025 | 2025 |
Efficiency & Valuation Duel: The Vital Signs
Financial ratios act as a company’s DNA, exposing operational strengths and hidden risks critical for informed investment decisions.
Cummins Inc.
Cummins delivers a strong 23% ROE and a solid 8.4% net margin, signaling efficient profitability. Its P/E of 24.8 is neutral, though a high P/B of 5.7 suggests stretched valuation. Cummins balances returns with a 1.5% dividend yield, reflecting moderate shareholder rewards alongside reinvestment in R&D (4.1% of revenue).
Parsons Corporation
Parsons shows weak profitability with near-zero ROE and a 3.8% net margin, indicating operational challenges. Valuation metrics like P/E and P/B are favorable but less meaningful due to zero earnings. The company pays no dividend, focusing on survival and restructuring rather than shareholder distributions or growth investments.
Profitability Edge vs. Valuation Strain
Cummins offers a better balance of profitability and valuation discipline, with favorable returns and modest payout. Parsons struggles on core metrics, reflecting higher risk despite attractive valuation multiples. Investors seeking operational strength lean toward Cummins; risk-tolerant profiles might consider Parsons’s turnaround potential.
Which one offers the Superior Shareholder Reward?
Cummins Inc. (CMI) delivers superior shareholder reward compared to Parsons Corporation (PSN). CMI maintains a consistent dividend yield around 1.5–2.7%, supported by a payout ratio near 37%, indicating balanced income and growth reinvestment. Its buyback programs enhance total returns with robust free cash flow coverage (65%+). Conversely, PSN pays no dividends, relying solely on reinvestment and modest buybacks, which carry higher risk given its volatile margins and weaker profitability. Historically, I’ve observed that CMI’s disciplined distribution and capital allocation foster sustainable long-term value. Therefore, I favor CMI for a more attractive total return profile in 2026.
Comparative Score Analysis: The Strategic Profile
The radar chart reveals the fundamental DNA and trade-offs of Cummins Inc. and Parsons Corporation across key financial metrics:
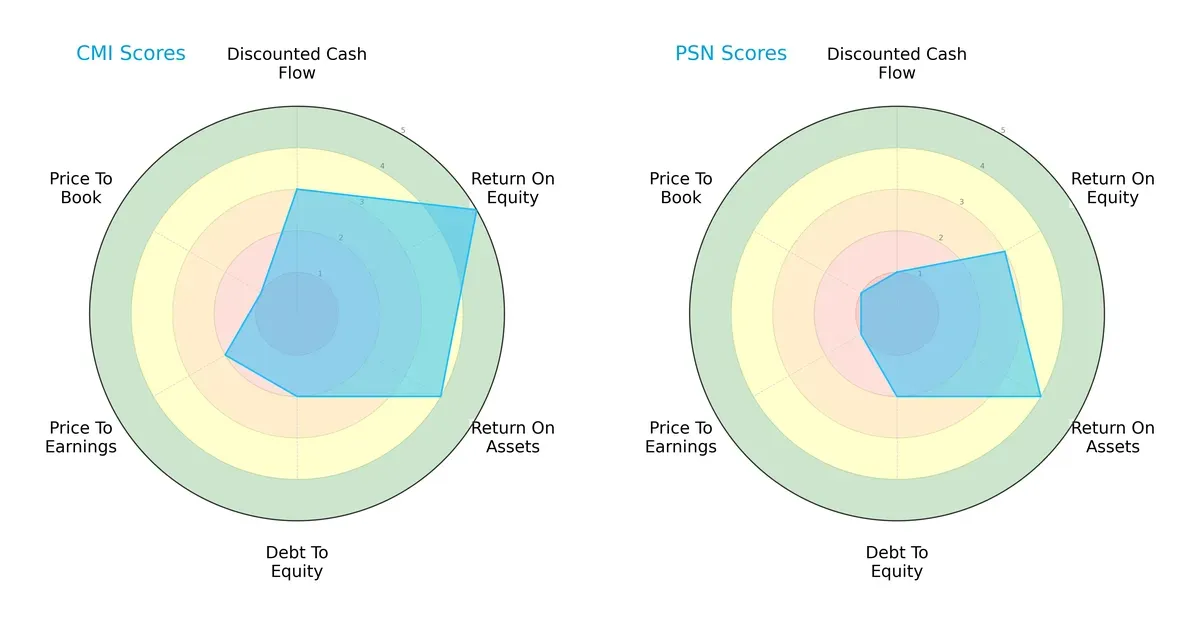
Cummins Inc. exhibits strength in return on equity (5) and return on assets (4), showing efficient capital use. Parsons lags with moderate ROE (3) but matches CMI’s ROA (4). Both share weak debt-to-equity (2) and valuation scores (PE: CMI 2 vs. PSN 1; PB: both 1). Cummins displays a more balanced profile, leveraging profitability metrics, while Parsons relies heavily on asset efficiency but suffers in cash flow and valuation measures.
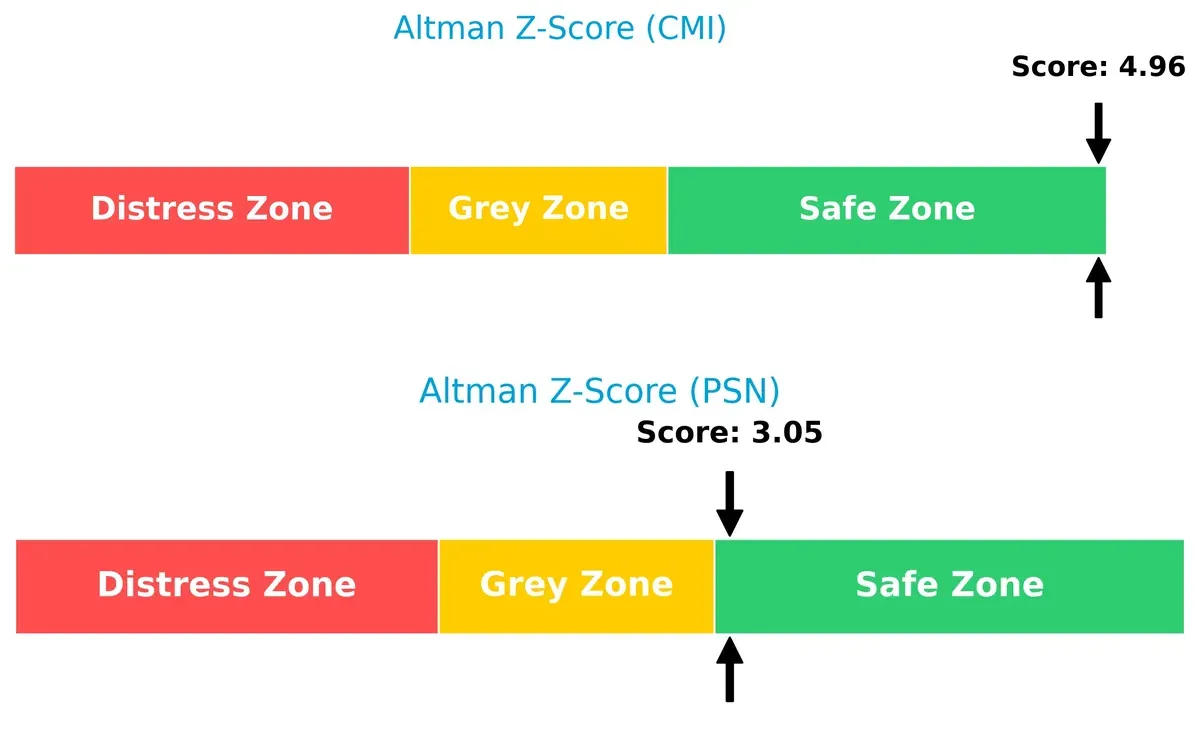
Bankruptcy Risk: Solvency Showdown
Cummins holds a stronger solvency position with an Altman Z-Score of 4.96 versus Parsons’ 3.05, both safely above the distress threshold, signaling resilience in this economic cycle:
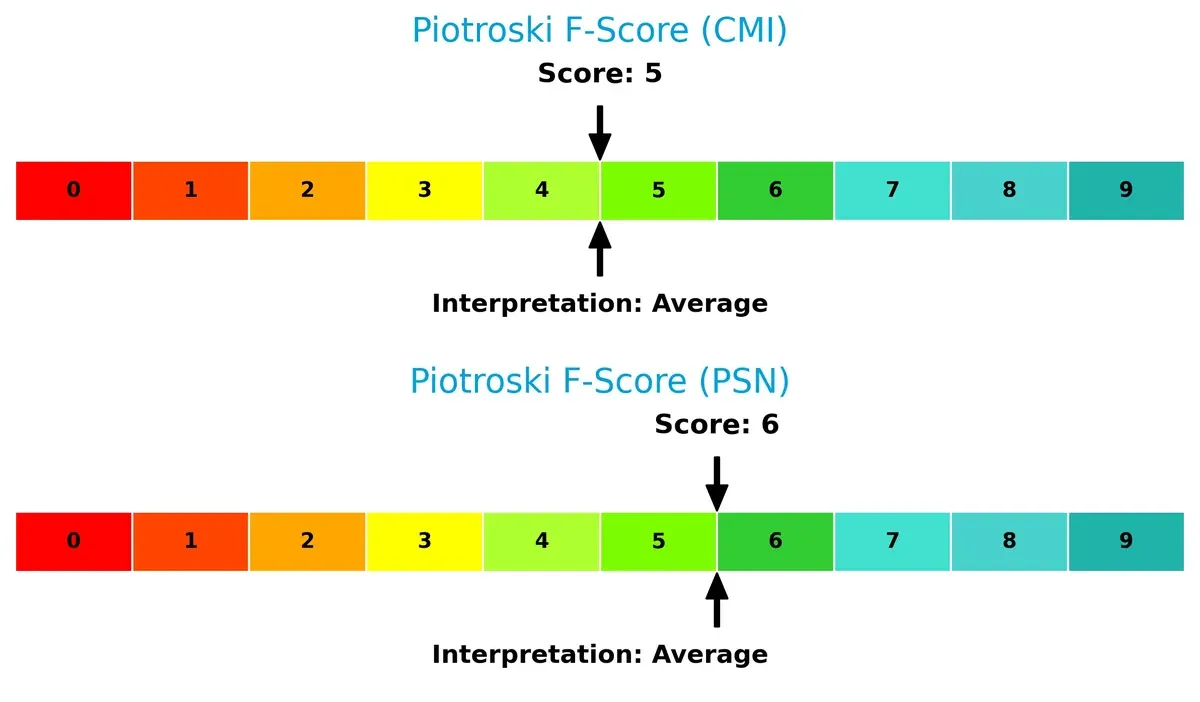
Financial Health: Quality of Operations
Cummins and Parsons post Piotroski scores of 5 and 6, respectively, both in the average range. Parsons edges slightly ahead, indicating marginally better operational quality but neither shows peak financial health or red flags:
How are the two companies positioned?
This section dissects the operational DNA of Cummins and Parsons by comparing their revenue distribution and internal dynamics. The goal is to confront their economic moats and identify which model offers the most resilient competitive advantage today.
Revenue Segmentation: The Strategic Mix
This visual comparison dissects how Cummins Inc. and Parsons Corporation diversify their income streams and where their primary sector bets lie:
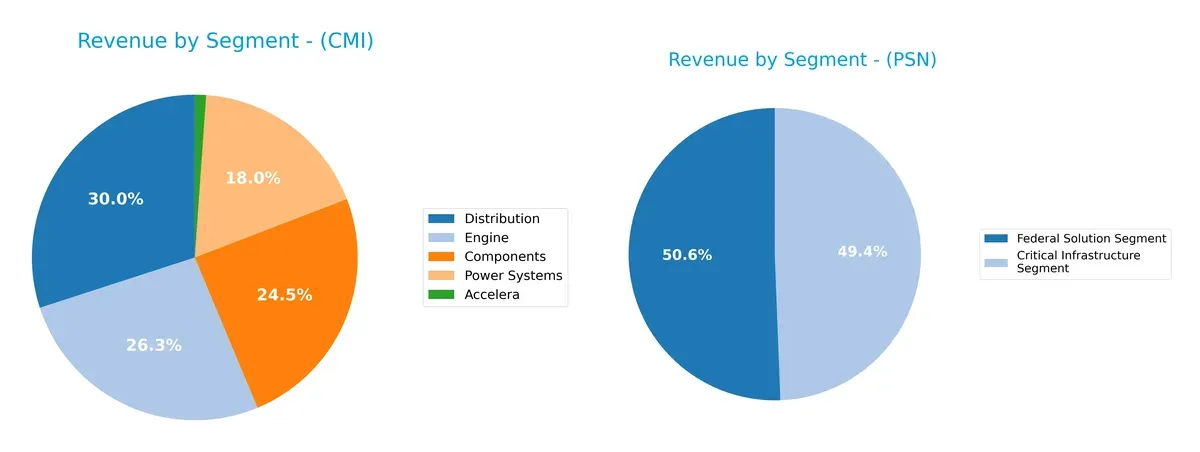
Cummins Inc. anchors revenue in Components ($10.1B), Distribution ($12.4B), and Engine ($10.9B), showing a broad industrial footprint. Parsons leans heavily on two segments: Federal Solutions ($3.2B) and Critical Infrastructure ($3.1B), reflecting focused government and infrastructure exposure. Cummins’ diversified mix reduces concentration risk, while Parsons’ reliance on public sector contracts implies strong ecosystem lock-in but higher vulnerability to budget shifts.
Strengths and Weaknesses Comparison
This table compares the strengths and weaknesses of Cummins Inc. (CMI) and Parsons Corporation (PSN):
CMI Strengths
- Diversified product segments including Engines, Components, Distribution, Power Systems
- Favorable ROE and ROIC exceeding WACC, indicating strong profitability
- Solid liquidity with current and quick ratios above 1.1
- Global presence with significant US and Non-US revenues, including China and India
PSN Strengths
- Favorable capital structure with low WACC and positive PE/PB ratios
- Strong liquidity with current and quick ratios at 1.75
- Geographic focus on North America and Middle East markets
- Federal and Critical Infrastructure segments provide niche market exposure
CMI Weaknesses
- Unfavorable price-to-book ratio suggesting potential overvaluation
- Neutral net margin and asset turnover could limit efficiency gains
- Heavy reliance on US market representing majority of revenues
PSN Weaknesses
- Low profitability with net margin, ROE, and ROIC at or near zero
- Negative interest coverage ratio signals risk in debt servicing
- No dividend yield and unfavorable asset turnover ratios
- Concentrated geographic revenues with limited diversification
Cummins shows robust profitability and diversified global revenues, though market valuation metrics warrant caution. Parsons faces significant profitability and operational challenges, despite favorable liquidity and niche market focus, which may constrain its strategic growth.
The Moat Duel: Analyzing Competitive Defensibility
A structural moat protects long-term profits from the relentless pressure of competition. Without it, gains erode quickly in any industry:
Cummins Inc.: Cost Leadership and Technological Innovation
Cummins relies on a cost advantage paired with advanced powertrain technologies. This shows in its stable 25% gross margin and 8.4% net margin. Emerging electrification and hydrogen initiatives could deepen its moat in 2026.
Parsons Corporation: Specialized Federal Contract Expertise
Parsons leverages intangible assets via specialized defense contracts, unlike Cummins’ scale-driven advantage. Its ROIC trends negative, signaling weak profitability. However, expanding cybersecurity and space tech offer growth but with execution risk.
Cost Efficiency vs. Contract Specialization: The Moat Battle
Cummins commands a wider moat with consistent value creation and diversified markets. Parsons faces value destruction and a shrinking moat. Cummins stands better equipped to defend its market share in this industrial landscape.
Which stock offers better returns?
Over the past year, Cummins Inc. surged sharply with accelerating gains, while Parsons Corporation faced a prolonged decline marked by deceleration in price drops.
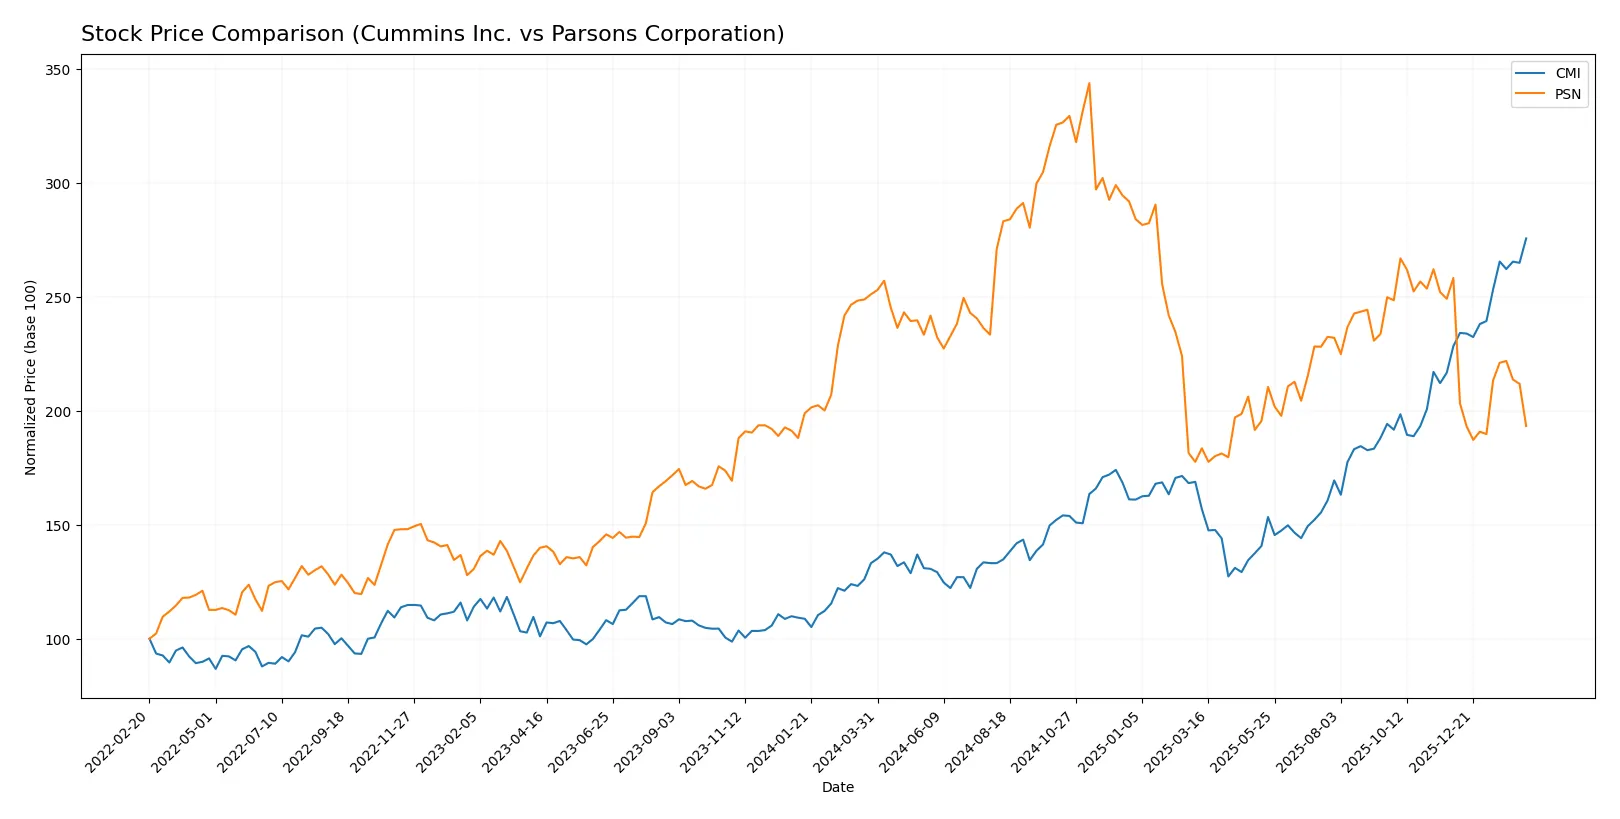
Trend Comparison
Cummins Inc.’s stock price rose 107.0% over the past 12 months, reflecting a strong bullish trend with accelerating momentum and a high volatility level (82.55 std deviation).
Parsons Corporation experienced a 23.0% price decline over the same period, signaling a bearish trend with deceleration and considerably lower volatility (13.2 std deviation).
Cummins outperformed Parsons by a wide margin, delivering the highest market returns with consistent acceleration versus Parsons’ sustained downward trajectory.
Target Prices
Analysts present a solid target consensus for both Cummins Inc. and Parsons Corporation.
| Company | Target Low | Target High | Consensus |
|---|---|---|---|
| Cummins Inc. | 540 | 703 | 618.4 |
| Parsons Corporation | 78 | 104 | 86.8 |
Cummins’ target consensus sits modestly above its current price of 601, indicating moderate upside potential. Parsons shows a more significant gap between price and target, suggesting room for growth.

Don’t Let Luck Decide Your Entry Point
Optimize your entry points with our advanced ProRealTime indicators. You’ll get efficient buy signals with precise price targets for maximum performance. Start outperforming now!
How do institutions grade them?
Cummins Inc. Grades
Here are the recent institutional grades for Cummins Inc. from respected firms:
| Grading Company | Action | New Grade | Date |
|---|---|---|---|
| Raymond James | maintain | Outperform | 2026-02-09 |
| Truist Securities | maintain | Buy | 2026-02-06 |
| Wolfe Research | downgrade | Peer Perform | 2026-01-26 |
| Barclays | maintain | Overweight | 2026-01-23 |
| Wells Fargo | maintain | Overweight | 2026-01-23 |
| JP Morgan | maintain | Neutral | 2026-01-14 |
| Citigroup | maintain | Buy | 2026-01-13 |
| Raymond James | upgrade | Outperform | 2025-12-22 |
| Barclays | upgrade | Overweight | 2025-12-19 |
| Truist Securities | maintain | Buy | 2025-12-18 |
Parsons Corporation Grades
Below are the latest grades from major institutions for Parsons Corporation:
| Grading Company | Action | New Grade | Date |
|---|---|---|---|
| UBS | maintain | Buy | 2026-02-12 |
| Truist Securities | maintain | Buy | 2026-02-12 |
| Keybanc | maintain | Overweight | 2026-02-12 |
| Barclays | maintain | Overweight | 2026-01-23 |
| Keybanc | maintain | Overweight | 2026-01-20 |
| UBS | maintain | Buy | 2026-01-15 |
| Citigroup | maintain | Buy | 2026-01-13 |
| B of A Securities | maintain | Buy | 2025-12-30 |
| Stifel | maintain | Buy | 2025-12-23 |
| Jefferies | maintain | Hold | 2025-12-11 |
Which company has the best grades?
Both companies receive strong grades, but Parsons consistently holds “Buy” and “Overweight” ratings without downgrades. Cummins shows a mix of “Outperform,” “Buy,” and a recent downgrade to “Peer Perform.” Parsons’ steadier positive outlook may signal stronger institutional confidence.
Risks specific to each company
The following categories identify the critical pressure points and systemic threats facing both firms in the 2026 market environment:
1. Market & Competition
Cummins Inc.
- Faces intense competition in industrial machinery, pressured by innovation in electric powertrains.
Parsons Corporation
- Competes in defense and infrastructure, where government contracts and tech advancements dictate market position.
2. Capital Structure & Debt
Cummins Inc.
- Maintains moderate leverage (D/E 0.59) with strong interest coverage (13.05x).
Parsons Corporation
- Similar leverage (D/E 0.52) but weak interest coverage, reflecting potential solvency concerns.
3. Stock Volatility
Cummins Inc.
- Beta of 1.12 indicates moderate volatility, in line with industrial sector norms.
Parsons Corporation
- Beta of 0.67 shows lower volatility, suggesting defensive stock characteristics.
4. Regulatory & Legal
Cummins Inc.
- Subject to stringent emissions and environmental regulations impacting engine production.
Parsons Corporation
- Faces complex compliance in defense contracts and critical infrastructure regulations worldwide.
5. Supply Chain & Operations
Cummins Inc.
- Global supply chain exposed to raw material price swings and logistics disruptions.
Parsons Corporation
- Operations depend on timely government project execution and subcontractor reliability.
6. ESG & Climate Transition
Cummins Inc.
- Transitioning to electrified power systems and hydrogen tech to meet climate goals.
Parsons Corporation
- ESG risks tied to defense sector scrutiny and infrastructure sustainability mandates.
7. Geopolitical Exposure
Cummins Inc.
- Diversified global footprint, but trade tensions can impact manufacturing and sales.
Parsons Corporation
- High exposure to U.S. defense spending and Middle East infrastructure projects vulnerable to geopolitical shifts.
Which company shows a better risk-adjusted profile?
Cummins’ robust capital structure and favorable profitability metrics mitigate its exposure to market and operational risks. Parsons struggles with weaker financial returns and interest coverage, increasing its vulnerability. Cummins’ safer Altman Z-score (4.96) versus Parsons’ marginally safe score (3.05) confirms a stronger risk-adjusted profile. Parsons’ reliance on defense contracts amid geopolitical tensions remains its largest risk, while Cummins faces competitive pressure from the shift to green technologies. Overall, Cummins presents a more balanced risk-return profile for 2026 investors.
Final Verdict: Which stock to choose?
Cummins Inc. (CMI) excels as an industrial powerhouse with a solid value-creation moat. Its ability to generate returns well above its capital cost signals operational strength. However, investors should monitor its declining profitability trend as a point of vigilance. CMI fits best in portfolios seeking steady industrial growth with moderate risk tolerance.
Parsons Corporation (PSN) offers a niche strategic moat rooted in specialized government contracting and recurring project flows. Its financial profile, though weaker than CMI’s, shows better short-term liquidity and lower leverage risks. PSN suits investors focused on speculative, turnaround plays or sector-specific exposure with a high risk appetite.
If you prioritize proven value creation and operational efficiency, Cummins outshines Parsons with stronger profitability and a safer balance sheet. However, if you seek cyclical recovery potential and can tolerate volatility, Parsons offers a distinct strategic niche albeit with significant execution risks. This is a classic choice between industrial resilience and speculative growth.
Disclaimer: Investment carries a risk of loss of initial capital. The past performance is not a reliable indicator of future results. Be sure to understand risks before making an investment decision.
Go Further
I encourage you to read the complete analyses of Cummins Inc. and Parsons Corporation to enhance your investment decisions: