Home > Comparison > Industrials > PH vs CMI
The strategic rivalry between Parker-Hannifin Corporation and Cummins Inc. shapes the Industrials sector’s machinery landscape. Parker-Hannifin operates as a diversified industrial and aerospace systems manufacturer, while Cummins focuses on diesel and natural gas engines alongside electrified powertrains. This comparison highlights a contest between broad industrial solutions and specialized power technologies. This analysis aims to identify which company’s strategic path offers superior risk-adjusted returns for a diversified portfolio in 2026.
Table of contents
Companies Overview
Parker-Hannifin and Cummins dominate key segments of the industrial machinery market with distinct yet overlapping value propositions.
Parker-Hannifin Corporation: Motion and Control Specialist
Parker-Hannifin excels as a leader in motion and control technologies for mobile, industrial, and aerospace markets. Its revenue stems from diversified industrial products and aerospace systems, including hydraulic and pneumatic components, filtration, and thermal management solutions. In 2026, it focuses strategically on expanding OEM partnerships and enhancing product innovation for extreme operating conditions.
Cummins Inc.: Powertrain and Engine Innovator
Cummins Inc. commands the industrial engine sector with a broad portfolio of diesel, natural gas, and electrified powertrains. It generates revenue from engines, components, and power systems spanning heavy-duty trucks to renewable energy solutions. The 2026 strategy emphasizes electrification and emissions technology to capture evolving market demands and regulatory pressures.
Strategic Collision: Similarities & Divergences
Both companies serve industrial machinery OEMs but diverge in business philosophy: Parker-Hannifin targets precision control systems, while Cummins prioritizes powertrain innovation and electrification. The primary battleground lies in powering next-generation machinery with sustainable, efficient solutions. Their investment profiles differ—Parker-Hannifin offers diversified industrial resilience, whereas Cummins presents growth potential through green technology leadership.
Income Statement Comparison
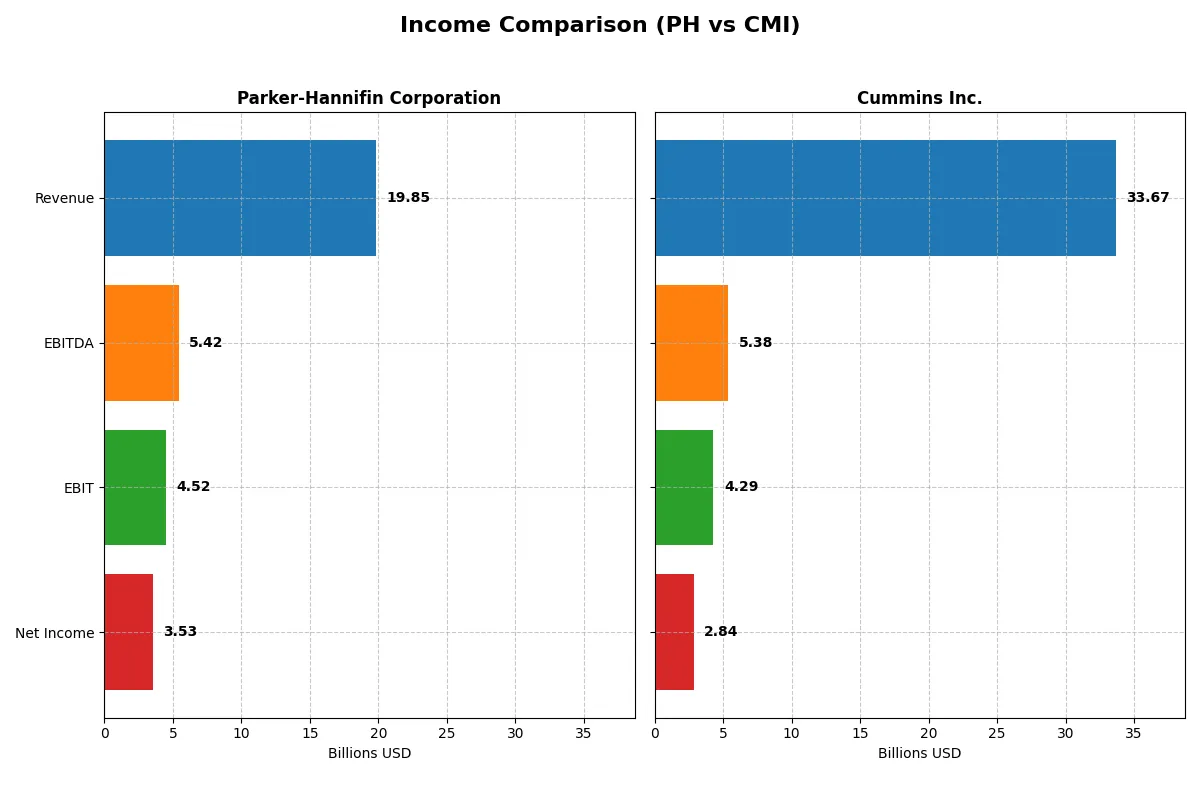
This data dissects the core profitability and scalability of both corporate engines to reveal who dominates the bottom line:
| Metric | Parker-Hannifin Corporation (PH) | Cummins Inc. (CMI) |
|---|---|---|
| Revenue | 19.85B | 33.67B |
| Cost of Revenue | 12.54B | 25.15B |
| Operating Expenses | 3.26B | 4.52B |
| Gross Profit | 7.32B | 8.52B |
| EBITDA | 5.42B | 5.39B |
| EBIT | 4.52B | 4.29B |
| Interest Expense | 409M | 329M |
| Net Income | 3.53B | 2.84B |
| EPS | 27.52 | 20.62 |
| Fiscal Year | 2025 | 2025 |
Income Statement Analysis: The Bottom-Line Duel
The income statement comparison reveals which company operates with superior efficiency and sustained profitability across dynamic market conditions.
Parker-Hannifin Corporation Analysis
Parker-Hannifin sustains a solid revenue base around $19.85B in 2025, with net income surging to $3.53B, reflecting strong profitability momentum. Its gross margin of 36.85% and net margin near 17.8% demonstrate robust margin health. EBIT margin rose by 10.1% year-on-year, emphasizing improved operational efficiency despite a slight 0.4% revenue dip.
Cummins Inc. Analysis
Cummins posted higher revenue at $33.67B in 2025 but net income fell to $2.84B, highlighting margin compression. Gross margin stands at 25.29%, and net margin at 8.44%, both lower than Parker-Hannifin’s, signaling weaker profitability. EBIT declined 18.6% last year, reflecting operational challenges despite a 40.2% revenue growth over five years.
Margin Strength vs. Scale Advantage
Parker-Hannifin leads with superior margins and a sharper net income growth of 102% over five years, signaling disciplined cost control and capital efficiency. Cummins offers scale but struggles with margin contraction and a recent earnings decline. Investors seeking consistent profitability may favor Parker-Hannifin’s efficient earnings profile over Cummins’ revenue scale with margin pressures.
Financial Ratios Comparison
These vital ratios act as a diagnostic tool to expose the underlying fiscal health, valuation premiums, and capital efficiency of the companies compared below:
| Ratios | Parker-Hannifin (PH) | Cummins (CMI) |
|---|---|---|
| ROE | 25.81% | 23.02% |
| ROIC | 13.69% | 12.01% |
| P/E | 25.38 | 24.76 |
| P/B | 6.55 | 5.70 |
| Current Ratio | 1.19 | 1.76 |
| Quick Ratio | 0.71 | 1.16 |
| D/E | 0.70 | 0.59 |
| Debt-to-Assets | 32.7% | 21.3% |
| Interest Coverage | 9.93 | 12.14 |
| Asset Turnover | 0.67 | 0.99 |
| Fixed Asset Turnover | 6.76 | 4.84 |
| Payout Ratio | 24.4% | 37.1% |
| Dividend Yield | 0.96% | 1.50% |
| Fiscal Year | 2025 | 2025 |
Efficiency & Valuation Duel: The Vital Signs
Ratios serve as a company’s DNA, exposing hidden risks and operational strengths that numbers alone cannot reveal.
Parker-Hannifin Corporation
Parker-Hannifin delivers strong profitability with a 25.8% ROE and a 17.8% net margin, indicating operational excellence. However, its valuation appears stretched with a P/E of 25.4 and P/B of 6.55. The company returns value modestly via a 0.96% dividend yield, favoring reinvestment in R&D to fuel growth.
Cummins Inc.
Cummins shows efficient capital use with a 23.0% ROE and solid 8.4% net margin, though margins lag Parker-Hannifin’s. Its valuation is more balanced at a 24.8 P/E and a slightly lower P/B of 5.7. Cummins maintains shareholder returns with a 1.5% dividend yield and invests considerably in R&D to support innovation.
Valuation Stretch vs. Operational Efficiency
Parker-Hannifin commands a premium valuation justified by higher profitability but carries valuation risk. Cummins offers a more balanced risk-reward profile with solid returns and a healthier liquidity position. Investors seeking growth with operational efficiency may lean toward Parker-Hannifin; those prioritizing stability and value might prefer Cummins.
Which one offers the Superior Shareholder Reward?
I compare Parker-Hannifin (PH) and Cummins (CMI) on dividends, buybacks, and sustainability. PH yields ~0.96% with a 24% payout ratio and strong free cash flow (FCF) coverage, signaling reliable dividends. CMI offers a higher yield near 1.5%, but with a lower FCF coverage and a more conservative payout ratio around 25–37%. PH’s buyback activity is steady, complementing dividends for total shareholder return. CMI’s buybacks appear less intense but support value alongside dividends. PH’s distribution model balances yield and buybacks with solid FCF, making it more sustainable long-term. I find PH offers a superior total return profile in 2026, blending income and capital appreciation prudently.
Comparative Score Analysis: The Strategic Profile
The radar chart reveals the fundamental DNA and trade-offs of Parker-Hannifin Corporation and Cummins Inc., highlighting their financial strengths and weaknesses:
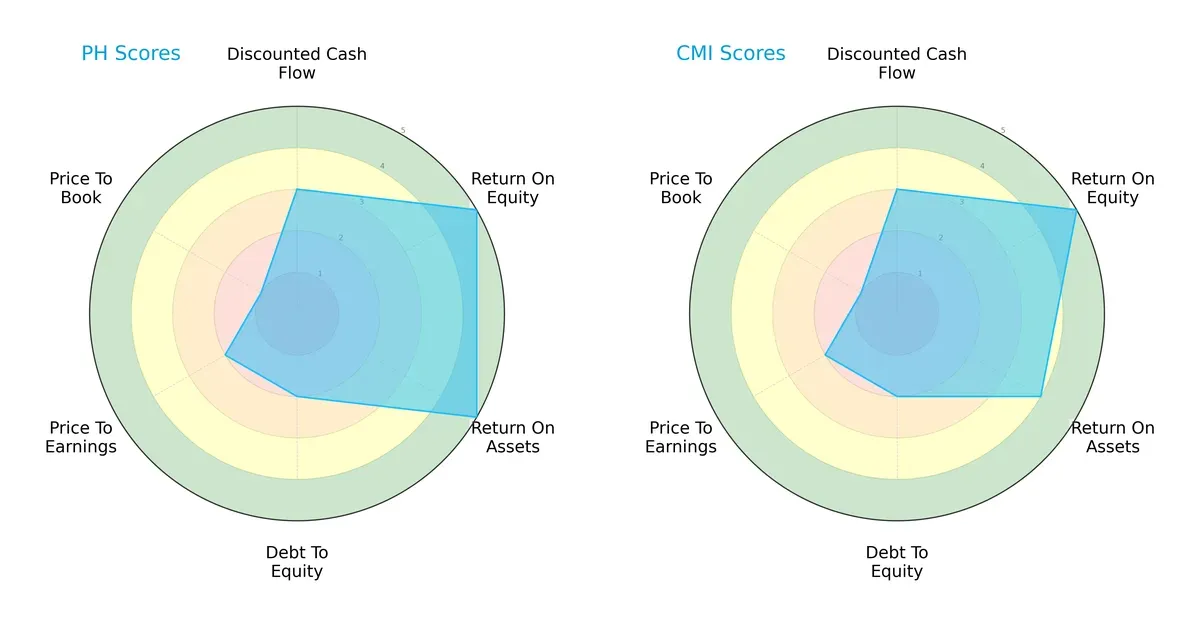
Parker-Hannifin and Cummins both score equally on overall and DCF metrics, indicating similar valuation and cash flow projections. Parker-Hannifin edges out with a slightly higher ROA (5 vs. 4), showing superior asset efficiency. Both firms share weak marks on debt-to-equity and valuation scores, signaling financial leverage risks and potential overvaluation. Parker-Hannifin’s profile is more polarized, with strong profitability but poor valuation, while Cummins presents a slightly more balanced operational efficiency.
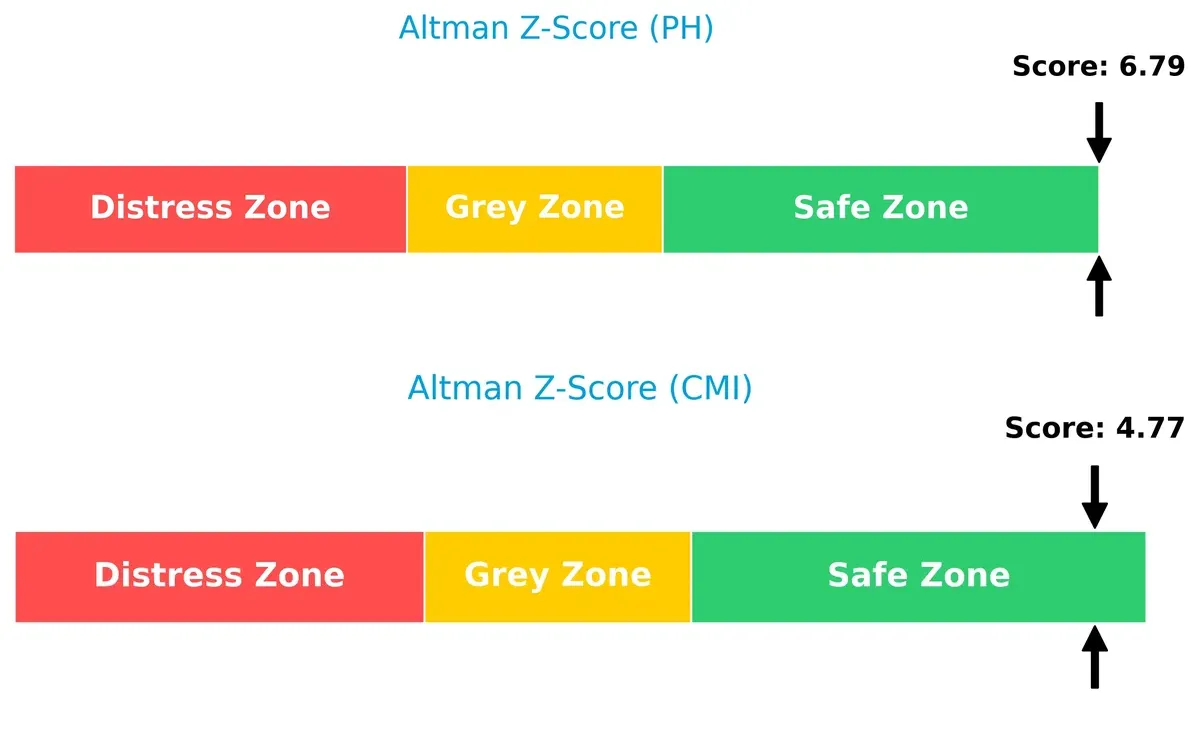
Bankruptcy Risk: Solvency Showdown
Parker-Hannifin’s Altman Z-Score of 6.79 significantly surpasses Cummins’ 4.77, placing both safely above distress thresholds but highlighting Parker-Hannifin’s stronger long-term solvency in this cycle:
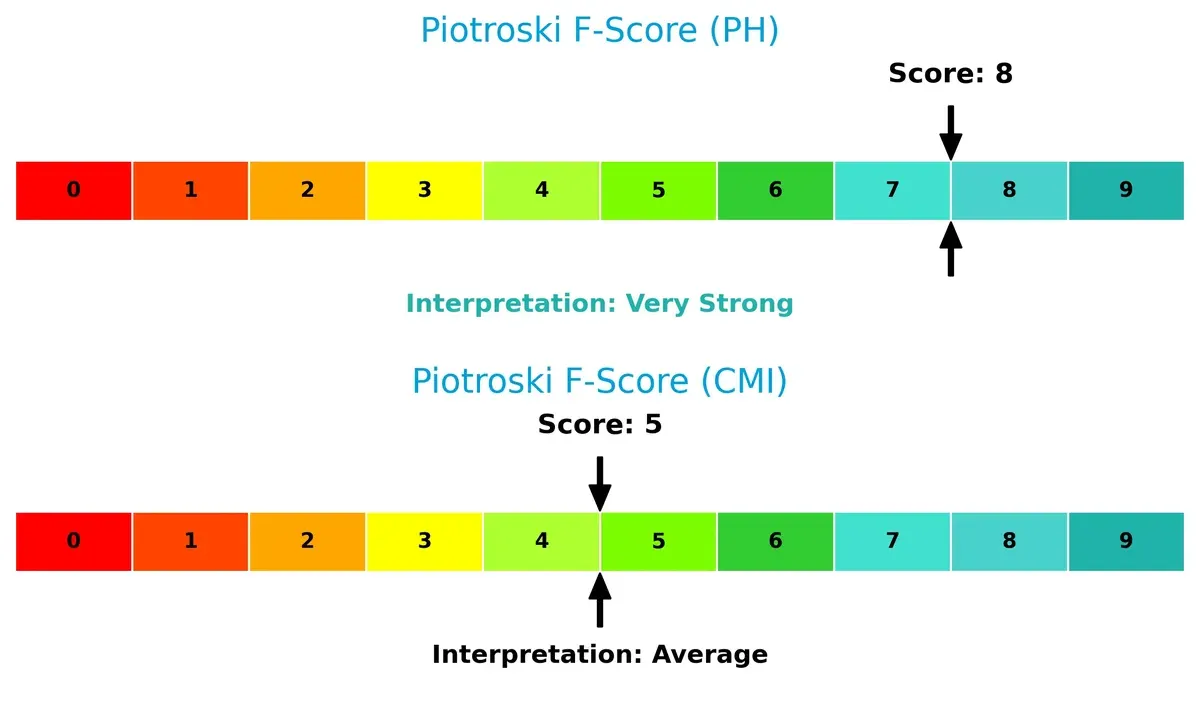
Financial Health: Quality of Operations
Parker-Hannifin’s Piotroski F-Score of 8 indicates very strong financial health versus Cummins’ moderate score of 5, revealing Parker-Hannifin’s superior internal metrics and fewer red flags:
How are the two companies positioned?
This section dissects PH and CMI’s operational DNA by comparing their revenue distribution and internal dynamics—strengths and weaknesses. The goal is to confront their economic moats and identify which business model delivers the most resilient competitive advantage today.
Revenue Segmentation: The Strategic Mix
The following visual comparison dissects how Parker-Hannifin and Cummins diversify their income streams and reveals where their primary sector bets lie:
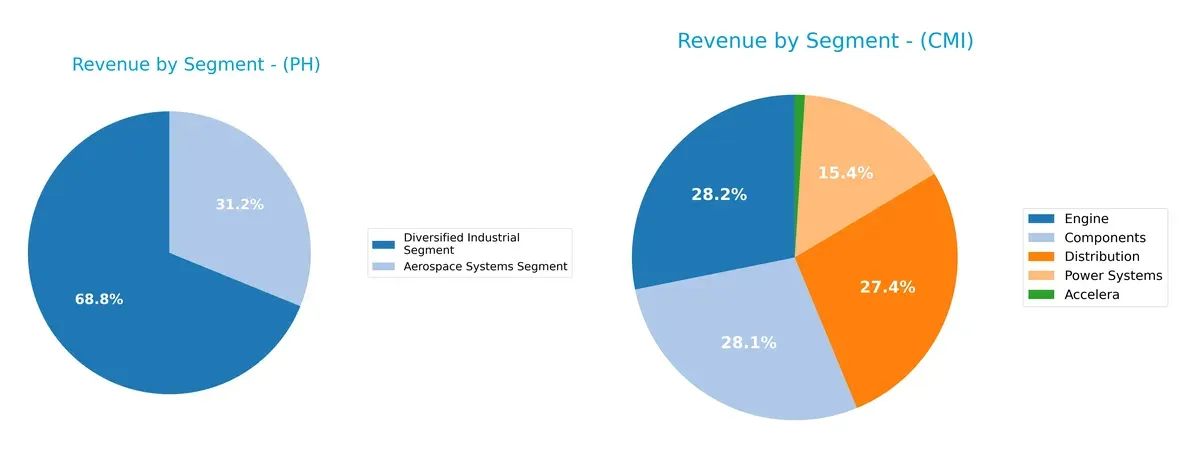
Parker-Hannifin anchors its revenue in the Diversified Industrial Segment with $13.7B in 2025, complemented by $6.2B from Aerospace Systems. This mix shows moderate diversification but leans heavily on industrial markets. Cummins displays a broader spread, with Engines ($11.7B), Components ($11.7B), and Distribution ($11.4B) segments nearly equal, signaling a balanced portfolio. Parker’s focus suggests infrastructure dominance, while Cummins mitigates risk through segment balance and ecosystem lock-in.
Strengths and Weaknesses Comparison
This table compares the strengths and weaknesses of Parker-Hannifin Corporation (PH) and Cummins Inc. (CMI):
PH Strengths
- Diverse revenue from Aerospace and Diversified Industrial segments
- Strong profitability with 17.79% net margin and 25.81% ROE
- Favorable interest coverage at 11.04
- Solid fixed asset turnover at 6.76
- Significant North American and European presence
CMI Strengths
- Balanced revenue across Components, Distribution, Engine, and Power Systems
- Favorable ROE at 23.02% and ROIC at 12.01%
- Strong liquidity with current ratio 1.76 and quick ratio 1.16
- Lower debt-to-assets at 21.3%
- Robust interest coverage at 13.05
- Large US and growing China and India markets
PH Weaknesses
- High P/E at 25.38 and P/B at 6.55, both unfavorable
- Quick ratio weak at 0.71, indicating liquidity risk
- Moderate current ratio at 1.19
- Dividend yield low at 0.96%
- Debt-to-assets moderately high at 32.68%
- Asset turnover neutral at 0.67
CMI Weaknesses
- Negative total segment reported for 2024, signaling operational challenges
- P/B unfavorable at 5.7 despite favorable P/E
- Neutral net margin at 8.44%
- Neutral dividend yield at 1.5%
- Asset turnover neutral at 0.99
Both companies show slightly favorable financial ratios but differ in liquidity and valuation metrics. PH’s profitability leads, but liquidity and valuation raise caution. CMI offers stronger liquidity and global diversification but faces operational losses and margin pressure. These factors will influence their strategic focus on efficiency and market positioning.
The Moat Duel: Analyzing Competitive Defensibility
A structural moat is the only shield protecting long-term profits from relentless competitive erosion. Here’s how these two industrial giants compare:
Parker-Hannifin Corporation: Diversified Industrial Expertise with Margin Stability
Parker-Hannifin’s moat stems from its broad product portfolio and advanced motion control technologies. It boasts a robust ROIC exceeding WACC by 4.5%, sustaining margin expansion and strong profitability. New aerospace and industrial applications in 2026 could deepen this moat further.
Cummins Inc.: Powertrain Innovation with Narrowing Profit Margins
Cummins relies on powertrain engineering and emission technology as its moat, creating value with a positive ROIC over WACC by 3.4%. However, declining ROIC trends and compressing EBIT margins signal emerging competitive pressures. Their electrification push offers potential but faces stiff disruption risks.
Margin Command vs. Innovation Edge: Which Moat Holds Stronger?
Parker-Hannifin’s wider and growing moat outpaces Cummins’ narrower, shrinking competitive advantage. Its consistent value creation and margin resilience make it better equipped to defend market share in 2026’s volatile industrial landscape.
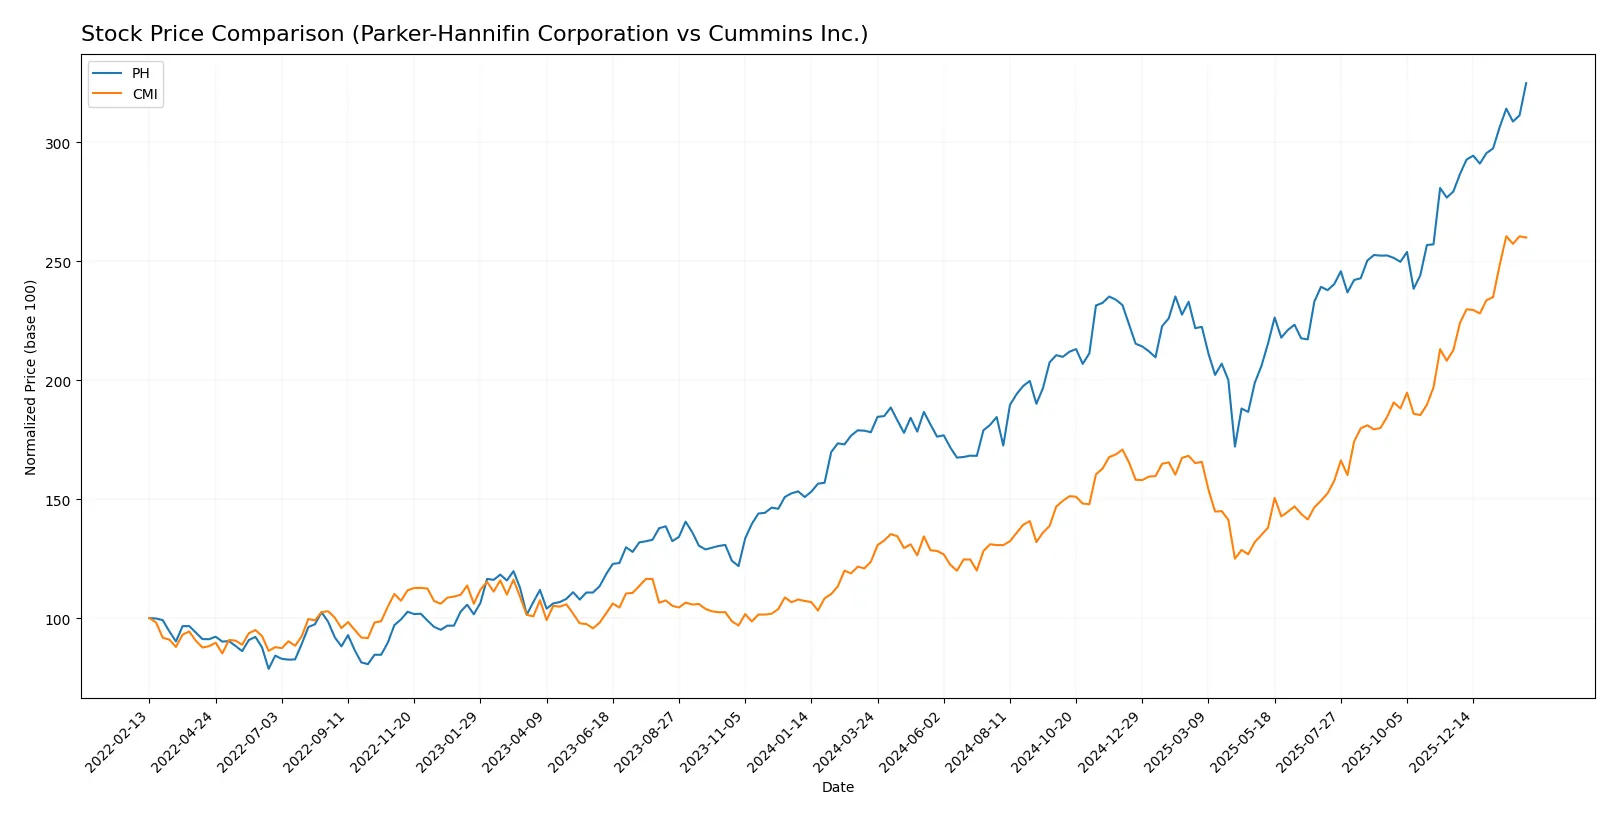
Which stock offers better returns?
Over the past year, both Parker-Hannifin and Cummins experienced strong price appreciation, with distinct acceleration patterns and differing volume dynamics shaping their trading performance.
Trend Comparison
Parker-Hannifin’s stock rose 82.38% over the last 12 months, showing a bullish trend with accelerating momentum and a high volatility level of 115.92. Recent gains reached 16.31%, confirming sustained strength.
Cummins’s stock increased 110.21% in the same period, also bullish and accelerating, with lower volatility at 79.49. Its recent 22.27% growth indicates continued robust upward momentum.
Cummins outperformed Parker-Hannifin in total price gains, delivering the highest market return over the year despite both stocks showing strong bullish trends with acceleration.
Target Prices
Analysts present a confident target price consensus for Parker-Hannifin Corporation and Cummins Inc.
| Company | Target Low | Target High | Consensus |
|---|---|---|---|
| Parker-Hannifin Corporation | 825 | 1,139 | 995.46 |
| Cummins Inc. | 540 | 703 | 606.1 |
The target consensus for Parker-Hannifin sits slightly above its current price of 976.49, signaling modest upside potential. Cummins’ consensus target is notably above its 577.73 price, reflecting stronger analyst optimism.

Don’t Let Luck Decide Your Entry Point
Optimize your entry points with our advanced ProRealTime indicators. You’ll get efficient buy signals with precise price targets for maximum performance. Start outperforming now!
How do institutions grade them?
This section compares the latest institutional grades assigned to Parker-Hannifin Corporation and Cummins Inc.:
Parker-Hannifin Corporation Grades
Below is the table summarizing recent grades from reputable institutions for Parker-Hannifin Corporation.
| Grading Company | Action | New Grade | Date |
|---|---|---|---|
| Stifel | Maintain | Hold | 2026-01-30 |
| JP Morgan | Maintain | Overweight | 2026-01-30 |
| Wells Fargo | Maintain | Overweight | 2026-01-30 |
| Barclays | Maintain | Overweight | 2026-01-30 |
| Citigroup | Maintain | Buy | 2026-01-30 |
| Jefferies | Maintain | Buy | 2026-01-30 |
| Stifel | Maintain | Hold | 2026-01-23 |
| JP Morgan | Maintain | Overweight | 2026-01-16 |
| Morgan Stanley | Maintain | Equal Weight | 2026-01-14 |
| Keybanc | Maintain | Overweight | 2026-01-07 |
Cummins Inc. Grades
Below is the table summarizing recent grades from reputable institutions for Cummins Inc.
| Grading Company | Action | New Grade | Date |
|---|---|---|---|
| Truist Securities | Maintain | Buy | 2026-02-06 |
| Wolfe Research | Downgrade | Peer Perform | 2026-01-26 |
| Barclays | Maintain | Overweight | 2026-01-23 |
| Wells Fargo | Maintain | Overweight | 2026-01-23 |
| JP Morgan | Maintain | Neutral | 2026-01-14 |
| Citigroup | Maintain | Buy | 2026-01-13 |
| Raymond James | Upgrade | Outperform | 2025-12-22 |
| Barclays | Upgrade | Overweight | 2025-12-19 |
| Truist Securities | Maintain | Buy | 2025-12-18 |
| Citigroup | Maintain | Buy | 2025-12-11 |
Which company has the best grades?
Parker-Hannifin holds predominantly Buy and Overweight ratings, reflecting strong institutional confidence. Cummins shows a mixed picture, with recent downgrades offset by upgrades and Buy ratings. Investors may weigh these nuanced grade distributions to assess relative market sentiment and risk.
Risks specific to each company
The following categories identify critical pressure points and systemic threats facing Parker-Hannifin and Cummins in the 2026 market environment:
1. Market & Competition
Parker-Hannifin Corporation
- Faces intense competition in diversified industrial and aerospace sectors with exposure to OEM demand cyclicality.
Cummins Inc.
- Competes in diesel, natural gas, and electrified powertrains markets amid accelerating EV adoption and regulatory shifts.
2. Capital Structure & Debt
Parker-Hannifin Corporation
- Moderate leverage with debt-to-assets at 32.7%, interest coverage strong at 11.0x; debt-to-equity neutral risk.
Cummins Inc.
- Lower leverage at 21.3% debt-to-assets, interest coverage higher at 13.0x, reflecting a stronger balance sheet.
3. Stock Volatility
Parker-Hannifin Corporation
- Higher beta at 1.24 suggests greater sensitivity to market swings and cyclical risks.
Cummins Inc.
- Slightly lower beta of 1.12 indicates more stable stock behavior amid market volatility.
4. Regulatory & Legal
Parker-Hannifin Corporation
- Aerospace regulations and export controls pose compliance risks; environmental standards impact industrial products.
Cummins Inc.
- Faces stringent emissions regulations; must navigate evolving clean energy policies impacting powertrain design.
5. Supply Chain & Operations
Parker-Hannifin Corporation
- Supply chain exposed to raw material price volatility and aerospace production delays.
Cummins Inc.
- Supply chain risks include semiconductor shortages and raw material costs amid global demand fluctuations.
6. ESG & Climate Transition
Parker-Hannifin Corporation
- ESG efforts focus on efficiency and emissions reduction; transition risks moderate in aerospace and industrial segments.
Cummins Inc.
- Aggressively investing in electrification and hydrogen technologies; climate transition integral to long-term strategy.
7. Geopolitical Exposure
Parker-Hannifin Corporation
- Global footprint exposes it to trade tensions and tariff risks, especially in aerospace markets.
Cummins Inc.
- Geopolitical risks stem from global supply chains and export restrictions on powertrain technologies.
Which company shows a better risk-adjusted profile?
Cummins faces its largest risk from accelerating regulatory and technology shifts in powertrain electrification, demanding rapid innovation. Parker-Hannifin’s critical risk lies in aerospace market cyclicality and supply chain disruptions. Cummins displays a stronger balance sheet and lower leverage, supporting resilience. Its higher current and quick ratios confirm superior liquidity. Meanwhile, Parker-Hannifin’s higher beta signals greater stock volatility. The recent surge in Cummins’ stock price (+6.9%) versus Parker-Hannifin’s modest gain (+0.9%) underscores market confidence in Cummins’ transition strategy. Thus, Cummins presents a better risk-adjusted profile in 2026.
Final Verdict: Which stock to choose?
Parker-Hannifin Corporation’s superpower lies in its robust value creation and steadily growing profitability, driven by a very favorable moat and efficient capital allocation. Its point of vigilance is a stretched valuation relative to fundamentals. It suits an aggressive growth portfolio willing to pay for quality and momentum.
Cummins Inc. stands out with a durable strategic moat anchored in strong balance sheet health and operational safety. It offers better liquidity and lower leverage than Parker-Hannifin, appealing to investors who prioritize financial stability. Cummins fits well within a GARP (Growth at a Reasonable Price) portfolio seeking steady growth with less risk.
If you prioritize dynamic value creation and accelerating earnings, Parker-Hannifin outshines due to its expanding ROIC and superior profitability trends. However, if you seek better stability and a more conservative risk profile, Cummins offers a safer harbor with its solid liquidity and lower indebtedness. Both present slightly favorable prospects, but your choice hinges on risk tolerance and growth preference.
Disclaimer: Investment carries a risk of loss of initial capital. The past performance is not a reliable indicator of future results. Be sure to understand risks before making an investment decision.
Go Further
I encourage you to read the complete analyses of Parker-Hannifin Corporation and Cummins Inc. to enhance your investment decisions: