Home > Comparison > Industrials > CMI vs NDSN
The strategic rivalry between Cummins Inc. and Nordson Corporation shapes the industrial machinery sector’s evolution. Cummins operates as a capital-intensive giant, designing and manufacturing powertrain systems worldwide. In contrast, Nordson specializes in precision dispensing and coating technologies, offering high-margin, niche solutions. This analysis pits Cummins’ broad industrial scale against Nordson’s focused innovation, seeking to identify which trajectory delivers the superior risk-adjusted return for diversified portfolios.

Table of contents
Companies Overview
Cummins Inc. and Nordson Corporation stand as significant players in the industrial machinery sector, shaping global manufacturing standards.
Cummins Inc.: Global Powertrain Innovator
Cummins Inc. dominates as a designer and manufacturer of diesel and natural gas engines. Its core revenue stems from engines, power systems, and aftermarket parts servicing multiple heavy-duty markets. In 2026, Cummins focuses strategically on electrified power systems, including fuel cells and hydrogen technologies, reinforcing its competitive edge in sustainable power solutions.
Nordson Corporation: Precision Dispensing Specialist
Nordson Corporation specializes in engineered systems for adhesive and coating applications across industrial and medical sectors. Its revenue engine centers on dispensing and coating technologies through two segments: Industrial Precision Solutions and Advanced Technology Solutions. In 2026, Nordson prioritizes automated fluid dispensing and surface treatment innovations to enhance precision manufacturing capabilities.
Strategic Collision: Similarities & Divergences
Both companies operate in industrial machinery but pursue distinct philosophies: Cummins invests heavily in powertrain electrification, while Nordson drives precision fluid application technology. Their primary battleground lies in serving diverse manufacturing industries requiring specialized machinery. Cummins presents a broad-based power solutions profile; Nordson offers niche, high-precision systems—each appealing to different investor appetites for scale versus specialization.
Income Statement Comparison
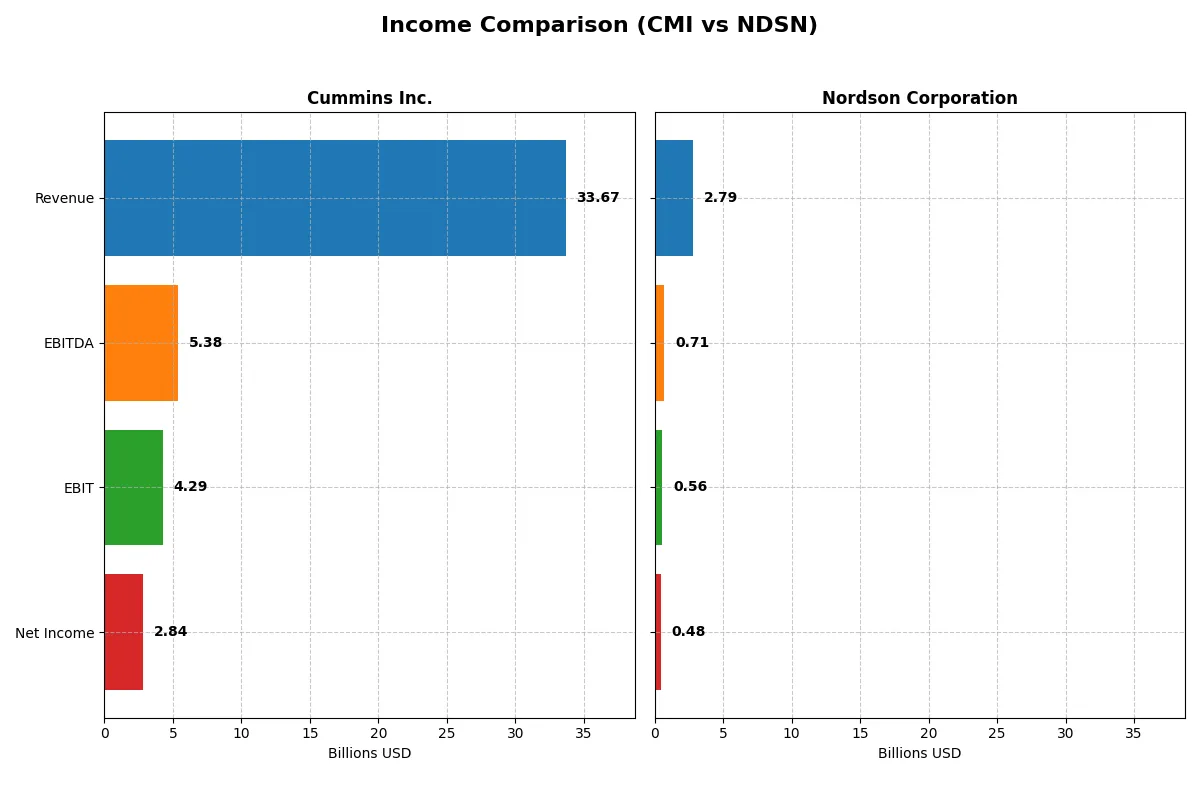
This data dissects the core profitability and scalability of both corporate engines to reveal who dominates the bottom line:
| Metric | Cummins Inc. (CMI) | Nordson Corporation (NDSN) |
|---|---|---|
| Revenue | 33.7B | 2.79B |
| Cost of Revenue | 25.2B | 1.25B |
| Operating Expenses | 4.52B | 828M |
| Gross Profit | 8.52B | 1.54B |
| EBITDA | 5.39B | 712M |
| EBIT | 4.29B | 561M |
| Interest Expense | 329M | 101M |
| Net Income | 2.84B | 484M |
| EPS | 20.62 | 8.56 |
| Fiscal Year | 2025 | 2025 |
Income Statement Analysis: The Bottom-Line Duel
This income statement comparison reveals which company operates more efficiently, spotlighting their ability to convert revenue into profit consistently.
Cummins Inc. Analysis
Cummins’ revenue grew 40% from 2021 to 2025, peaking near $34B before a slight dip to $33.7B in 2025. Net income expanded 33%, though it retreated 28% last year to $2.84B. Gross margin steadied around 25%, signaling consistent cost control. Despite recent margin pressure, the company maintains favorable profitability metrics and strong operational momentum.
Nordson Corporation Analysis
Nordson steadily increased revenue by 18% over five years, reaching $2.79B in 2025. Net income rose 7% overall, with a modest 3.6% margin contraction last year, settling at $484M. Gross margin exceeds 55%, reflecting superior cost efficiency relative to peers. EBIT margin at 20% supports robust bottom-line health, though recent EBIT decline indicates some operational headwinds.
Margin Power vs. Revenue Scale
Cummins commands scale with $33B revenue but shows margin compression and net income retreat in 2025. Nordson’s smaller $2.8B top line delivers stronger profit margins and better cost efficiency. Fundamentally, Cummins leads on absolute profit growth, while Nordson excels in profitability ratios. Investors seeking scale may favor Cummins; those valuing margin strength may prefer Nordson’s leaner profile.
Financial Ratios Comparison
These vital ratios act as a diagnostic tool to expose the underlying fiscal health, valuation premiums, and capital efficiency of the companies compared:
| Ratios | Cummins Inc. (CMI) | Nordson Corporation (NDSN) |
|---|---|---|
| ROE | 23.0% | 15.9% |
| ROIC | 12.0% | 10.5% |
| P/E | 24.8 | 27.1 |
| P/B | 5.7 | 4.3 |
| Current Ratio | 1.76 | 1.64 |
| Quick Ratio | 1.16 | 1.05 |
| D/E (Debt-to-Equity) | 0.59 | 0.69 |
| Debt-to-Assets | 21.3% | 35.4% |
| Interest Coverage | 12.1x | 7.0x |
| Asset Turnover | 0.99 | 0.47 |
| Fixed Asset Turnover | 4.84 | 4.70 |
| Payout ratio | 37.1% | 37.0% |
| Dividend yield | 1.50% | 1.36% |
| Fiscal Year | 2025 | 2025 |
Efficiency & Valuation Duel: The Vital Signs
Financial ratios act as the company’s DNA, exposing hidden risks and signs of operational excellence investors must decode carefully.
Cummins Inc.
Cummins posts a strong 23% ROE and solid 8.44% net margin, signaling efficient profitability. Its P/E of 24.76 suggests a fairly valued stock, yet a high PB of 5.7 flags potential overvaluation. The 1.5% dividend yield complements a strategy balancing shareholder returns with steady reinvestment in R&D and growth.
Nordson Corporation
Nordson delivers a robust 17.35% net margin and a respectable 15.9% ROE, showcasing operational strength. However, its P/E of 27.1 indicates a stretched valuation. The company yields 1.36% in dividends, while reinvesting modestly in R&D. Its lower asset turnover of 0.47 warns of less efficient capital use compared to peers.
Balanced Profitability vs. Premium Valuation
Cummins offers a better blend of profitability and valuation metrics with a slightly favorable risk profile. Nordson’s higher margins come at a premium price, increasing risk. Investors seeking operational efficiency may prefer Cummins, while those chasing growth at a cost might lean toward Nordson.
Which one offers the Superior Shareholder Reward?
I compare Cummins Inc. (CMI) and Nordson Corporation (NDSN) focusing on their distribution strategies in 2025. CMI yields 1.5% with a 37% payout ratio and funds dividends plus buybacks from solid free cash flow of 17.3/share. NDSN yields 1.36% with a lighter 37% payout but directs more cash to buybacks, supported by free cash flow of 11.7/share. I observe that CMI’s higher dividend yield paired with consistent buybacks offers a more balanced, sustainable model. NDSN’s lower payout and intense buybacks favor growth but risk yield stability. For 2026 investors, I favor CMI for superior total return potential through reliable income and prudent capital allocation.
Comparative Score Analysis: The Strategic Profile
The radar chart reveals the fundamental DNA and trade-offs of Cummins Inc. and Nordson Corporation, highlighting their financial strengths and valuation nuances:
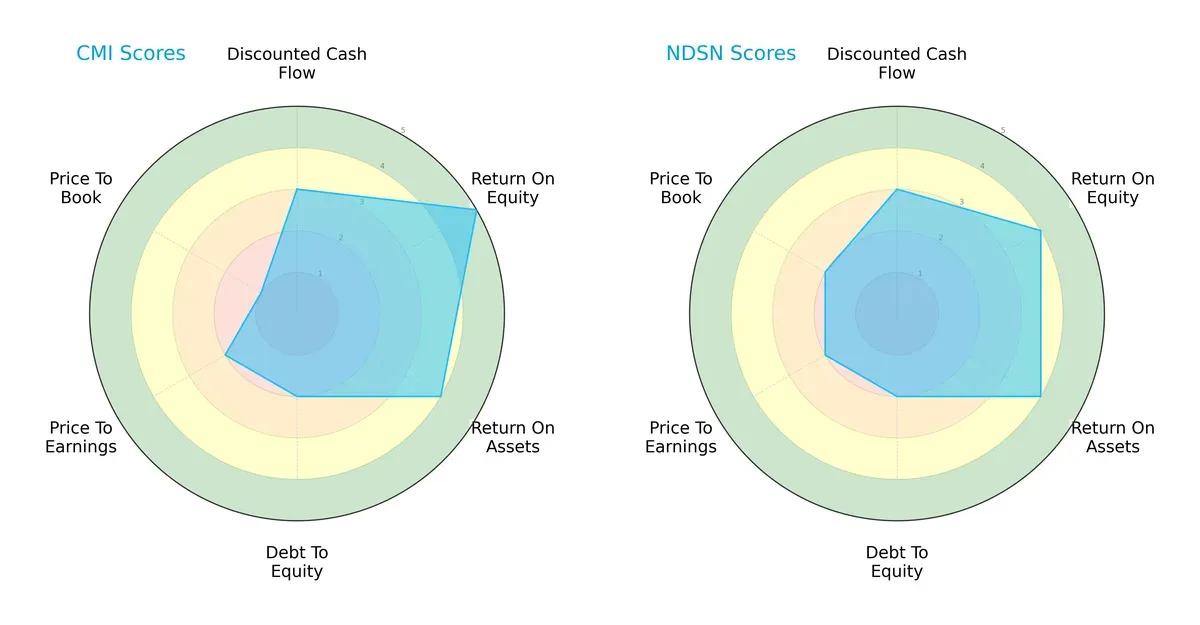
Cummins scores higher on return on equity (5 vs. 4) and return on assets (4 vs. 4), showing strong profitability and asset efficiency. Nordson matches on discounted cash flow (3 vs. 3) but edges Cummins slightly in price-to-book valuation (2 vs. 1), indicating a marginally better market pricing. Both firms share a weaker debt-to-equity score (2), signaling elevated leverage risks. Overall, Cummins presents a more profit-centric profile, while Nordson offers a more balanced valuation approach.
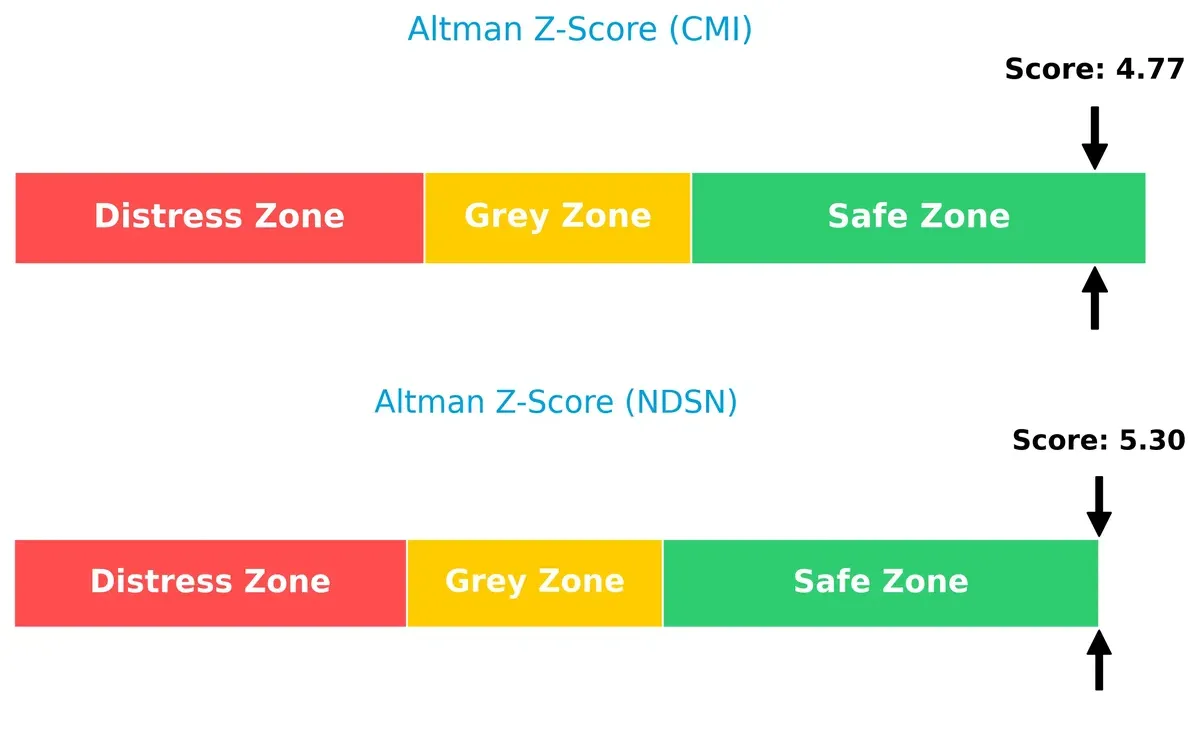
Bankruptcy Risk: Solvency Showdown
Cummins and Nordson both reside comfortably in the Altman Z-score safe zone, with Nordson holding a slight edge (5.3 vs. 4.8), signaling stronger long-term solvency and lower bankruptcy risk in this cycle:
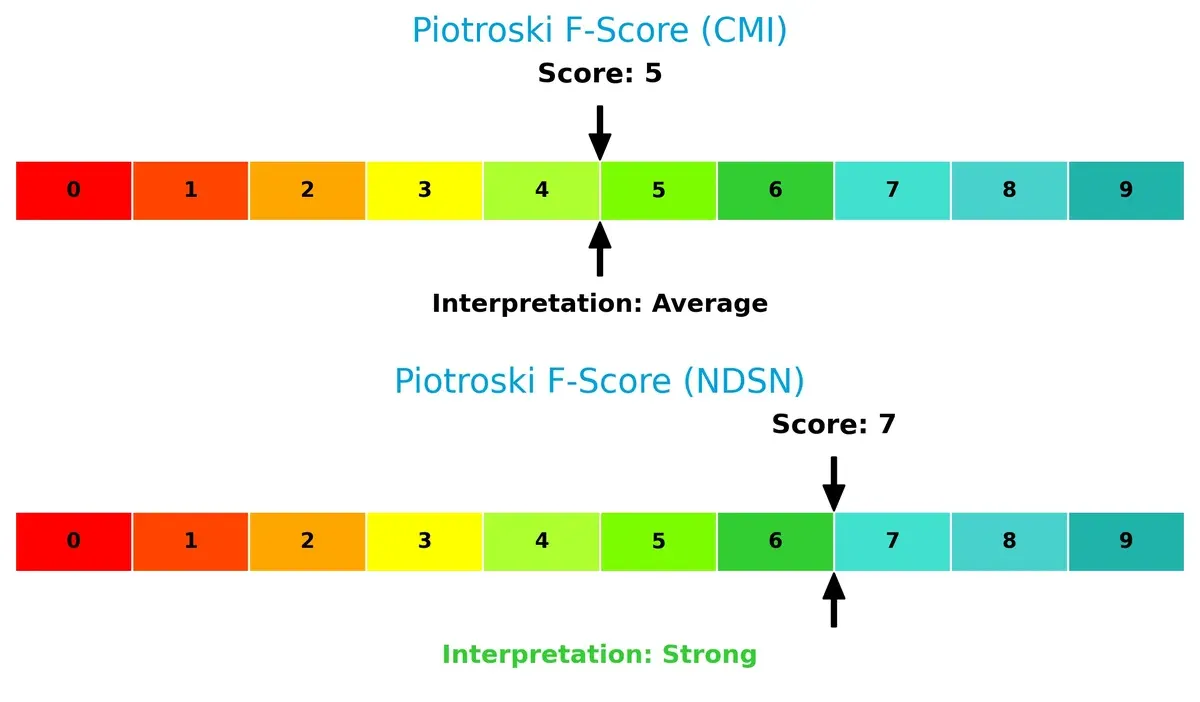
Financial Health: Quality of Operations
Nordson’s Piotroski F-Score of 7 surpasses Cummins’ 5, indicating superior operational quality and internal financial health. Cummins’ lower score raises caution about some internal inefficiencies or emerging red flags:
How are the two companies positioned?
This section dissects the operational DNA of Cummins and Nordson by comparing their revenue distribution and internal strengths and weaknesses. The goal is to confront their economic moats to identify which model offers the most resilient competitive advantage today.
Revenue Segmentation: The Strategic Mix
This visual comparison dissects how Cummins Inc. and Nordson Corporation diversify their income streams and reveals where their primary sector bets lie:
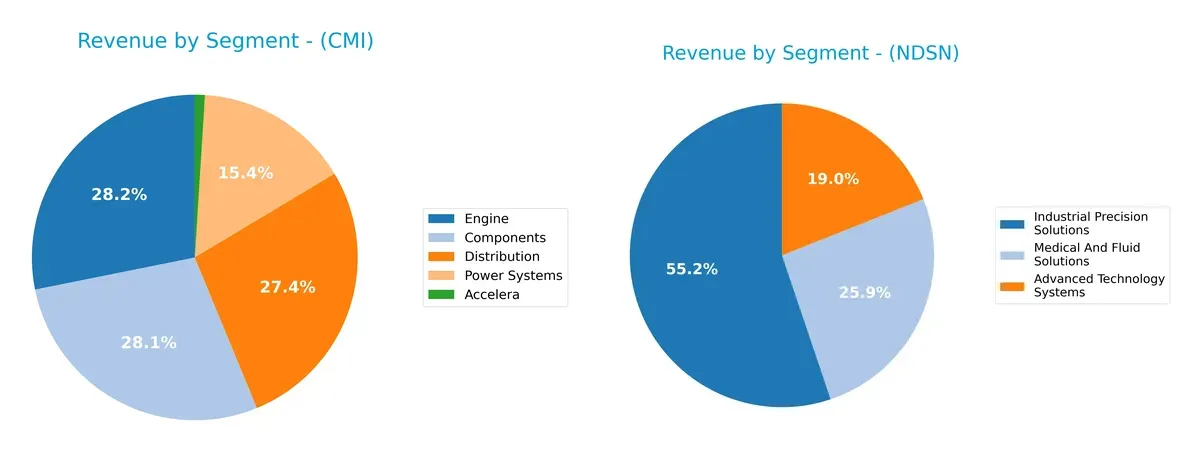
Cummins Inc. anchors its revenue in Engine ($11.7B), Components ($11.7B), and Distribution ($11.4B), showing a balanced industrial mix. Nordson leans on Industrial Precision Solutions ($1.48B) but also generates significant revenue from Medical and Fluid Solutions ($695M) and Advanced Technology Systems ($510M). Cummins’ broad industrial footprint signals ecosystem lock-in, while Nordson’s narrower focus presents concentration risk despite niche tech leadership.
Strengths and Weaknesses Comparison
This table compares the strengths and weaknesses of Cummins Inc. (CMI) and Nordson Corporation (NDSN):
CMI Strengths
- Diverse revenue streams across Components, Distribution, Engine, Power Systems
- Strong profitability with 23.02% ROE and 12.01% ROIC above WACC
- Robust liquidity with current ratio 1.76 and quick ratio 1.16
- Favorable interest coverage at 13.05 indicates good debt service ability
- Significant global presence with high US and Non-US sales, including China and India
NDSN Strengths
- High net margin at 17.35% signals strong profitability
- Favorable ROE at 15.92% and ROIC at 10.49% with WACC below ROIC
- Consistent liquidity with current ratio 1.64 and quick ratio 1.05
- Balanced geographic exposure across Americas, Asia Pacific, and Europe
- Innovation focus through Advanced Technology Systems and Medical Solutions segments
CMI Weaknesses
- Elevated price-to-book ratio at 5.7 may imply overvaluation risk
- Neutral net margin at 8.44% lags NDSN’s profitability
- Moderate debt-to-equity at 0.59 limits leverage flexibility
- Asset turnover at 0.99 is average, suggesting room for efficiency gains
NDSN Weaknesses
- Unfavorable asset turnover at 0.47 points to lower operational efficiency
- Higher debt-to-assets ratio at 35.36% increases financial risk
- Elevated P/E at 27.1 and P/B at 4.31 may pressure valuation
- Lower interest coverage ratio at 5.55 compared to CMI
Overall, CMI demonstrates strong profitability and liquidity supported by diversified segments and global reach but faces valuation concerns. NDSN excels in margins and innovation across diverse geographies but shows weaker asset efficiency and higher leverage. These contrasts highlight differing strategic focuses and financial profiles in their respective markets.
The Moat Duel: Analyzing Competitive Defensibility
A structural moat is the only reliable shield protecting long-term profits from relentless competitive erosion in industrial machinery sectors:
Cummins Inc.: Durable Engineering and Aftermarket Network
Cummins leverages a cost advantage with its integrated engine and power systems, reflected in steady 12.75% EBIT margins. Its broad aftermarket and service network support margin stability, though a slight ROIC decline warns of margin pressure in evolving powertrain technologies by 2026.
Nordson Corporation: Precision Solutions with High Margin Moat
Nordson’s intangible assets and proprietary dispensing technologies generate a wide moat, evidenced by a robust 20.1% EBIT margin and 55% gross margin. Despite a sharper ROIC drop, its focus on specialized markets and innovation positions it well for niche expansion and disruption.
Moat Strength Showdown: Cost Leadership vs. Technological Precision
Both firms create value with ROIC above WACC, but Cummins offers a wider moat via scale and aftermarket reach. Nordson’s deeper margin profile signals higher pricing power but with more concentrated risk. Cummins appears better equipped to defend broad market share amid industrial shifts.
Which stock offers better returns?
The past year shows strong gains for both stocks, with Cummins Inc. exhibiting a sharp upward acceleration and Nordson Corporation maintaining steady bullish momentum.
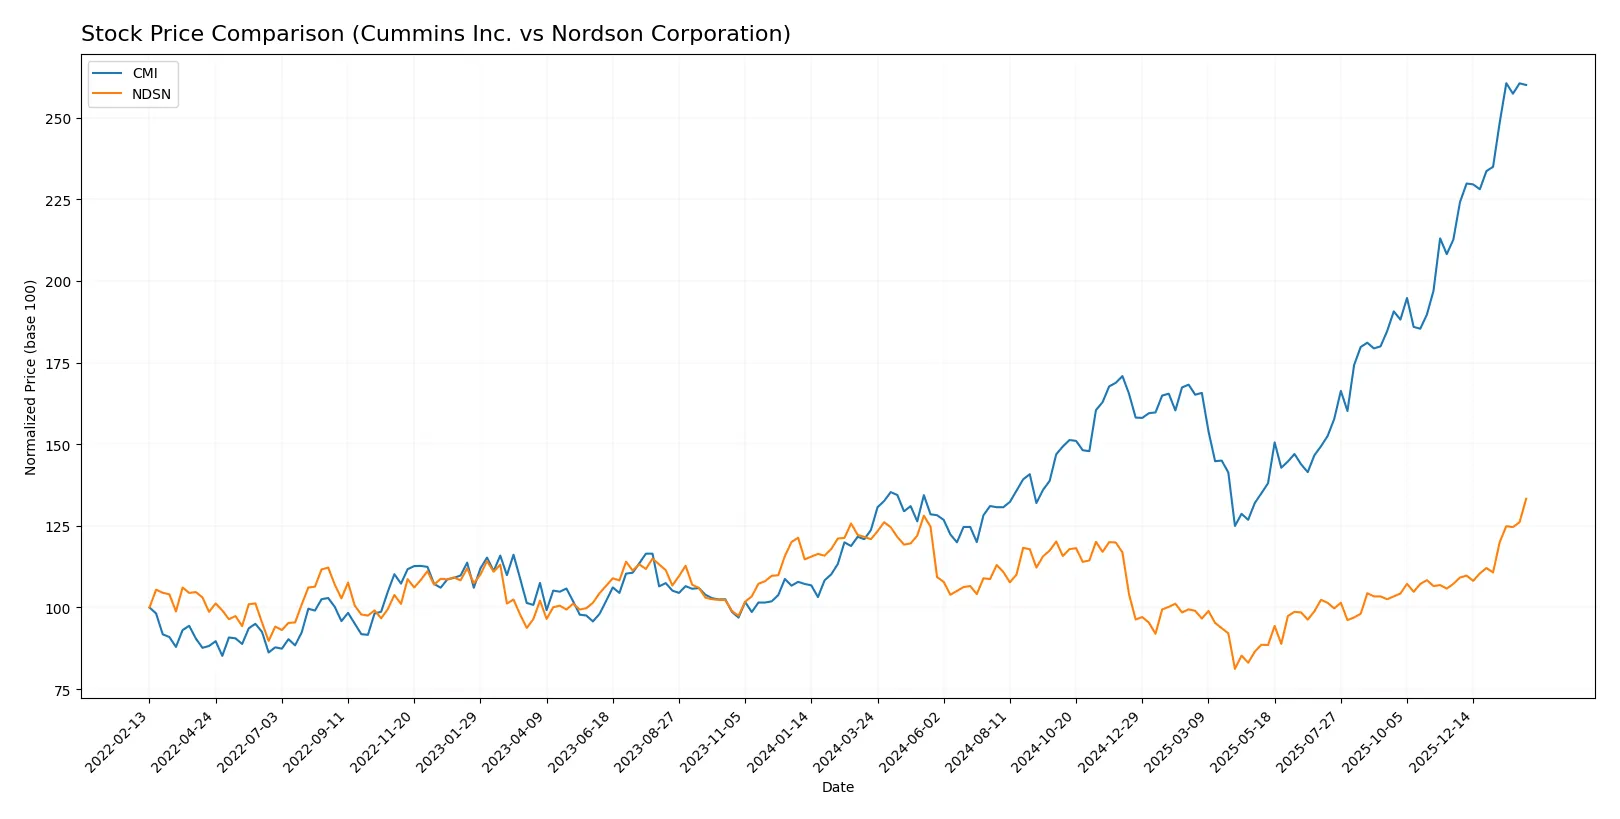
Trend Comparison
Cummins Inc. surged 110.21% over the past year, displaying a bullish trend with accelerating gains. Its volatility is high, with a standard deviation of 79.49, hitting a peak near 579.
Nordson Corporation gained 10.25% over the same period, following a bullish trend with acceleration. Its volatility is moderate at 24.13, with a highest price of 290.18 during the year.
Cummins Inc. outperformed Nordson Corporation significantly, delivering the highest market return and stronger price acceleration over the past year.
Target Prices
Analysts present a moderately bullish consensus for Cummins Inc. and Nordson Corporation.
| Company | Target Low | Target High | Consensus |
|---|---|---|---|
| Cummins Inc. | 540 | 703 | 606.1 |
| Nordson Corp. | 240 | 295 | 274.17 |
Cummins’ consensus target at 606.1 exceeds its current price of 577.73, signaling upside potential. Nordson’s target consensus at 274.17 sits slightly below its current price of 290.18, indicating a cautious outlook from analysts.

Don’t Let Luck Decide Your Entry Point
Optimize your entry points with our advanced ProRealTime indicators. You’ll get efficient buy signals with precise price targets for maximum performance. Start outperforming now!
How do institutions grade them?
Cummins Inc. Grades
The following table summarizes recent grades assigned to Cummins Inc. by reputable firms:
| Grading Company | Action | New Grade | Date |
|---|---|---|---|
| Truist Securities | Maintain | Buy | 2026-02-06 |
| Wolfe Research | Downgrade | Peer Perform | 2026-01-26 |
| Barclays | Maintain | Overweight | 2026-01-23 |
| Wells Fargo | Maintain | Overweight | 2026-01-23 |
| JP Morgan | Maintain | Neutral | 2026-01-14 |
| Citigroup | Maintain | Buy | 2026-01-13 |
| Raymond James | Upgrade | Outperform | 2025-12-22 |
| Barclays | Upgrade | Overweight | 2025-12-19 |
| Truist Securities | Maintain | Buy | 2025-12-18 |
| Citigroup | Maintain | Buy | 2025-12-11 |
Nordson Corporation Grades
Below are the latest grades assigned to Nordson Corporation by recognized grading firms:
| Grading Company | Action | New Grade | Date |
|---|---|---|---|
| DA Davidson | Maintain | Buy | 2025-12-12 |
| Baird | Maintain | Neutral | 2025-12-12 |
| DA Davidson | Maintain | Buy | 2025-12-11 |
| Keybanc | Maintain | Overweight | 2025-12-11 |
| Oppenheimer | Maintain | Outperform | 2025-08-25 |
| Baird | Maintain | Neutral | 2025-08-22 |
| Keybanc | Maintain | Overweight | 2025-07-15 |
| Oppenheimer | Upgrade | Outperform | 2025-05-30 |
| Baird | Maintain | Neutral | 2025-05-30 |
| Keybanc | Maintain | Overweight | 2025-04-08 |
Which company has the best grades?
Cummins Inc. exhibits a broader range of grades, including multiple “Buy” and “Overweight” ratings, with some recent downgrades. Nordson Corporation maintains consistent “Buy,” “Outperform,” and “Overweight” grades without downgrades. This steadiness could appeal to investors seeking stable institutional confidence.
Risks specific to each company
The following categories identify critical pressure points and systemic threats facing both Cummins Inc. and Nordson Corporation in the 2026 market environment:
1. Market & Competition
Cummins Inc.
- Faces intense competition in heavy-duty engine and powertrain markets with pressure from electrification trends.
Nordson Corporation
- Competes in specialized dispensing and coating systems with innovation demands and industrial automation pressures.
2. Capital Structure & Debt
Cummins Inc.
- Maintains moderate leverage (D/E 0.59), favorable interest coverage (13.05x), showing solid debt management.
Nordson Corporation
- Slightly higher leverage (D/E 0.69) and lower interest coverage (5.55x) increase financial risk moderately.
3. Stock Volatility
Cummins Inc.
- Beta at 1.12 suggests moderate sensitivity to market swings, typical for industrial machinery sector.
Nordson Corporation
- Beta near 1.00 indicates average volatility, reflecting steady but less aggressive market moves.
4. Regulatory & Legal
Cummins Inc.
- Subject to stringent emissions regulations impacting product design and costs globally.
Nordson Corporation
- Faces regulatory scrutiny on product safety and environmental compliance in manufacturing processes.
5. Supply Chain & Operations
Cummins Inc.
- Global supply chain complexity for engines and components exposes it to raw material price and logistics risks.
Nordson Corporation
- Relies on precise manufacturing inputs and technology supply, vulnerable to semiconductor and specialty material shortages.
6. ESG & Climate Transition
Cummins Inc.
- Heavy focus on electrification and emission solutions positions it well but requires heavy R&D investments.
Nordson Corporation
- ESG efforts focus on sustainable manufacturing and product innovation in fluid dispensing, with moderate capital intensity.
7. Geopolitical Exposure
Cummins Inc.
- Global footprint exposes it to trade tensions and tariffs, especially in China and Europe.
Nordson Corporation
- More US-centric sales and manufacturing reduce geopolitical risk but limit global diversification.
Which company shows a better risk-adjusted profile?
Cummins faces its greatest risk from regulatory and supply chain pressures tied to its global scale and heavy capital demands. Nordson’s most impactful risk is its higher leverage combined with operational dependencies on specialized materials. Nordson’s stronger Altman Z-score (5.3 vs. 4.8) and higher Piotroski score (7 vs. 5) indicate superior financial health and resilience. However, Cummins’ superior interest coverage and scale provide a robust buffer. I judge Nordson to have a slightly better risk-adjusted profile given its financial stability and lower market volatility, despite its operational niche risks.
Final Verdict: Which stock to choose?
Cummins Inc. (CMI) excels as a powerhouse of operational efficiency and robust capital returns. Its ability to generate consistent value above its cost of capital highlights disciplined capital allocation. However, a point of vigilance remains its declining profitability trend and stretched valuation metrics. CMI suits investors with an appetite for aggressive growth seeking industrial resilience.
Nordson Corporation (NDSN) boasts a strategic moat through its high-margin, recurring revenue model and superior income quality. It offers comparatively steadier profitability, though at a premium valuation and with a notable debt load. NDSN fits well in portfolios favoring growth at a reasonable price (GARP) and income stability.
If you prioritize operational efficiency and value creation in cyclical industries, Cummins outshines due to its superior ROIC and strong cash flow generation. However, if you seek a safer growth profile with high margins and recurring revenues, Nordson offers better stability despite its higher leverage. Both present compelling but distinct analytical scenarios for different investor profiles.
Disclaimer: Investment carries a risk of loss of initial capital. The past performance is not a reliable indicator of future results. Be sure to understand risks before making an investment decision.
Go Further
I encourage you to read the complete analyses of Cummins Inc. and Nordson Corporation to enhance your investment decisions: