Home > Comparison > Industrials > CMI vs NNE
The strategic rivalry between Cummins Inc. and Nano Nuclear Energy Inc. shapes the future of industrial machinery innovation. Cummins operates as a diversified, capital-intensive powerhouse in diesel and hybrid powertrains. In contrast, Nano Nuclear Energy pioneers cutting-edge microreactor technology with a lean startup model. This analysis pits established industrial strength against agile technological disruption to determine which path offers superior risk-adjusted returns for a diversified portfolio.
Table of contents
Companies Overview
Cummins Inc. and Nano Nuclear Energy Inc. stand at the forefront of innovation in industrial machinery with distinct market impacts.
Cummins Inc.: Industrial Powerhouse with Diverse Energy Solutions
Cummins Inc. dominates the diesel and natural gas engine market, generating revenue through its five operating segments focused on engines, components, and power systems. Its core business includes manufacturing engines for heavy-duty trucks, construction, and marine applications. In 2026, Cummins emphasizes electrification and hydrogen technologies, evolving its portfolio toward sustainable powertrains and emissions solutions.
Nano Nuclear Energy Inc.: Emerging Microreactor Innovator
Nano Nuclear Energy Inc. pioneers in microreactor technology, developing solid-core and low-pressure coolant reactors. Its business model revolves around creating advanced nuclear power sources like ZEUS and ODIN, alongside fuel fabrication and nuclear consulting. In 2026, the company focuses on commercializing these reactors and expanding its nuclear fuel supply chain to support a clean energy transition.
Strategic Collision: Similarities & Divergences
Both companies operate in industrial machinery but diverge sharply in technology and scale. Cummins invests in diversified power solutions, balancing legacy engines with clean alternatives. Nano Nuclear Energy pursues a niche, cutting-edge nuclear microreactor market. Their primary battleground lies in clean energy innovation, yet Cummins offers established scale and cash flow, while Nano Nuclear carries high growth potential tempered by developmental risk.
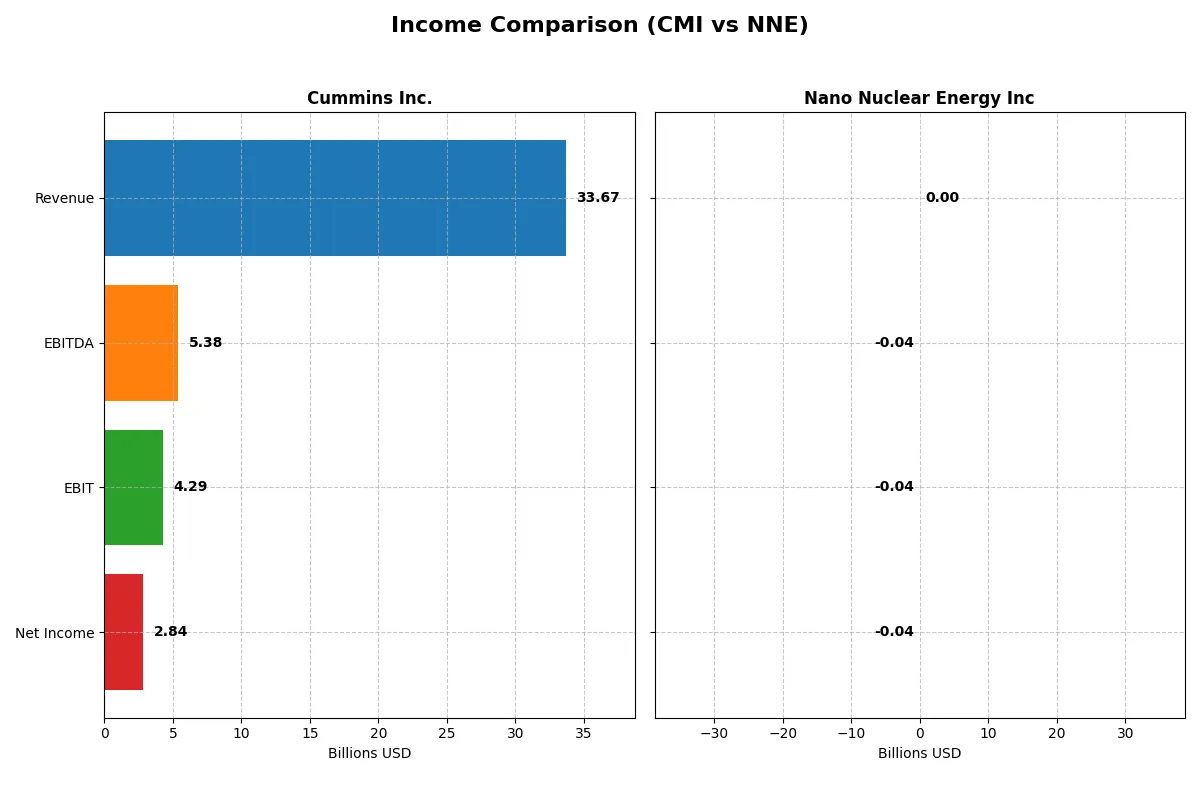
Income Statement Comparison
This table dissects the core profitability and scalability of both corporate engines to reveal who dominates the bottom line:
| Metric | Cummins Inc. (CMI) | Nano Nuclear Energy Inc (NNE) |
|---|---|---|
| Revenue | 33.67B | 0 |
| Cost of Revenue | 25.15B | 651K |
| Operating Expenses | 4.52B | 44.36M |
| Gross Profit | 8.52B | -651K |
| EBITDA | 5.39B | -39.42M |
| EBIT | 4.29B | -40.07M |
| Interest Expense | 329M | 0 |
| Net Income | 2.84B | -40.07M |
| EPS | 20.62 | -1.06 |
| Fiscal Year | 2025 | 2025 |
Income Statement Analysis: The Bottom-Line Duel
This income statement comparison reveals which company runs a more efficient and profitable corporate engine over recent years.
Cummins Inc. Analysis
Cummins shows steady revenue growth from $24B in 2021 to $34B in 2024, slipping slightly to $33.7B in 2025. Net income surged from $2.13B in 2021 to $3.95B in 2024, then eased to $2.84B in 2025. Gross margins remain healthy above 25%, while net margins held around 8.4%, reflecting solid operational efficiency despite a 1.3% revenue dip in 2025.
Nano Nuclear Energy Inc Analysis
Nano Nuclear reports no revenue from 2022 through 2025, operating at a loss each year. Net losses deepened from $1M in 2022 to $40M in 2025. Gross and net margins are negative or zero, indicating no operational profit. Interest income offers minimal relief, but the company’s income statement reflects continued cash burn without revenue traction.
Margin Strength vs. Revenue Scale
Cummins dominates with strong revenue scale and consistent profitability, boasting favorable margins and solid earnings growth over five years. Nano Nuclear struggles with zero revenue and widening losses, lacking a clear path to profitability. Investors seeking established, margin-strong businesses will find Cummins’ profile far more attractive for portfolio stability.
Financial Ratios Comparison
These vital ratios act as a diagnostic tool to expose the underlying fiscal health, valuation premiums, and capital efficiency of the companies compared below:
| Ratios | Cummins Inc. (CMI) | Nano Nuclear Energy Inc (NNE) |
|---|---|---|
| ROE | 23.0% | -0.02% |
| ROIC | 12.0% | -0.02% |
| P/E | 24.8 | -36.5 |
| P/B | 5.7 | 0.007 |
| Current Ratio | 1.76 | 53.5 |
| Quick Ratio | 1.16 | 53.5 |
| D/E | 0.59 | 0.013 |
| Debt-to-Assets | 21.3% | 1.2% |
| Interest Coverage | 12.1 | 0 |
| Asset Turnover | 0.99 | 0 |
| Fixed Asset Turnover | 4.84 | 0 |
| Payout ratio | 37.1% | 0 |
| Dividend yield | 1.50% | 0 |
| Fiscal Year | 2025 | 2025 |
Efficiency & Valuation Duel: The Vital Signs
Ratios act as a company’s DNA, exposing hidden risks and highlighting operational excellence essential for investment decisions.
Cummins Inc.
Cummins delivers strong profitability with a 23% ROE and 8.44% net margin, signaling operational efficiency. Its P/E of 24.76 suggests a fairly priced stock, though a high P/B of 5.7 signals valuation caution. The company returns value via a 1.5% dividend yield, balancing shareholder payouts with steady reinvestment in R&D and growth.
Nano Nuclear Energy Inc
Nano Nuclear Energy struggles with negative returns and zero net margin, flagging operational challenges. Despite a low P/B of 0.01 indicating a cheap valuation, its negative ROE and ROIC highlight fundamental weaknesses. The firm pays no dividends, reflecting reinvestment struggles amid high leverage and unfavorable coverage ratios, revealing elevated financial risk.
Balanced Strength vs. Troubled Cheapness
Cummins presents a healthier blend of profitability and valuation with favorable returns and steady dividends. Nano Nuclear Energy’s cheap multiples mask operational losses and financial instability. Investors seeking stability and operational safety may prefer Cummins, while those targeting speculative turnaround plays might consider Nano Nuclear Energy’s riskier profile.
Which one offers the Superior Shareholder Reward?
I compare Cummins Inc. (CMI) and Nano Nuclear Energy Inc. (NNE) on dividends, buybacks, and reinvestment strategies. CMI offers a 1.5%–2.7% dividend yield with payout ratios around 25%–40%, backed by strong free cash flow (FCF) coverage above 65%. It sustains shareholder returns with consistent buybacks, leveraging operating cash flow efficiently. Conversely, NNE pays no dividends, incurs negative free cash flow (-740M), and invests heavily in R&D and capex (223M per share), aiming for growth over immediate returns. NNE’s current ratio exceeds 15, signaling deep cash reserves but no profit generation yet. I find CMI’s balanced dividend and buyback model more sustainable and attractive for total return in 2026. NNE remains a high-risk, speculative growth play without shareholder distributions.
Comparative Score Analysis: The Strategic Profile
The radar chart reveals the fundamental DNA and trade-offs of Cummins Inc. and Nano Nuclear Energy Inc., highlighting their core financial strengths and weaknesses:
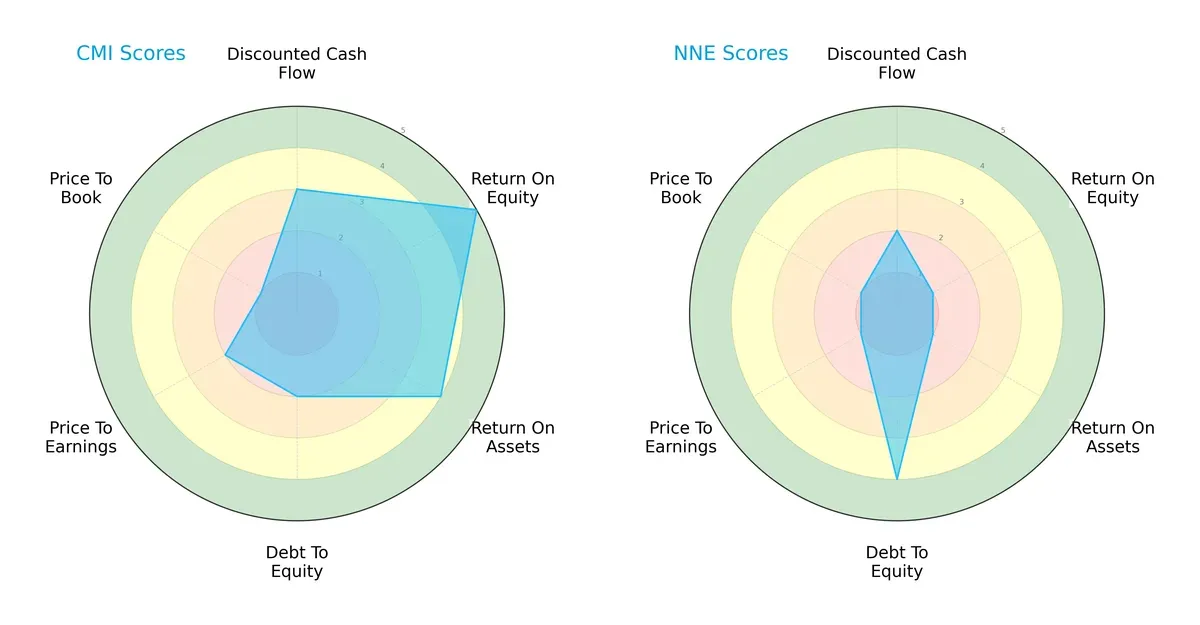
Cummins Inc. shows clear strengths in profitability with high ROE (5) and ROA (4) scores. However, it carries a heavier debt burden, reflected in a weak debt-to-equity score (2) and stretched valuation metrics (PE at 2, PB at 1). Nano Nuclear Energy Inc. leverages a conservative balance sheet with a strong debt-to-equity score (4), but suffers from poor profitability (ROE and ROA scores at 1) and undervaluation signs (PE and PB at 1). Cummins presents a more balanced profile driven by operational efficiency, while Nano Nuclear depends heavily on financial prudence amid weak earnings.
Bankruptcy Risk: Solvency Showdown
The Altman Z-Scores place both firms firmly in the safe zone, but with a stark difference:
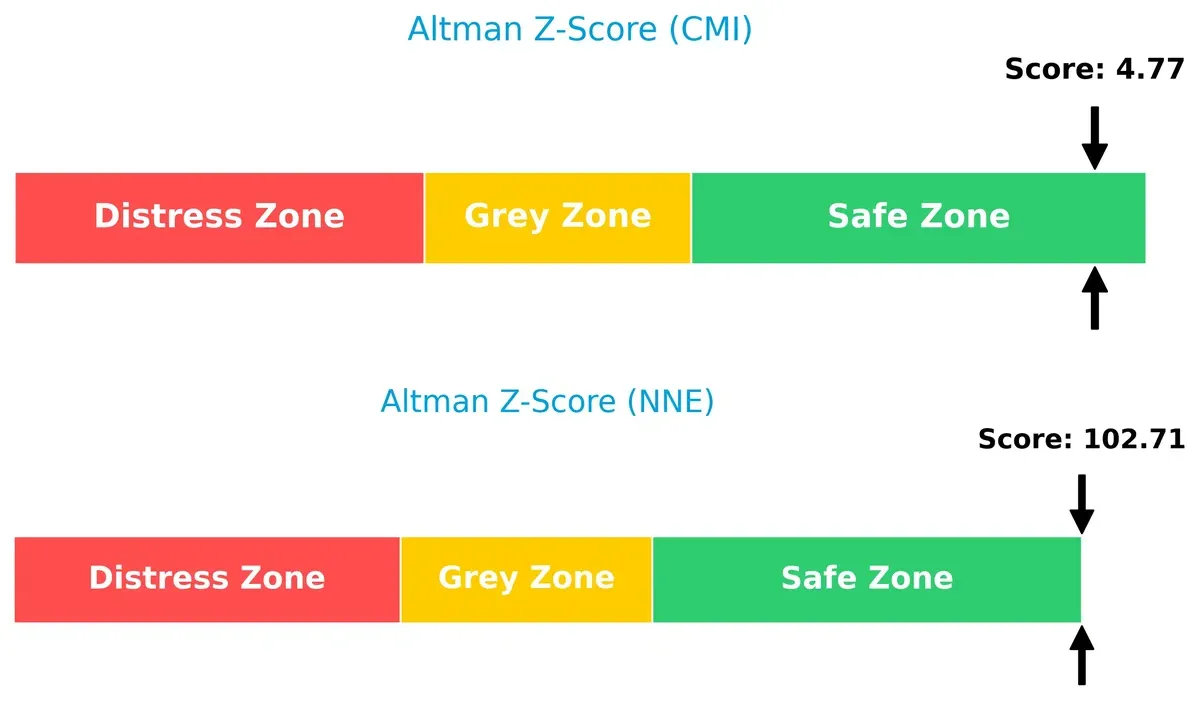
Nano Nuclear Energy’s extremely high Z-Score (103) signals robust solvency and negligible bankruptcy risk. Cummins’ score (4.77) also indicates solid financial health but with more typical risk exposure for its industry. This suggests Nano Nuclear’s conservative capital structure offers superior long-term survival potential in volatile cycles.
Financial Health: Quality of Operations
Piotroski F-Scores highlight a sharp contrast in operational quality and financial strength:
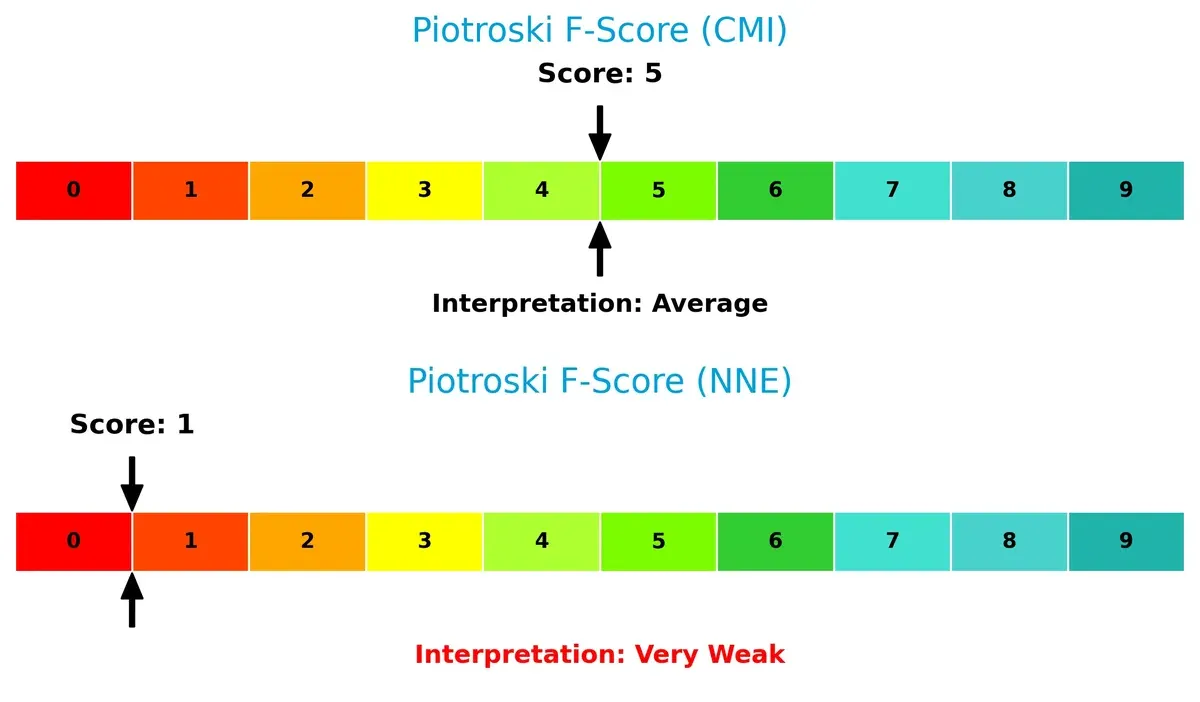
Cummins scores a respectable 5, indicating average but stable financial health. Nano Nuclear’s score of 1 signals serious red flags in profitability, liquidity, or efficiency metrics. From my experience, this suggests Cummins maintains a more resilient internal financial structure, while Nano Nuclear faces significant operational challenges that investors must weigh carefully.
How are the two companies positioned?
This section dissects the operational DNA of Cummins and Nano Nuclear by comparing their revenue distribution and internal strengths and weaknesses. The goal is to confront their economic moats and reveal which business model delivers the most resilient competitive advantage today.
Revenue Segmentation: The Strategic Mix
The following comparison dissects how Cummins Inc. and Nano Nuclear Energy Inc. diversify their income streams and where their primary sector bets lie:
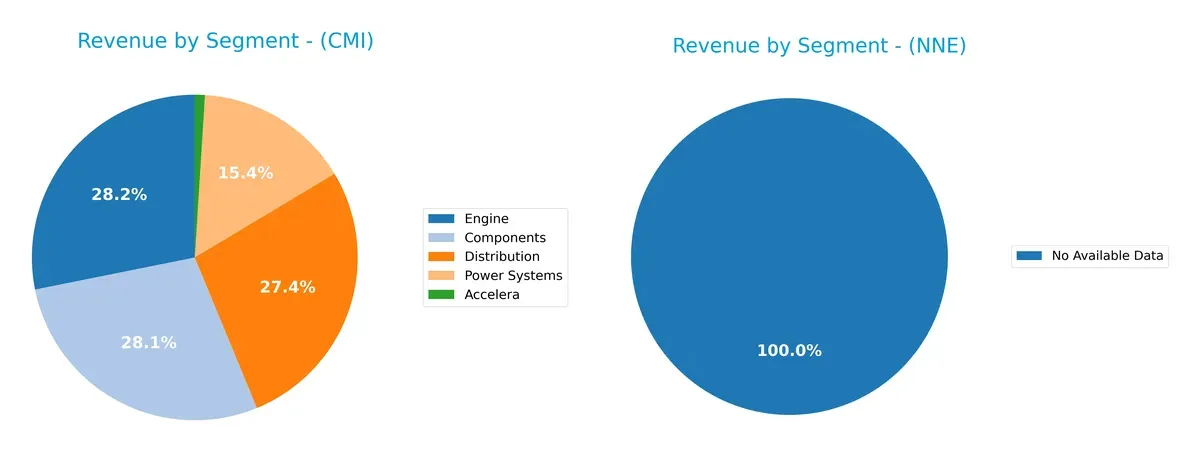
Cummins Inc. reveals a balanced revenue mix across Components ($11.7B), Distribution ($11.4B), and Engine ($11.7B), each anchoring roughly equal weight. This diversification reduces concentration risk and supports ecosystem lock-in through integrated powertrain solutions. Nano Nuclear Energy Inc. lacks available segment data, preventing meaningful comparison. Cummins’ strategy pivots on infrastructure dominance in power systems, while the absence of NNE’s data raises transparency concerns for investors.
Strengths and Weaknesses Comparison
This table compares the strengths and weaknesses of Cummins Inc. and Nano Nuclear Energy Inc. based on diversification, profitability, financials, innovation, global presence, and market share:
Cummins Inc. Strengths
- Diverse revenue streams across engines, components, distribution, and power systems
- Solid profitability with 23% ROE and 12% ROIC
- Favorable liquidity ratios (current 1.76, quick 1.16)
- Strong global presence, significant US and non-US sales
- Robust asset turnover and interest coverage ratios
Nano Nuclear Energy Inc Strengths
- Favorable price-to-book at 0.01 and price-to-earnings despite negative earnings
- Very low debt levels (D/E 0.01, debt/assets 1.22%)
- Quick ratio extremely high at 53.48, indicating strong short-term liquidity
- Low financial leverage reduces bankruptcy risk
Cummins Inc. Weaknesses
- High price-to-book ratio at 5.7 signals potential overvaluation
- Net margin at 8.44% only neutral relative to industrial peers
- Moderate debt-to-equity ratio of 0.59, warrants monitoring
- Negative total segment revenues reported in latest filings
- No clear data on innovation pipeline or new power segment scale
Nano Nuclear Energy Inc Weaknesses
- Zero net margin, negative ROE and ROIC reflect lack of profitability
- Unfavorable weighted average cost of capital at 13.79%
- Interest coverage ratio of zero indicates inability to cover interest expenses
- Asset turnover and fixed asset turnover are zero, showing no asset utilization
- No reported revenues or geographic diversification available
Cummins demonstrates a broad product portfolio and global footprint with mostly favorable financial metrics, supporting operational resilience. Nano Nuclear Energy exhibits very low leverage but struggles with profitability and asset utilization, highlighting significant developmental or market-entry risks. These contrasts reflect differing strategic and operational maturity stages.
The Moat Duel: Analyzing Competitive Defensibility
A structural moat is the only reliable shield protecting long-term profits from relentless competitive erosion. Let’s dissect the moats of two industrial machinery players:
Cummins Inc.: Cost Advantage and Diversified Power Solutions
Cummins leverages scale and innovation in diesel and hybrid engines, delivering stable 25% gross margins and 8.4% net margins. Its broad product mix across global markets supports durability, though a slight decline in ROIC signals margin pressure in 2026.
Nano Nuclear Energy Inc: Emerging Technology with High Growth Potential
Nano Nuclear’s moat stems from proprietary microreactor technology and fuel supply initiatives. Unlike Cummins, it currently lacks profitability, reflected in negative ROIC versus WACC. However, its rapid ROIC growth hints at a promising, albeit unproven, competitive edge in nuclear innovation.
Verdict: Cost Leadership vs. Tech Innovation in Early Stages
Cummins holds a wider, more proven moat through efficient capital use and diversified markets. Nano Nuclear shows potential with a growing moat, but its current value destruction leaves it vulnerable. Cummins remains better positioned to defend market share in 2026.
Which stock offers better returns?
The past year shows strong gains for both stocks, with Cummins accelerating upward and Nano Nuclear Energy surging overall but slowing recently.
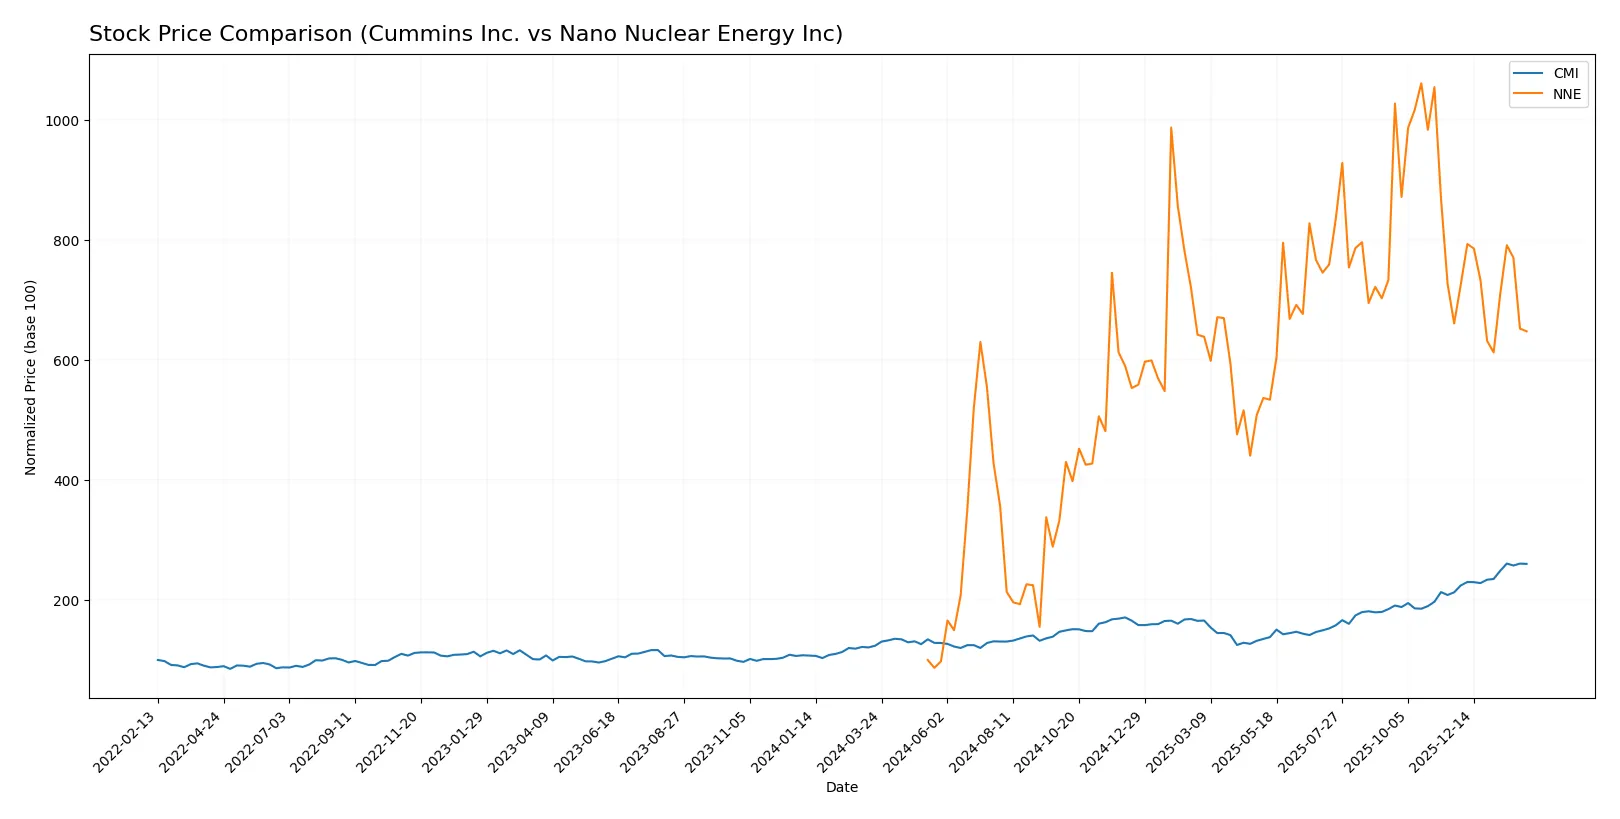
Trend Comparison
Cummins Inc. (CMI) exhibits a 110.21% price increase over the past 12 months, confirming a bullish trend with accelerating momentum and high volatility. The stock peaked at 578.94 and bottomed at 266.48.
Nano Nuclear Energy Inc (NNE) recorded an impressive 547.45% rise over the same period, indicating a bullish trend despite deceleration. Volatility is low, with the highest price at 47.84 and the lowest at 3.92.
Comparing both, NNE delivered the highest market performance with a much larger percentage gain, though its recent trend shows slight weakness versus CMI’s ongoing acceleration.
Target Prices
Analysts present a bullish consensus for Cummins Inc. and Nano Nuclear Energy Inc., reflecting optimism about their growth prospects.
| Company | Target Low | Target High | Consensus |
|---|---|---|---|
| Cummins Inc. | 540 | 703 | 606.1 |
| Nano Nuclear Energy Inc | 50 | 50 | 50 |
Cummins’ target consensus at 606.1 exceeds its current price of 577.73, signaling moderate upside. Nano Nuclear’s consensus of 50 strongly outpaces its 29.2 price, indicating high growth expectations.

Don’t Let Luck Decide Your Entry Point
Optimize your entry points with our advanced ProRealTime indicators. You’ll get efficient buy signals with precise price targets for maximum performance. Start outperforming now!
How do institutions grade them?
Cummins Inc. Grades
Here are the latest institutional grades for Cummins Inc. from major analysts:
| Grading Company | Action | New Grade | Date |
|---|---|---|---|
| Truist Securities | Maintain | Buy | 2026-02-06 |
| Wolfe Research | Downgrade | Peer Perform | 2026-01-26 |
| Barclays | Maintain | Overweight | 2026-01-23 |
| Wells Fargo | Maintain | Overweight | 2026-01-23 |
| JP Morgan | Maintain | Neutral | 2026-01-14 |
| Citigroup | Maintain | Buy | 2026-01-13 |
| Raymond James | Upgrade | Outperform | 2025-12-22 |
| Barclays | Upgrade | Overweight | 2025-12-19 |
| Truist Securities | Maintain | Buy | 2025-12-18 |
| Citigroup | Maintain | Buy | 2025-12-11 |
Nano Nuclear Energy Inc Grades
Below are the recent institutional grades for Nano Nuclear Energy Inc:
| Grading Company | Action | New Grade | Date |
|---|---|---|---|
| HC Wainwright & Co. | Maintain | Buy | 2025-08-19 |
| Ladenburg Thalmann | Downgrade | Sell | 2025-08-18 |
| HC Wainwright & Co. | Maintain | Buy | 2025-08-15 |
| HC Wainwright & Co. | Maintain | Buy | 2025-03-31 |
| HC Wainwright & Co. | Maintain | Buy | 2025-01-29 |
| HC Wainwright & Co. | Maintain | Buy | 2024-11-27 |
| Benchmark | Maintain | Buy | 2024-11-07 |
| Benchmark | Maintain | Buy | 2024-07-15 |
| Benchmark | Maintain | Buy | 2024-06-25 |
Which company has the best grades?
Cummins Inc. generally holds stronger and more consistent grades from a broader range of analysts. Nano Nuclear Energy Inc. shows mostly Buy ratings but includes a notable Sell downgrade. This disparity may signal higher perceived risk for Nano Nuclear among institutions.
Risks specific to each company
The following categories identify the critical pressure points and systemic threats facing both firms in the 2026 market environment:
1. Market & Competition
Cummins Inc.
- Established global industrial machinery player with diverse product lines and steady market presence.
Nano Nuclear Energy Inc
- Emerging microreactor tech company in a nascent, highly speculative nuclear energy segment.
2. Capital Structure & Debt
Cummins Inc.
- Moderate leverage (D/E 0.59), strong interest coverage (13.05), manageable debt-to-assets at 21.3%.
Nano Nuclear Energy Inc
- Minimal debt (D/E 0.01), but very limited scale and no interest coverage due to negative earnings.
3. Stock Volatility
Cummins Inc.
- Beta 1.12 indicates moderate volatility, typical for industrial sector leaders.
Nano Nuclear Energy Inc
- High beta of 7.49 signals extreme stock price swings, reflecting speculative risk and market uncertainty.
4. Regulatory & Legal
Cummins Inc.
- Faces standard regulatory scrutiny in emissions and product safety within heavy machinery sector.
Nano Nuclear Energy Inc
- Nuclear energy development faces intense regulatory hurdles, licensing challenges, and potential public opposition.
5. Supply Chain & Operations
Cummins Inc.
- Large, complex global supply chain with proven operational resilience and diversified suppliers.
Nano Nuclear Energy Inc
- Early-stage operations with supply chain risks tied to nuclear fuel fabrication and specialized tech components.
6. ESG & Climate Transition
Cummins Inc.
- Actively integrating electrified powertrain and emission solutions, positioning well for energy transition.
Nano Nuclear Energy Inc
- Nuclear technology offers low-carbon energy potential but faces public perception and waste disposal challenges.
7. Geopolitical Exposure
Cummins Inc.
- Global footprint exposes it to trade tensions but diversified customer base mitigates single-region risk.
Nano Nuclear Energy Inc
- Nuclear tech development may be sensitive to export controls, geopolitical tensions, and international regulatory alignment.
Which company shows a better risk-adjusted profile?
Cummins faces typical industrial risks but benefits from stable cash flows, strong credit metrics, and moderate stock volatility. Nano Nuclear Energy carries outsized risks from regulatory uncertainty, lack of profitability, and extreme stock volatility. Cummins offers a far superior risk-adjusted profile in 2026 given its proven business model and financial strength. The most impactful risk for Cummins is market competition amid energy transition pressures. For Nano Nuclear, the regulatory and operational challenges in pioneering nuclear microreactors dominate. Nano Nuclear’s extraordinarily high beta (7.49) and negative returns underscore its speculative nature, while Cummins’ solid Altman Z-score (4.77) confirms financial stability.
Final Verdict: Which stock to choose?
Cummins Inc. stands out as a powerhouse of operational efficiency and value creation. Its core strength lies in generating strong returns above its cost of capital, signaling a durable competitive edge. However, the slight decline in profitability and elevated valuation multiples warrant vigilance. It suits investors seeking steady, slightly favorable growth with moderate risk tolerance.
Nano Nuclear Energy Inc. offers a strategic moat in its cutting-edge technology and asset-light balance sheet. Its low debt and deep current liquidity provide a safety cushion relative to Cummins. Yet, the company is still in a value-destructive phase with weak profitability metrics. It fits growth-at-a-reasonable-price (GARP) portfolios willing to accept higher volatility for potential turnaround gains.
If you prioritize reliable value creation and operational resilience, Cummins outshines with its proven moat and stable cash flows. However, if you seek speculative growth upside with a focus on innovative energy technologies, Nano Nuclear Energy offers better exposure despite its current challenges. Each represents distinct investor avatars balancing risk and reward differently.
Disclaimer: Investment carries a risk of loss of initial capital. The past performance is not a reliable indicator of future results. Be sure to understand risks before making an investment decision.
Go Further
I encourage you to read the complete analyses of Cummins Inc. and Nano Nuclear Energy Inc to enhance your investment decisions: