Home > Comparison > Industrials > CMI vs KAI
The strategic rivalry between Cummins Inc. and Kadant Inc. shapes the industrial machinery sector’s competitive landscape. Cummins operates as a capital-intensive engine and power systems manufacturer with global scale. Kadant focuses on engineered systems and fluid-handling technologies, leveraging niche industrial processing solutions. This analysis pits scale and diversification against specialized innovation to identify which trajectory offers superior risk-adjusted returns for a diversified portfolio in 2026.
Table of contents
Companies Overview
Cummins Inc. and Kadant Inc. stand as pivotal players in the industrial machinery market with distinct operational scopes.
Cummins Inc.: Powertrain and Engine Powerhouse
Cummins Inc. leads as a global engine and power solutions provider, generating revenue through diesel and natural gas engines, hybrid powertrains, and related components. Its 2026 strategy centers on broadening electrified power systems and emission solutions, reinforcing its competitive edge in heavy and medium-duty vehicle markets worldwide.
Kadant Inc.: Engineered Systems Specialist
Kadant Inc. operates as a supplier of fluid-handling and industrial processing systems, earning revenue from engineered technologies across flow control, industrial processing, and material handling. In 2026, Kadant emphasizes innovation in filtration, recycling, and biodegradable absorbents, targeting packaging, tissue, and alternative fuel industries with tailored engineered solutions.
Strategic Collision: Similarities & Divergences
Both companies focus on engineered industrial machinery but diverge in scale and scope—Cummins pursues integrated powertrain ecosystems, while Kadant delivers specialized systems and consumables. Their primary battleground lies in industrial efficiency and sustainability solutions. Cummins offers a broad, diversified investment profile, whereas Kadant presents a niche, innovation-driven profile with concentrated market exposure.
Income Statement Comparison
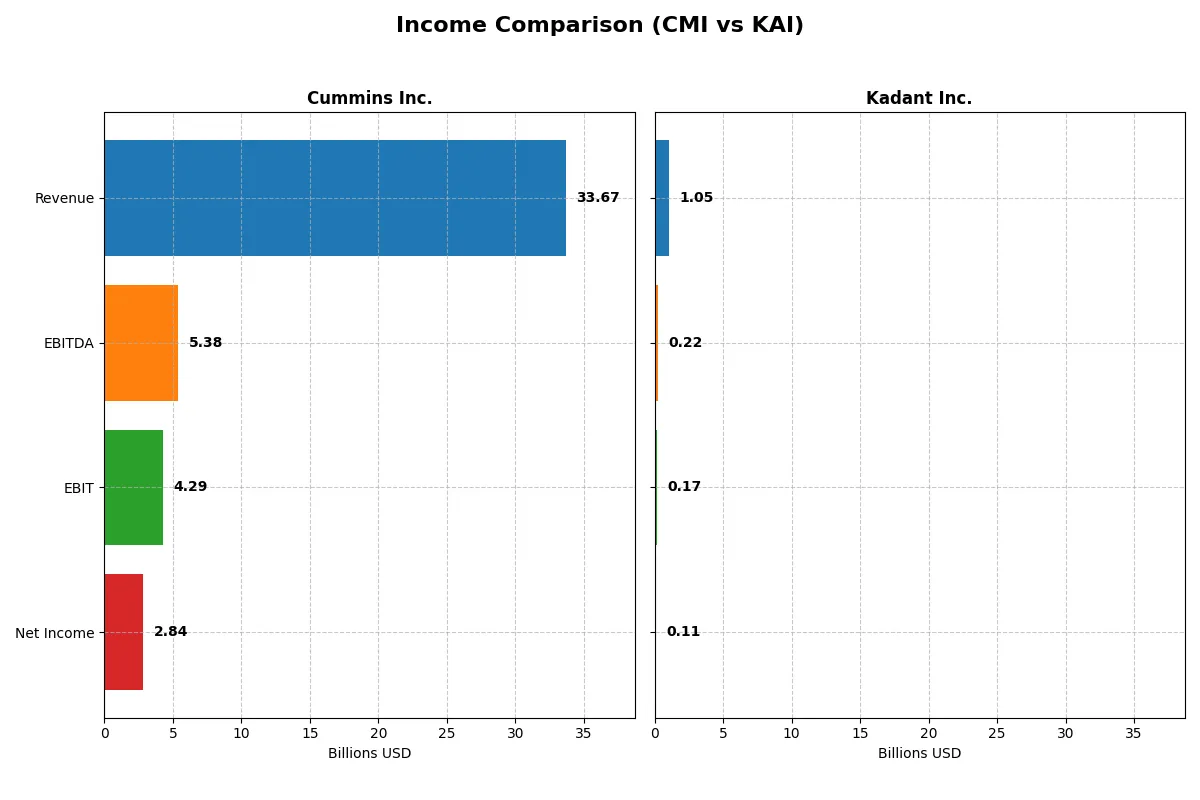
This data dissects the core profitability and scalability of both corporate engines to reveal who dominates the bottom line:
| Metric | Cummins Inc. (CMI) | Kadant Inc. (KAI) |
|---|---|---|
| Revenue | 33.7B | 1.05B |
| Cost of Revenue | 25.2B | 587M |
| Operating Expenses | 4.52B | 294M |
| Gross Profit | 8.52B | 466M |
| EBITDA | 5.39B | 223M |
| EBIT | 4.29B | 173M |
| Interest Expense | 329M | 20M |
| Net Income | 2.84B | 112M |
| EPS | 20.62 | 9.51 |
| Fiscal Year | 2025 | 2024 |
Income Statement Analysis: The Bottom-Line Duel
This income statement comparison reveals which company runs a more efficient and profitable corporate engine over recent years.
Cummins Inc. Analysis
Cummins displays steady revenue growth from 24B in 2021 to 34B in 2024, with a slight dip to 33.7B in 2025. Net income surged from 2.13B in 2021 to 3.95B in 2024, then declined to 2.84B in 2025. Gross margin remains healthy at 25.3%, but net margin contracted to 8.44% in 2025, signaling margin pressure despite strong top-line scale. The recent year highlights operational challenges reflected in an 18.6% EBIT drop, though the firm maintains favorable interest expense control.
Kadant Inc. Analysis
Kadant shows robust revenue growth from 635M in 2020 to 1.05B in 2024, with a 10% increase in the latest year. Net income more than doubled from 55M in 2020 to 112M in 2024, despite a slight EPS decline last year. Margins impress with a 44.3% gross margin and a 10.6% net margin, both outperforming Cummins. Kadant’s EBIT margin at 16.4% demonstrates operational efficiency, though net margin contracted by 12.6% last year, indicating some cost pressure.
Scale vs. Margin Excellence: The Efficiency Battle
Cummins leads in absolute revenue and net income scale, but Kadant outperforms on margin quality and recent growth momentum. Kadant’s superior gross and EBIT margins reflect a more efficient cost structure, while Cummins struggles with margin compression despite larger sales. For investors prioritizing profitability and margin expansion, Kadant offers a compelling profile, whereas those focused on scale may lean toward Cummins.
Financial Ratios Comparison
These vital ratios act as a diagnostic tool to expose the underlying fiscal health, valuation premiums, and capital efficiency of each company:
| Ratios | Cummins Inc. (CMI) | Kadant Inc. (KAI) |
|---|---|---|
| ROE | 23.0% | 13.2% |
| ROIC | 12.0% | 10.1% |
| P/E | 24.8 | 36.9 |
| P/B | 5.7 | 4.9 |
| Current Ratio | 1.76 | 2.31 |
| Quick Ratio | 1.16 | 1.55 |
| D/E (Debt to Equity) | 0.59 | 0.38 |
| Debt-to-Assets | 21.3% | 22.6% |
| Interest Coverage | 12.1 | 8.6 |
| Asset Turnover | 0.99 | 0.74 |
| Fixed Asset Turnover | 4.84 | 6.18 |
| Payout Ratio | 37.1% | 13.1% |
| Dividend Yield | 1.50% | 0.36% |
| Fiscal Year | 2025 | 2024 |
Efficiency & Valuation Duel: The Vital Signs
Ratios act as a company’s DNA, exposing both hidden risks and operational excellence to reveal true financial health.
Cummins Inc.
Cummins delivers strong profitability with a 23% ROE and a 12% ROIC, indicating efficient capital use. Its P/E ratio near 25 suggests a fairly valued stock, though a high PB ratio flags premium pricing. The company returns 1.5% in dividends, balancing shareholder yield with reinvestment in R&D for growth.
Kadant Inc.
Kadant posts a healthier net margin of 10.6% but a lower ROE at 13.2%, showing moderate profitability. Its valuation is stretched, with a P/E close to 37 and a high PB ratio. The low 0.36% dividend yield implies most cash flows fund expansion and innovation, reflecting a growth-oriented stance.
Valuation Discipline vs. Growth Ambition
Cummins offers a better balance of solid returns and reasonable valuation, while Kadant’s premium multiples reflect growth expectations. Investors seeking steadier income and operational efficiency may prefer Cummins, whereas growth seekers might lean toward Kadant’s aggressive reinvestment.
Which one offers the Superior Shareholder Reward?
I find Cummins Inc. (CMI) offers a stronger shareholder reward than Kadant Inc. (KAI) in 2026. CMI yields around 1.5-2.7% with a moderate payout ratio (~37%), demonstrating sustainable dividends backed by solid free cash flow (~66-69% FCF coverage). CMI also runs intense buybacks, reinforcing total returns. In contrast, KAI pays a minimal dividend yield (~0.35-0.57%) with a low payout ratio (~11-19%), focusing on reinvestment and moderate buybacks. While KAI’s growth reinvestment suits long-term expansion, CMI balances income and capital return better, delivering a more attractive total return profile for investors seeking both yield and capital appreciation in 2026.
Comparative Score Analysis: The Strategic Profile
The radar chart reveals the fundamental DNA and trade-offs of Cummins Inc. and Kadant Inc., highlighting their core financial strengths and vulnerabilities:
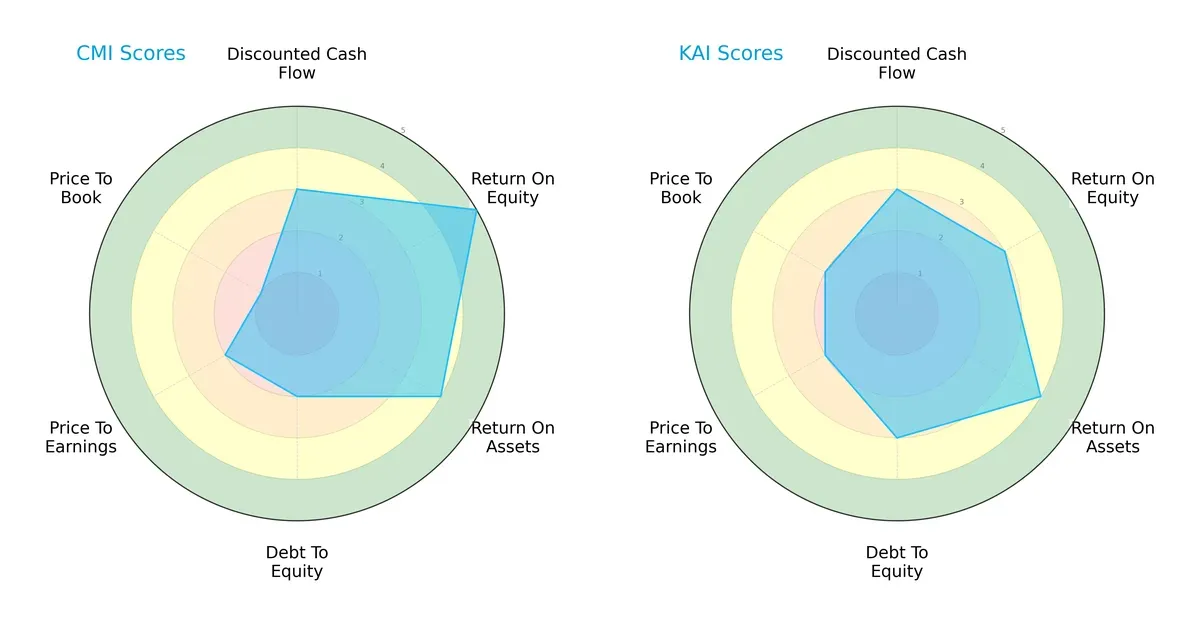
Cummins excels in profitability with a very favorable ROE (5) and strong ROA (4), but it carries higher financial risk, reflected in a weak debt-to-equity score (2) and poor valuation metrics (P/E 2, P/B 1). Kadant shows a more balanced profile, with moderate ROE (3), solid ROA (4), and better leverage control (debt-to-equity 3). Both firms have moderate DCF scores (3) and overall scores (3), but Cummins relies heavily on operational efficiency, while Kadant manages risk more prudently.
Bankruptcy Risk: Solvency Showdown
Cummins and Kadant both sit comfortably in the safe zone, with Altman Z-Scores of 4.77 and 6.25 respectively, indicating low bankruptcy risk in this cycle:
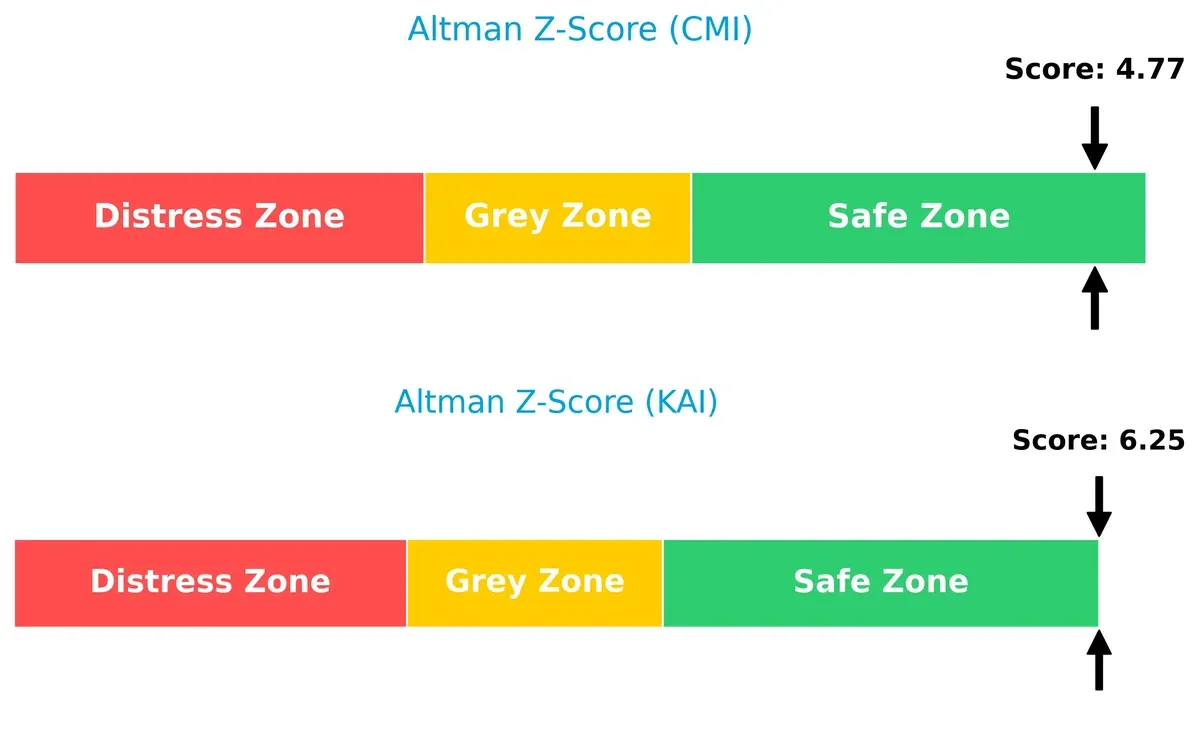
Kadant’s higher Z-Score suggests superior solvency and resilience against downturns. Cummins remains solvent but faces comparatively greater financial stress, which investors should monitor closely.
Financial Health: Quality of Operations
Kadant’s Piotroski F-Score of 7 signals strong financial health and operational quality, outperforming Cummins’ average score of 5, which raises some caution flags:
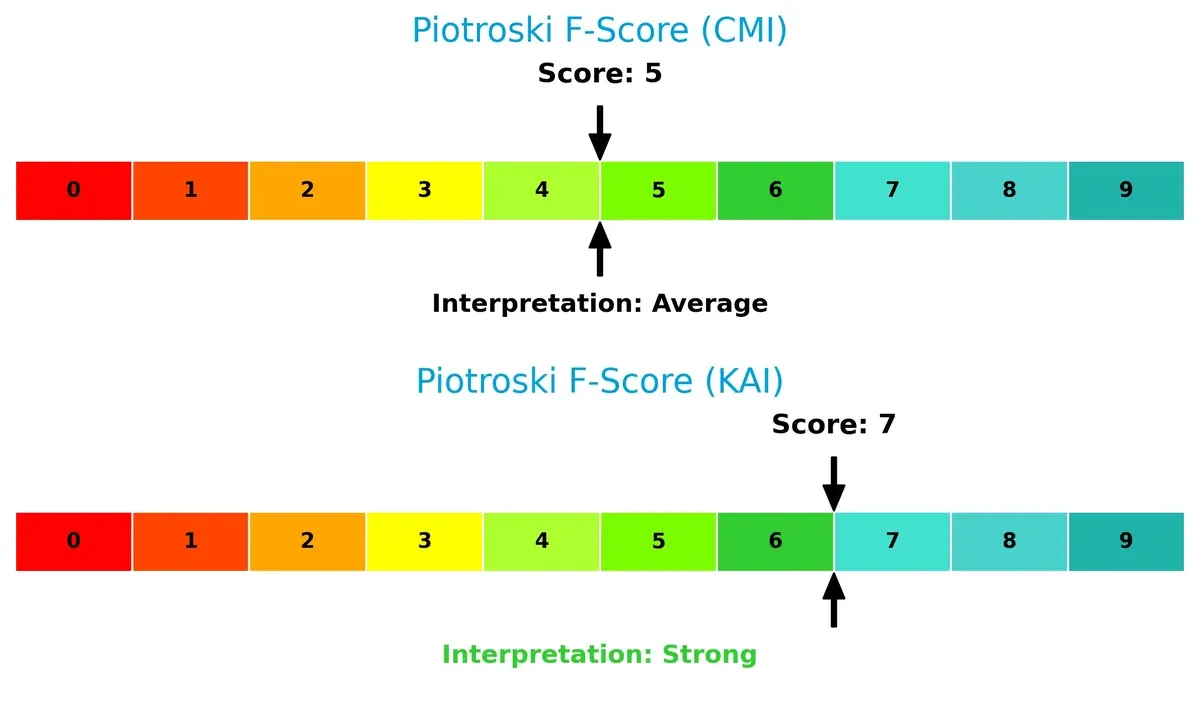
Kadant demonstrates superior profitability, liquidity, and efficiency metrics, while Cummins shows room for improvement in internal financial controls and operational robustness. This distinction is critical for investors prioritizing sustainable quality.
How are the two companies positioned?
This section dissects the operational DNA of Cummins and Kadant by comparing their revenue distribution and internal dynamics. The goal is to confront their economic moats to identify the more resilient, sustainable competitive advantage.
Revenue Segmentation: The Strategic Mix
This comparison dissects how Cummins Inc. and Kadant Inc. diversify income streams and reveal their primary sector bets for strategic positioning:
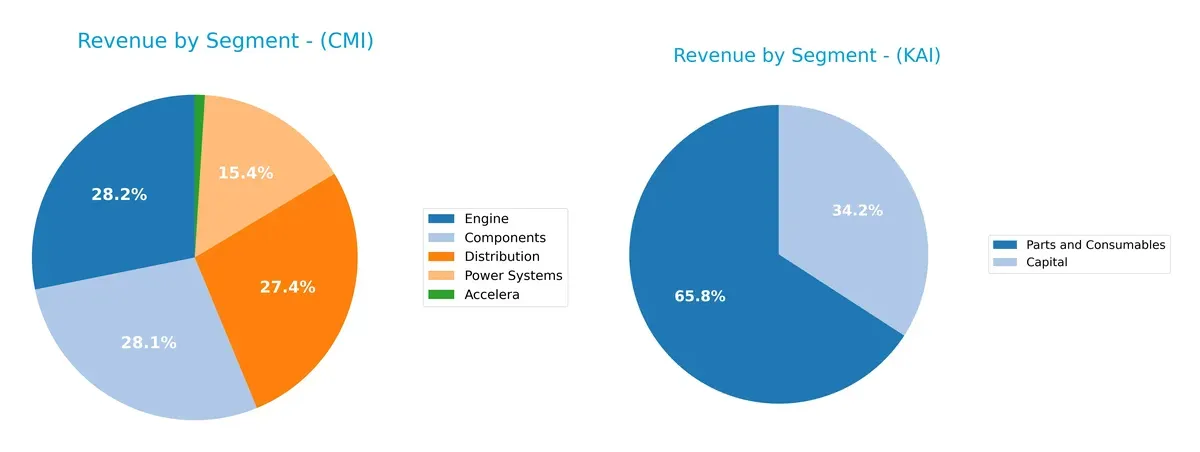
Cummins Inc. dwarfs Kadant with a broad portfolio: Engines (11.7B), Components (11.7B), Distribution (11.4B), and Power Systems (6.4B). Kadant pivots mainly on Parts and Consumables (694M) and Capital (360M), showing less diversification. Cummins’ balanced mix anchors its infrastructure dominance, mitigating concentration risk. Kadant’s reliance on two segments signals vulnerability but also sharp focus, suited for niche specialization.
Strengths and Weaknesses Comparison
This table compares the Strengths and Weaknesses of Cummins Inc. and Kadant Inc.:
Cummins Inc. Strengths
- Diverse segments including Engine, Components, Distribution, Power Systems
- Strong profitability with ROE 23% and ROIC 12% exceeding WACC
- Favorable liquidity with current ratio 1.76 and quick ratio 1.16
- Solid global presence with significant US, China, and India revenue
- High fixed asset turnover at 4.84 indicates efficient asset use
Kadant Inc. Strengths
- Favorable net margin of 10.6% and ROIC of 10.1%
- Strong liquidity ratios (current 2.31, quick 1.55) and low debt-to-equity 0.38
- Focused product segments like Capital and Parts and Consumables
- Global footprint across North America, Europe, and Asia
- High fixed asset turnover 6.18 indicates efficient capital deployment
Cummins Inc. Weaknesses
- Price-to-book ratio 5.7 is unfavorable, indicating potential overvaluation
- Moderate net margin at 8.4%, less than Kadant’s
- Neutral debt to equity ratio at 0.59 could signal higher leverage risk
- Neutral asset turnover 0.99 lower than Kadant’s fixed asset turnover
- Slightly unfavorable PE ratio 24.8 compared to market benchmarks
Kadant Inc. Weaknesses
- Unfavorable PE ratio of 36.9 suggests high valuation risk
- Lower ROE at 13.2% compared to Cummins
- Dividend yield 0.36% is low, possibly less attractive for income investors
- Higher unfavorable ratios at 21.4% compared to Cummins
- Smaller revenue scale and less diversified product base
Cummins shows a broad industrial diversification and robust profitability metrics, strengthening its competitive moat. Kadant excels in operational efficiency and liquidity but faces valuation and scale challenges. Both companies demonstrate strong global footprints, yet differ markedly in balance sheet leverage and market valuation risks.
The Moat Duel: Analyzing Competitive Defensibility
A structural moat is the only shield protecting long-term profits from relentless competition erosion. Let’s dissect the competitive moats of Cummins Inc. and Kadant Inc.:
Cummins Inc.: Intangible Assets and Diversified Product Moat
Cummins leverages extensive R&D and brand recognition in diesel and hybrid powertrains, reflected in stable gross margins near 25%. Its broad industrial footprint supports resilient profitability despite revenue softness in 2025. Emerging electrification initiatives could deepen its moat or invite disruption.
Kadant Inc.: Niche Engineering and Operational Efficiency Moat
Kadant’s moat centers on specialized engineered systems with a premium gross margin of 44%. Unlike Cummins, Kadant shows a growing ROIC trend, signaling efficient capital use. Its focus on industrial processing and filtration systems opens avenues for expansion amid rising global demand for sustainability solutions.
Moat Strength: Diversification Depth vs. Operational Focus
Cummins holds a wider moat with consistent value creation despite declining ROIC, benefiting from scale and product diversity. Kadant’s narrower moat is strengthening, driven by operational gains and innovation potential. Cummins is better positioned to defend market share amid intensifying competition.
Which stock offers better returns?
The past year shows strong price gains for both stocks, with Cummins Inc. surging sharply and Kadant Inc. advancing steadily amid varying trading volumes.
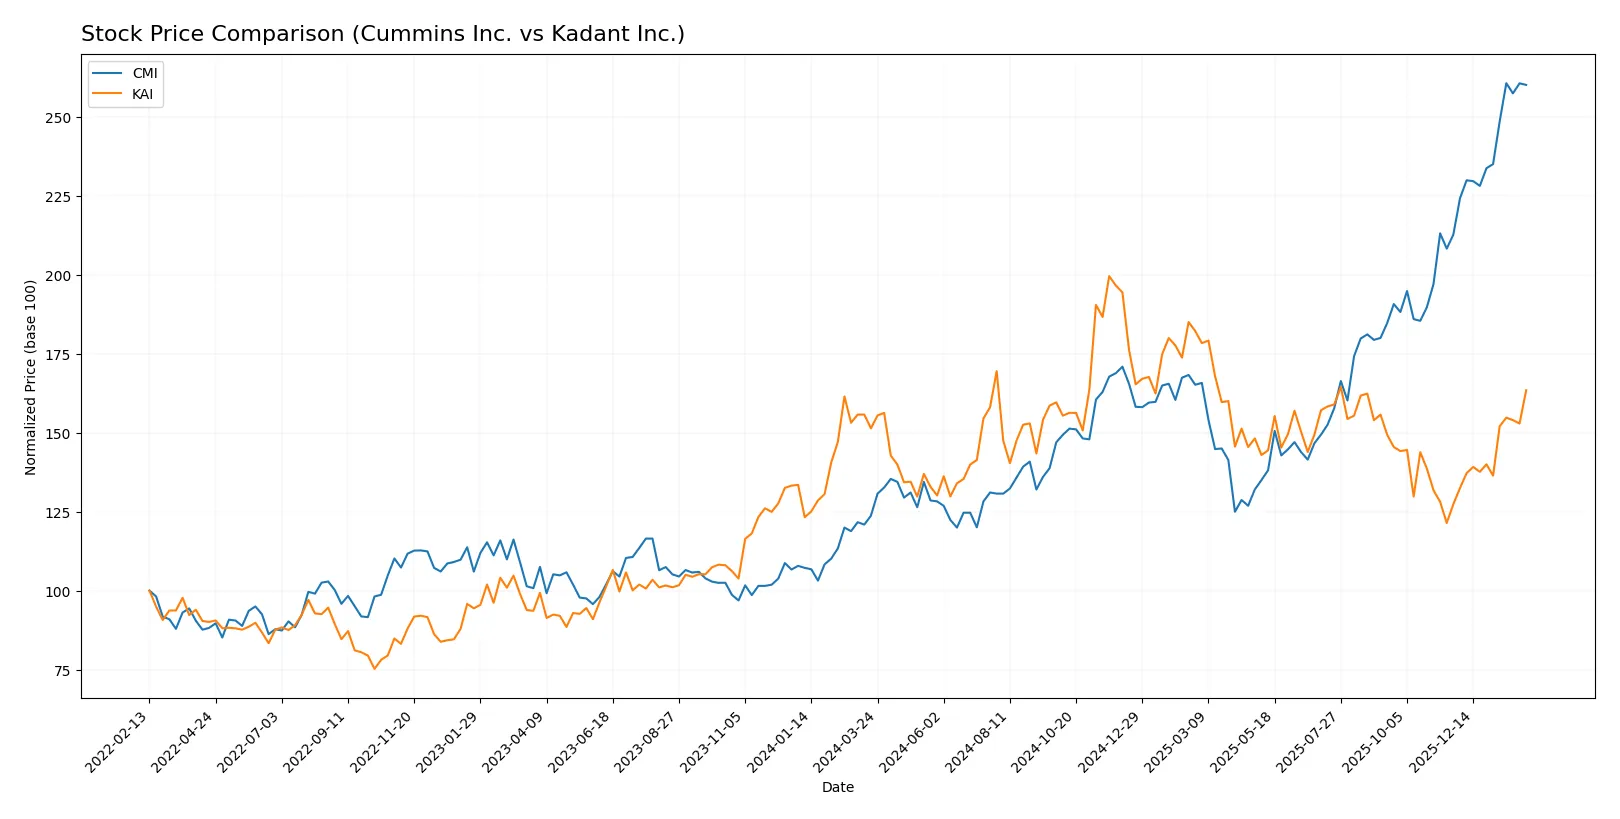
Trend Comparison
Cummins Inc. posts a 110.21% price rise over 12 months, marking a bullish trend with acceleration. Volatility is high, with a 79.49 std deviation and peak price at 578.94.
Kadant Inc. rises 7.96% over the same period, also bullish with acceleration. Its lower volatility (34.46 std deviation) reflects steadier gains, peaking at 419.01.
Cummins Inc. outperforms Kadant Inc. by a wide margin, delivering the highest market return in the analyzed year.
Target Prices
Analysts set a positive target consensus for both Cummins Inc. and Kadant Inc., reflecting confidence in their growth prospects.
| Company | Target Low | Target High | Consensus |
|---|---|---|---|
| Cummins Inc. | 540 | 703 | 606.1 |
| Kadant Inc. | 275 | 410 | 342.5 |
Cummins trades near $578, below its $606 consensus target, suggesting moderate upside. Kadant’s price at $343 aligns closely with its $342.5 target, signaling fair valuation.

Don’t Let Luck Decide Your Entry Point
Optimize your entry points with our advanced ProRealTime indicators. You’ll get efficient buy signals with precise price targets for maximum performance. Start outperforming now!
How do institutions grade them?
Cummins Inc. Grades
The table below summarizes recent grades for Cummins Inc. by major grading companies.
| Grading Company | Action | New Grade | Date |
|---|---|---|---|
| Truist Securities | Maintain | Buy | 2026-02-06 |
| Wolfe Research | Downgrade | Peer Perform | 2026-01-26 |
| Barclays | Maintain | Overweight | 2026-01-23 |
| Wells Fargo | Maintain | Overweight | 2026-01-23 |
| JP Morgan | Maintain | Neutral | 2026-01-14 |
| Citigroup | Maintain | Buy | 2026-01-13 |
| Raymond James | Upgrade | Outperform | 2025-12-22 |
| Barclays | Upgrade | Overweight | 2025-12-19 |
| Truist Securities | Maintain | Buy | 2025-12-18 |
| Citigroup | Maintain | Buy | 2025-12-11 |
Kadant Inc. Grades
Below is a summary of recent Kadant Inc. grades from recognized grading firms.
| Grading Company | Action | New Grade | Date |
|---|---|---|---|
| DA Davidson | Maintain | Neutral | 2026-02-04 |
| Barrington Research | Maintain | Outperform | 2026-02-03 |
| Barrington Research | Maintain | Outperform | 2025-10-30 |
| Barrington Research | Maintain | Outperform | 2025-10-29 |
| Barrington Research | Maintain | Outperform | 2025-10-27 |
| Barrington Research | Maintain | Outperform | 2025-10-10 |
| Barrington Research | Maintain | Outperform | 2025-09-23 |
| DA Davidson | Maintain | Neutral | 2025-08-04 |
| Barrington Research | Maintain | Outperform | 2025-07-30 |
| Barrington Research | Maintain | Outperform | 2025-07-29 |
Which company has the best grades?
Kadant Inc. consistently earns “Outperform” from Barrington Research, signaling confidence in its prospects. Cummins Inc. shows mixed grades with several “Buy” and “Overweight” ratings but also downgrades. Investors may view Kadant’s steadier positive grades as a sign of stronger institutional endorsement.
Risks specific to each company
The following categories identify critical pressure points and systemic threats facing Cummins Inc. and Kadant Inc. in the 2026 market environment:
1. Market & Competition
Cummins Inc.
- Operates in diverse heavy machinery segments; faces intense competition from global engine and powertrain manufacturers.
Kadant Inc.
- Serves niche industrial machinery markets with specialized flow control and material handling; competition from smaller, specialized firms.
2. Capital Structure & Debt
Cummins Inc.
- Moderate debt-to-equity ratio (0.59); interest coverage strong at 13.05x, indicating solid debt servicing capacity.
Kadant Inc.
- Lower debt-to-equity (0.38); interest coverage of 8.64x is adequate but less robust than Cummins.
3. Stock Volatility
Cummins Inc.
- Beta of 1.12 suggests moderate volatility, slightly above market average.
Kadant Inc.
- Higher beta at 1.23 indicates greater stock price sensitivity to market swings.
4. Regulatory & Legal
Cummins Inc.
- Exposure to emissions regulations due to diesel engine products; compliance costs could rise with tightening standards.
Kadant Inc.
- Faces regulatory risks in environmental controls for industrial processing; less exposed to direct emissions regulations.
5. Supply Chain & Operations
Cummins Inc.
- Complex global supply chains for engine components, vulnerable to raw material price swings and geopolitical disruptions.
Kadant Inc.
- Smaller scale supply chains but dependent on specialized materials; less diversified operational footprint.
6. ESG & Climate Transition
Cummins Inc.
- Significant transition risks with shift toward electrification and hydrogen power; must invest heavily in clean tech.
Kadant Inc.
- ESG risks moderate; focus on sustainable materials and industrial waste reduction, but less exposed to energy transition pressures.
7. Geopolitical Exposure
Cummins Inc.
- Global sales expose it to trade tensions and regulatory changes across multiple continents.
Kadant Inc.
- Primarily US-based operations with limited international exposure, reducing geopolitical risk.
Which company shows a better risk-adjusted profile?
Cummins faces its greatest risk in regulatory and market transition pressures tied to emissions and electrification. Kadant’s most impactful risk lies in higher stock volatility and valuation concerns. Despite Cummins’ heavier regulatory burden, its robust debt coverage and diversified operations offer a steadier risk-adjusted profile. Kadant’s stronger Piotroski score signals financial strength, but its elevated beta and unfavorable valuation metrics warrant caution. I remain wary of Kadant’s higher market sensitivity amid current macroeconomic uncertainties.
Final Verdict: Which stock to choose?
Cummins Inc. wields unmatched operational efficiency and a robust capital return profile, steadily creating value despite a slight dip in profitability. Its main point of vigilance remains the elevated price-to-book ratio, which suggests a premium valuation. This stock suits aggressive growth portfolios seeking industrial strength with an established track record.
Kadant Inc. leverages a strategic moat rooted in its high gross margins and improving profitability, supported by a growing ROIC trend. It offers a safer financial profile with stronger liquidity and lower leverage compared to Cummins. Kadant fits well in GARP portfolios that balance growth aspirations with reasonable risk controls.
If you prioritize sustained capital efficiency and industrial leadership, Cummins outshines as the compelling choice due to its proven value creation. However, if you seek a safer growth trajectory with improving profitability metrics, Kadant offers better stability and an attractive margin expansion story. Both present distinct analytical scenarios tailored to specific investor risk appetites and portfolio goals.
Disclaimer: Investment carries a risk of loss of initial capital. The past performance is not a reliable indicator of future results. Be sure to understand risks before making an investment decision.
Go Further
I encourage you to read the complete analyses of Cummins Inc. and Kadant Inc. to enhance your investment decisions: