Home > Comparison > Industrials > CMI vs JBTM
The strategic rivalry between Cummins Inc. and JBT Marel Corporation shapes the Industrials sector’s evolution. Cummins operates as a capital-intensive machinery powerhouse, specializing in engines and power systems. JBT Marel contrasts as a technology-driven machinery provider focused on automated food processing solutions. This analysis explores their divergent business models to identify which offers superior risk-adjusted returns for a diversified portfolio in a competitive industrial landscape.
Table of contents
Companies Overview
Cummins Inc. and JBT Marel Corporation shape key segments of the industrial machinery market with distinct global footprints.
Cummins Inc.: Powertrain Pioneer
Cummins Inc. dominates the diesel and natural gas engine market worldwide. It generates revenue through designing, manufacturing, and servicing engines and power systems for trucks, construction, mining, and marine sectors. In 2026, Cummins focuses strategically on expanding electrified power systems including battery and hydrogen technologies, aiming to lead the transition to cleaner energy solutions.
JBT Marel Corporation: Food Processing Innovator
JBT Marel Corporation specializes in technology solutions for the food and beverage industries globally. Its core revenue stems from advanced processing equipment like mixing, freezing, packaging, and automation systems tailored to various food sectors. In 2026, JBT Marel prioritizes enhancing automation and integrated systems, boosting efficiency in food production and warehouse logistics.
Strategic Collision: Similarities & Divergences
Both companies operate in industrial machinery but pursue divergent philosophies: Cummins invests heavily in powertrain electrification and emission solutions, while JBT Marel emphasizes automation in food processing. Their primary battleground is technological innovation, targeting different end markets—transportation versus food manufacturing. Cummins offers a broad industrial moat around power systems; JBT Marel presents a niche yet scalable automation model, reflecting distinct risk and growth profiles.
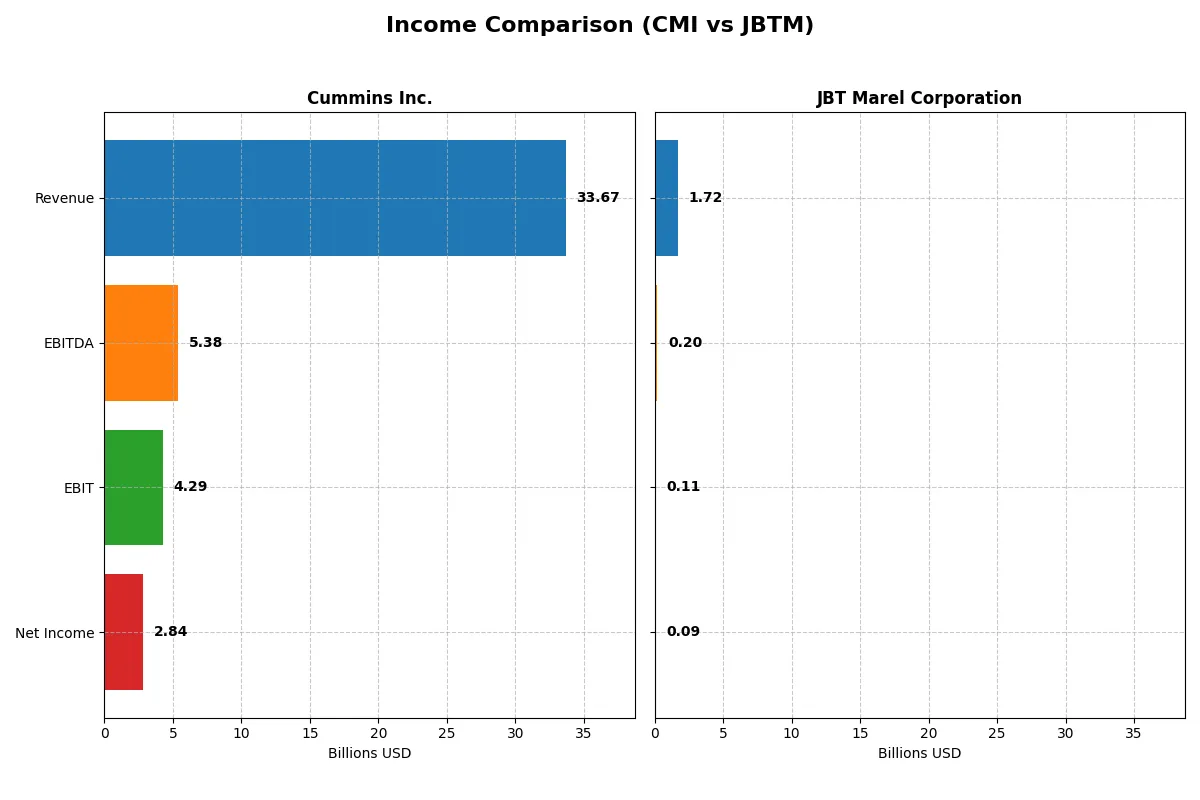
Income Statement Comparison
This data dissects the core profitability and scalability of both corporate engines to reveal who dominates the bottom line:
| Metric | Cummins Inc. (CMI) | JBT Marel Corporation (JBTM) |
|---|---|---|
| Revenue | 33.7B | 1.72B |
| Cost of Revenue | 25.2B | 1.09B |
| Operating Expenses | 4.52B | 508M |
| Gross Profit | 8.52B | 626.5M |
| EBITDA | 5.39B | 204.2M |
| EBIT | 4.29B | 114.8M |
| Interest Expense | 329M | 19.4M |
| Net Income | 2.84B | 85.4M |
| EPS | 20.62 | 2.67 |
| Fiscal Year | 2025 | 2024 |
Income Statement Analysis: The Bottom-Line Duel
This income statement comparison reveals how efficiently each company converts revenue into profit and sustains margin strength amid market shifts.
Cummins Inc. Analysis
Cummins’ revenue peaked at 34.1B in 2024 but slipped 1.3% to 33.7B in 2025. Net income followed suit, falling from 3.95B to 2.84B, signaling margin pressure. Gross margin remains favorable at 25.3%, but net margin dropped to 8.4%. Despite a 27% EPS decline last year, Cummins shows solid long-term revenue and earnings growth, reflecting resilient operating efficiency.
JBT Marel Corporation Analysis
JBT Marel’s revenue grew modestly by 3.1% to 1.72B in 2024, with net income plunging 85% to 85M, sharply compressing net margin to just under 5%. Gross margin stands robust at 36.5%, yet EBIT margin is a subdued 6.7%. The company’s overall income growth is negative over five years, revealing challenges in scaling profitability despite steady top-line gains.
Margin Power vs. Revenue Scale
Cummins commands stronger revenue scale and better margin sustainability, though both faced profit setbacks in the latest year. JBT Marel boasts superior gross margin but struggles with converting sales into net income. Cummins’ profile suits investors prioritizing stable long-term growth, while JBT’s high margin but volatile earnings reflect greater operational risk.
Financial Ratios Comparison
These vital ratios act as a diagnostic tool to expose the underlying fiscal health, valuation premiums, and capital efficiency of the companies compared below:
| Ratios | Cummins Inc. (CMI) | JBT Marel Corporation (JBTM) |
|---|---|---|
| ROE | 23.0% | 5.5% |
| ROIC | 12.0% | 3.7% |
| P/E | 24.8 | 47.6 |
| P/B | 5.7 | 2.6 |
| Current Ratio | 1.76 | 3.48 |
| Quick Ratio | 1.16 | 3.04 |
| D/E (Debt-to-Equity) | 0.59 | 0.81 |
| Debt-to-Assets | 21.3% | 36.7% |
| Interest Coverage | 12.1 | 6.1 |
| Asset Turnover | 0.99 | 0.50 |
| Fixed Asset Turnover | 4.84 | 7.34 |
| Payout Ratio | 37.1% | 15.3% |
| Dividend Yield | 1.50% | 0.32% |
| Fiscal Year | 2025 | 2024 |
Efficiency & Valuation Duel: The Vital Signs
Financial ratios act as a company’s DNA, exposing hidden risks and operational excellence critical to investment decisions.
Cummins Inc.
Cummins delivers strong profitability with a 23.02% ROE and favorable 12.01% ROIC, signaling efficient capital use above its 8.56% WACC. The stock trades at a neutral 24.76 P/E but a stretched 5.7 P/B, indicating premium valuation. Cummins balances modest 1.5% dividends with reinvestment in R&D (4.15% of revenue), supporting growth.
JBT Marel Corporation
JBT Marel shows weaker profitability with a 5.53% ROE and 3.65% ROIC, both unfavorable compared to sector norms. The stock appears expensive at 47.63 P/E and offers a low 0.32% dividend yield. Despite a solid quick ratio and interest coverage, the company’s reinvestment focus remains unclear, reflecting operational challenges and risk.
Premium Valuation vs. Operational Safety
Cummins offers a better balance of profitability and valuation metrics than JBT Marel, with stronger returns and a more favorable capital structure. Investors seeking operational safety and efficient capital deployment may find Cummins’ profile more aligned with risk management and steady growth.
Which one offers the Superior Shareholder Reward?
I see Cummins Inc. (CMI) provides a 1.5% dividend yield with a payout ratio near 37%, backed by strong free cash flow coverage above 65%. Its buyback program is moderate, supporting total return sustainably. Conversely, JBT Marel Corporation (JBTM) yields a negligible 0.32% dividend with a low payout below 16%, but it drives shareholder value mainly through aggressive buybacks and reinvestment in growth. However, JBTM’s higher financial leverage and inconsistent free cash flow raise sustainability concerns. I judge CMI’s balanced dividend and buyback strategy more resilient and rewarding for 2026 investors.
Comparative Score Analysis: The Strategic Profile
The radar chart reveals the fundamental DNA and trade-offs of Cummins Inc. and JBT Marel Corporation, highlighting their distinct financial strengths and weaknesses:
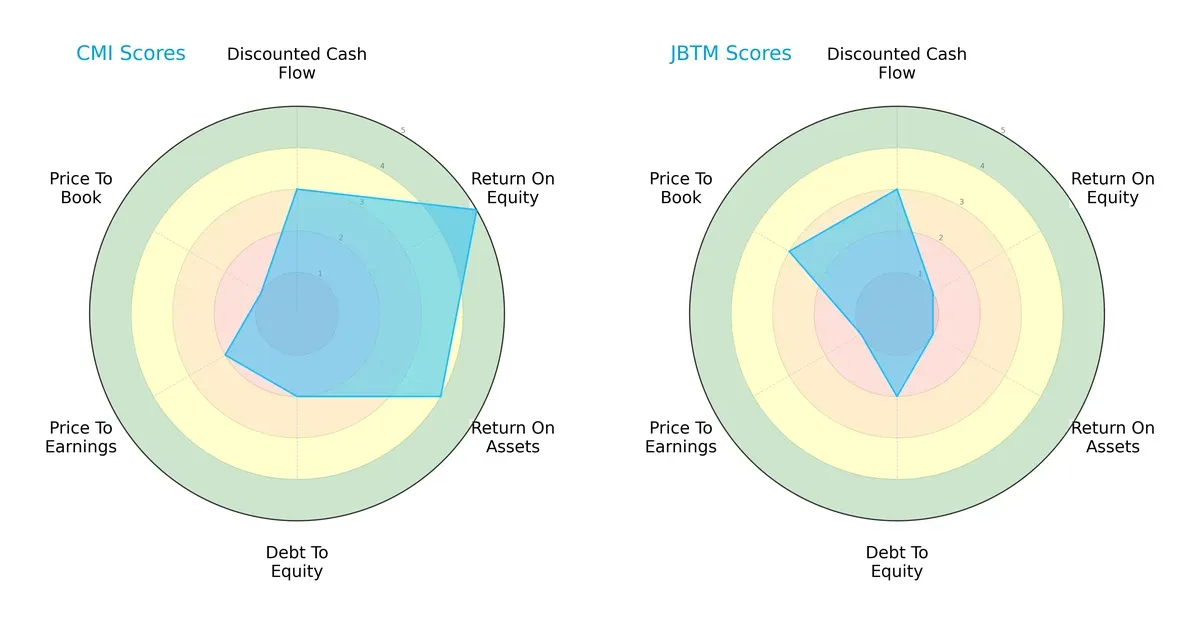
Cummins Inc. leads with superior profitability metrics, boasting a very favorable ROE (5) and favorable ROA (4). However, it carries a higher financial risk, reflected in an unfavorable debt-to-equity score (2) and weak valuation scores (PE 2, PB 1). JBT Marel shows a less balanced profile, relying heavily on moderate DCF (3) but suffering from very unfavorable profitability (ROE 1, ROA 1) and valuation scores (PE 1), although its price-to-book is moderately better (3). Cummins presents a more balanced and robust strategic profile, while JBT Marel depends on specific valuation edges.
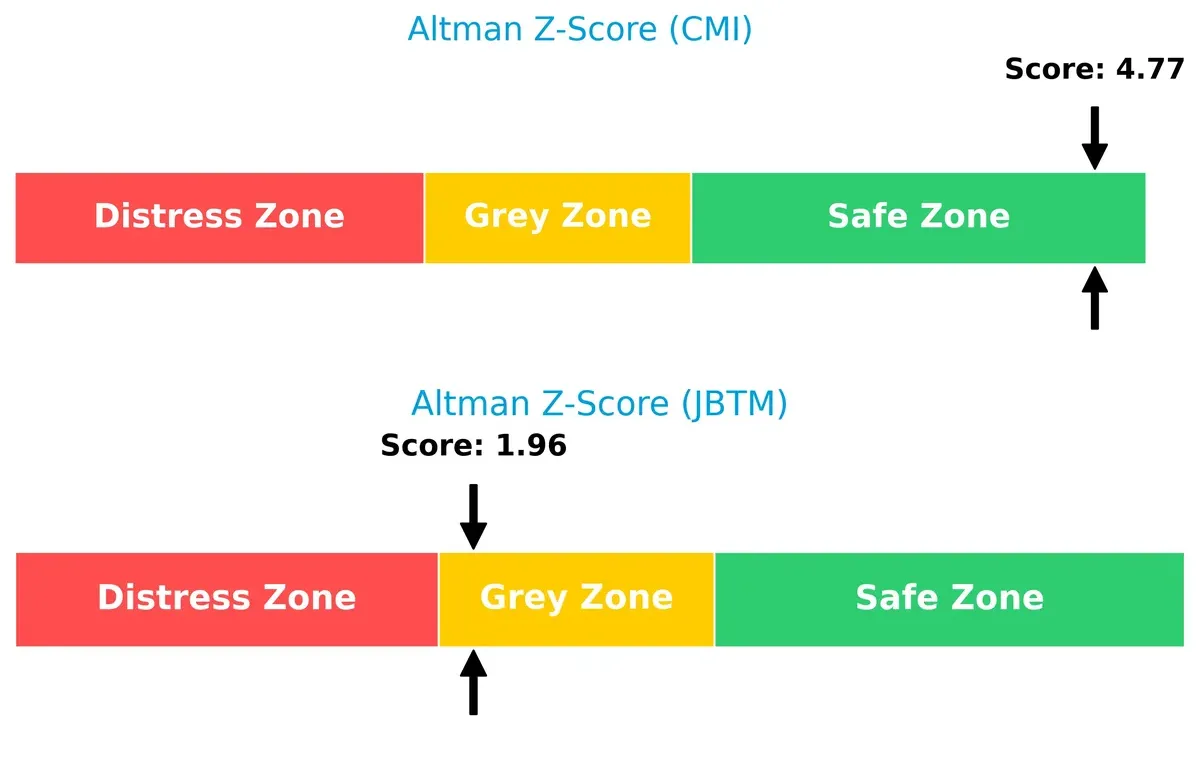
Bankruptcy Risk: Solvency Showdown
Cummins’ Altman Z-Score of 4.77 places it firmly in the safe zone, signaling strong financial resilience. JBT Marel’s 1.96 score lands in the grey zone, implying moderate bankruptcy risk in this cycle:
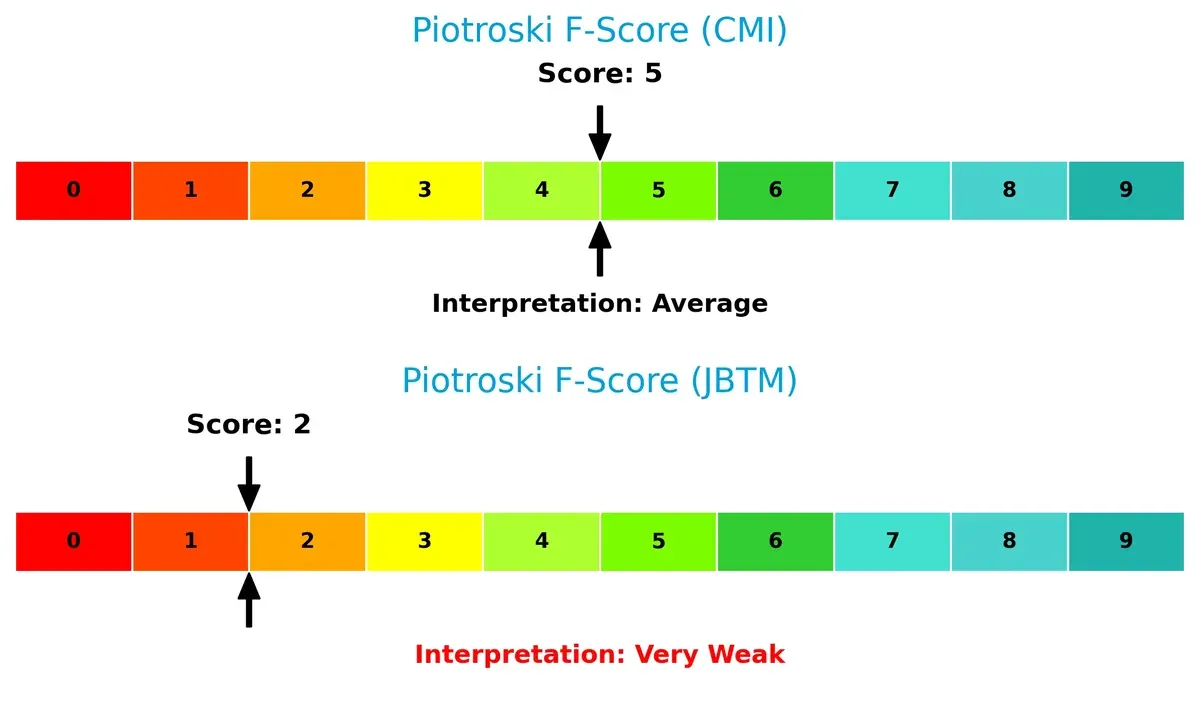
Financial Health: Quality of Operations
Cummins’ Piotroski F-Score of 5 indicates average financial health with no glaring red flags. JBT Marel scores a weak 2, raising concerns about its internal operational quality and financial stability:
How are the two companies positioned?
This section dissects the operational DNA of Cummins and JBT Marel by comparing their revenue distribution by segment and internal dynamics. The goal is to confront their economic moats to identify which model delivers the most resilient competitive advantage today.
Revenue Segmentation: The Strategic Mix
The following visual comparison dissects how Cummins Inc. and JBT Marel Corporation diversify their income streams and where their primary sector bets lie:
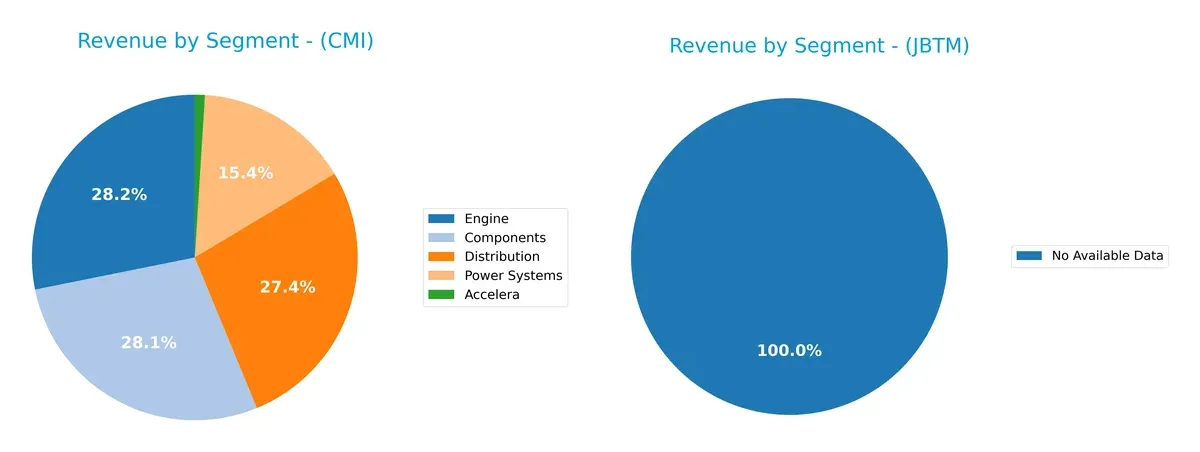
Cummins Inc. anchors revenue in its Engine segment with $11.7B in 2024, closely followed by Components at $11.7B and Distribution at $11.4B. This balanced concentration across three major segments contrasts with JBT Marel Corporation, for which no data is available. Cummins’ diversified mix mitigates concentration risk while leveraging strong infrastructure dominance in powertrain and distribution ecosystems. This strategic breadth supports resilience amid market cycles.
Strengths and Weaknesses Comparison
This table compares the Strengths and Weaknesses of Cummins Inc. and JBT Marel Corporation based on diversification, profitability, financials, innovation, global presence, and market share:
Cummins Inc. Strengths
- Diversified revenue streams across Components, Distribution, Engine, and Power Systems
- Strong profitability with favorable ROE (23%) and ROIC (12%)
- Solid liquidity ratios (current 1.76, quick 1.16)
- Favorable interest coverage (13x) and asset utilization
- Significant global presence with $19.4B US and $9.95B non-US sales
- Consistent market position in multiple product segments
JBT Marel Strengths
- Favorable weighted-average cost of capital (7.45%) supports capital efficiency
- Strong fixed asset turnover (7.34) indicates efficient use of assets
- Good quick ratio (3.04) signals solid short-term liquidity
- Interest coverage of 5.92x protects from financial distress
- Moderate debt-to-assets ratio (36.7%)
Cummins Inc. Weaknesses
- Unfavorable high price-to-book ratio (5.7) suggests overvaluation risk
- Neutral net margin (8.44%) less competitive versus sector leaders
- Moderate debt-to-equity (0.59) limits financial flexibility
- Relatively stable but moderate asset turnover (0.99)
JBT Marel Weaknesses
- Low profitability with net margin (4.98%), ROE (5.53%), and ROIC (3.65%) all unfavorable
- Unfavorable high P/E (47.63) indicates possible overvaluation
- Unfavorable low dividend yield (0.32%) may deter income investors
- Current ratio (3.48) flagged unfavorable, possibly indicating inefficient capital use
Cummins shows strength in profitability and diversified global operations, supported by solid liquidity and asset efficiency. JBT Marel displays efficient asset use and good liquidity but faces significant profitability and valuation challenges. These contrasts highlight differing operational and financial priorities influencing each company’s strategic positioning.
The Moat Duel: Analyzing Competitive Defensibility
A structural moat is the only reliable barrier protecting long-term profits from relentless competitive erosion in any industry:
Cummins Inc.: Intangible Assets and Diversified Power Solutions Moat
Cummins leverages intangible assets—brand, technology, and emission solutions—to sustain high ROIC above WACC. Its diversified powertrain portfolio supports margin stability despite revenue pressure in 2025. Emerging electrification and hydrogen fuel technologies could deepen its moat.
JBT Marel Corporation: Niche Industrial Automation Moat
JBTM relies on specialized automation tech in food processing, a narrower moat than Cummins’ broad industrial base. Its ROIC falls below WACC, reflecting value destruction. Growth prospects hinge on innovation and global market penetration to counteract declining profitability.
Intangible Assets vs. Specialized Automation: The Moat Verdict
Cummins possesses a wider, more sustainable moat through its intangible assets and diversified offerings, sustaining value creation despite margin pressures. JBTM’s narrower moat and declining ROIC leave it vulnerable to market disruption. Cummins stands better positioned to defend and grow its market share in 2026.
Which stock offers better returns?
Over the past year, Cummins Inc. and JBT Marel Corporation both experienced significant price gains, with Cummins showing stronger acceleration and higher volatility in trading dynamics.
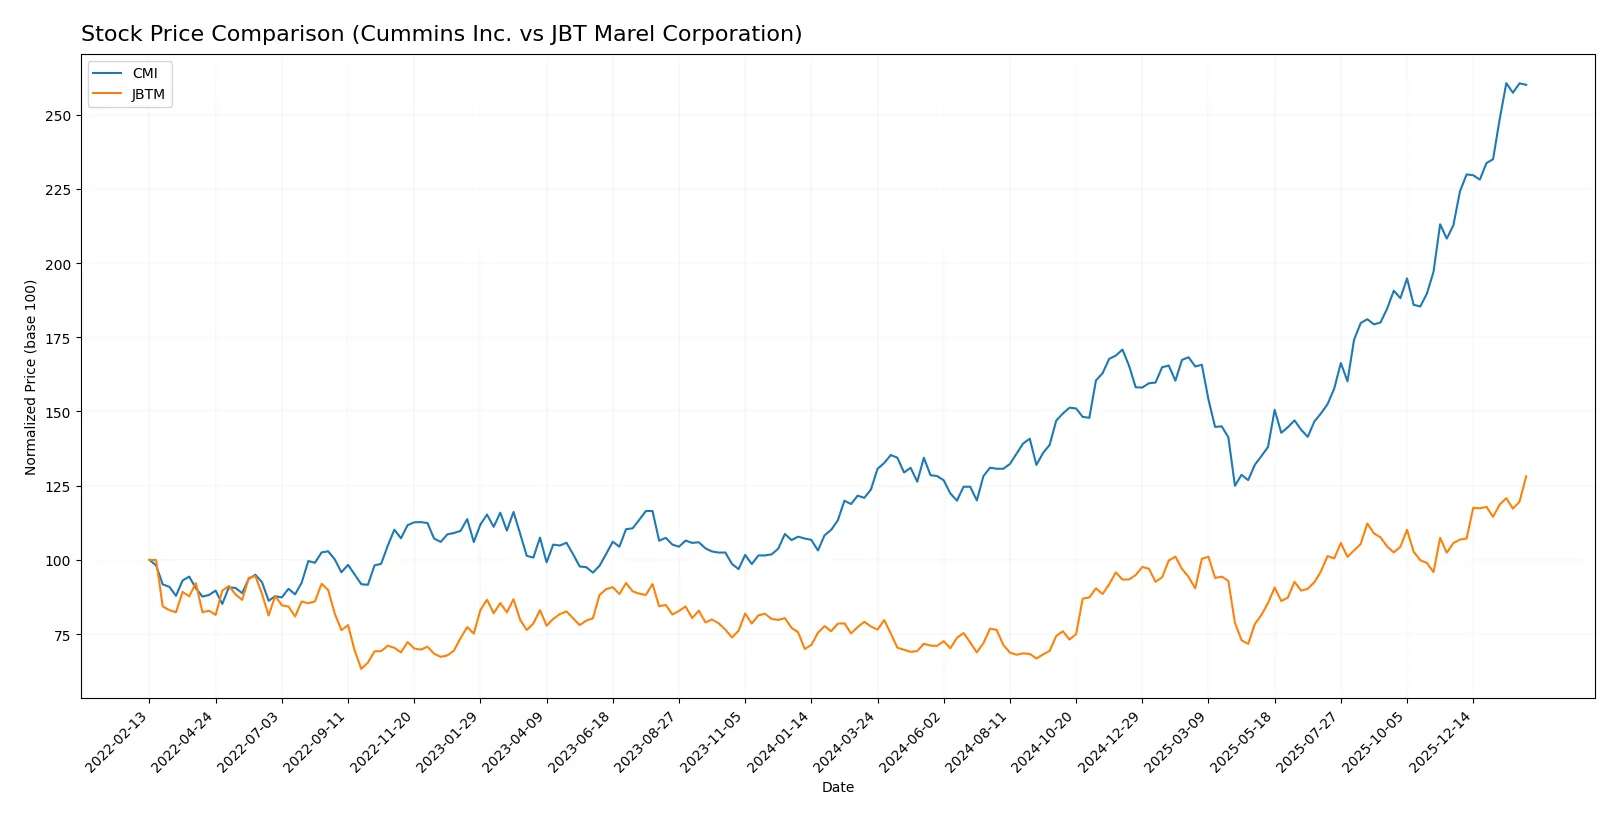
Trend Comparison
Cummins Inc. posted a 110.21% price increase over 12 months, indicating a bullish trend with accelerating momentum and a high volatility standard deviation of 79.49. Its price ranged from 266.48 to 578.94.
JBT Marel Corporation gained 65.2% in the same period, also bullish with acceleration but lower volatility at 20.79 standard deviation. Its price moved between 87.85 and 168.55.
Cummins outperformed JBT Marel with a higher total price appreciation and stronger acceleration, delivering the best market performance over the past year.
Target Prices
Analyst consensus sets clear price targets for both Cummins Inc. and JBT Marel Corporation, reflecting moderate upside potential.
| Company | Target Low | Target High | Consensus |
|---|---|---|---|
| Cummins Inc. | 540 | 703 | 606.1 |
| JBT Marel Corporation | 169 | 180 | 174.5 |
Cummins trades near 578, with analysts expecting a 5%+ upside to consensus 606.1. JBTM trades slightly below consensus, signaling limited but positive growth expectations.

Don’t Let Luck Decide Your Entry Point
Optimize your entry points with our advanced ProRealTime indicators. You’ll get efficient buy signals with precise price targets for maximum performance. Start outperforming now!
How do institutions grade them?
This section compares the latest institutional grades assigned to Cummins Inc. and JBT Marel Corporation:
Cummins Inc. Grades
The following table summarizes recent grades from major grading companies for Cummins Inc.
| Grading Company | Action | New Grade | Date |
|---|---|---|---|
| Truist Securities | Maintain | Buy | 2026-02-06 |
| Wolfe Research | Downgrade | Peer Perform | 2026-01-26 |
| Barclays | Maintain | Overweight | 2026-01-23 |
| Wells Fargo | Maintain | Overweight | 2026-01-23 |
| JP Morgan | Maintain | Neutral | 2026-01-14 |
| Citigroup | Maintain | Buy | 2026-01-13 |
| Raymond James | Upgrade | Outperform | 2025-12-22 |
| Barclays | Upgrade | Overweight | 2025-12-19 |
| Truist Securities | Maintain | Buy | 2025-12-18 |
| Citigroup | Maintain | Buy | 2025-12-11 |
JBT Marel Corporation Grades
Below is a summary of available recent grades from recognized institutions for JBT Marel Corporation.
| Grading Company | Action | New Grade | Date |
|---|---|---|---|
| Jefferies | Upgrade | Buy | 2025-12-10 |
| William Blair | Upgrade | Outperform | 2025-08-06 |
Which company has the best grades?
Cummins Inc. holds a broader range of institutional opinions, mostly Buy and Overweight grades, with a recent downgrade to Peer Perform. JBT Marel Corporation’s fewer grades are positive, including upgrades to Buy and Outperform. Investors may view Cummins’ wider analyst coverage as offering a more nuanced consensus, while JBT’s recent upgrades reflect upward momentum but less breadth.
Risks specific to each company
The following categories identify the critical pressure points and systemic threats facing both firms in the 2026 market environment:
1. Market & Competition
Cummins Inc.
- Large industrial machinery player with diversified powertrain and emission solutions faces intense competition and evolving tech demands.
JBT Marel Corporation
- Niche food and beverage tech provider with limited scale contends with specialized competitors and innovation cycles.
2. Capital Structure & Debt
Cummins Inc.
- Moderate debt-to-equity ratio at 0.59 with strong interest coverage limits financial risk.
JBT Marel Corporation
- Higher leverage at 0.81 and weaker interest coverage increase vulnerability to rising rates.
3. Stock Volatility
Cummins Inc.
- Beta at 1.12 indicates stock moves moderately with the market, reflecting industrial sector cyclicality.
JBT Marel Corporation
- Lower beta of 0.98 suggests less sensitivity but also potentially muted upside in bull markets.
4. Regulatory & Legal
Cummins Inc.
- Exposure to emissions regulations globally poses compliance costs but also drives product innovation.
JBT Marel Corporation
- Food safety and international trade regulations create ongoing operational risks and compliance costs.
5. Supply Chain & Operations
Cummins Inc.
- Complex global supply chain for engines and power systems vulnerable to raw material price swings.
JBT Marel Corporation
- Supply chain focused on food processing tech, reliant on specialized components and logistics stability.
6. ESG & Climate Transition
Cummins Inc.
- Leading in electrification and hydrogen tech; ESG initiatives support long-term resilience and brand strength.
JBT Marel Corporation
- ESG efforts are important but less pronounced; climate transition risks tied to energy use and packaging waste.
7. Geopolitical Exposure
Cummins Inc.
- Operates globally with exposure to trade tensions and tariffs impacting supply chains and sales.
JBT Marel Corporation
- Also global but more concentrated in food sectors; sensitive to regional trade barriers and geopolitical instability.
Which company shows a better risk-adjusted profile?
Cummins faces high regulatory and supply chain risks but benefits from stronger financial health and innovation leadership. JBT Marel struggles with weaker profitability, higher leverage, and a weaker financial safety net. Cummins’ Altman Z-Score at 4.77 places it safely above distress, while JBT’s 1.96 signals moderate financial risk. The stronger ROIC and interest coverage at Cummins further illustrate its resilience. I see Cummins as the better risk-adjusted investment given its favorable capital structure and robust market positioning despite industrial cyclicality.
Final Verdict: Which stock to choose?
Cummins Inc. showcases a superpower in generating solid returns on invested capital well above its cost of capital, signaling value creation despite a recent dip in profitability. Its sturdy balance sheet and operational efficiency make it a potential fit for investors seeking aggressive growth with a tolerance for cyclical fluctuations. A point of vigilance remains its stretched price-to-book ratio, hinting at a premium valuation.
JBT Marel Corporation benefits from a niche strategic moat supported by steady gross margins and a strong current ratio, reflecting prudent liquidity management. However, its weaker profitability metrics and declining returns on capital suggest a more cautious profile. Compared to Cummins, JBT Marel offers better short-term stability but less compelling value creation, suiting investors prioritizing growth at a reasonable price with a defensive stance.
If you prioritize aggressive growth backed by proven capital efficiency and a history of value creation, Cummins outshines due to its robust ROIC and operational leverage. However, if you seek a more stable investment with solid liquidity and a narrower moat, JBT Marel offers better stability but at the cost of lower profitability and value destruction risks. Each scenario demands careful alignment with your portfolio’s risk tolerance and strategic goals.
Disclaimer: Investment carries a risk of loss of initial capital. The past performance is not a reliable indicator of future results. Be sure to understand risks before making an investment decision.
Go Further
I encourage you to read the complete analyses of Cummins Inc. and JBT Marel Corporation to enhance your investment decisions: