Home > Comparison > Industrials > CMI vs IR
The strategic rivalry between Cummins Inc. and Ingersoll Rand Inc. shapes the industrial machinery sector’s competitive landscape. Cummins, a diversified engine and power solutions leader, contrasts with Ingersoll Rand’s focused expertise in air, fluid, and precision technologies. This analysis pits Cummins’ broad capital-intensive model against Ingersoll Rand’s specialized industrial approach. I will assess which company’s trajectory offers superior risk-adjusted returns for a diversified portfolio amidst evolving market dynamics.
Table of contents
Companies Overview
Cummins Inc. and Ingersoll Rand Inc. stand as key players in the industrial machinery market, each shaping its landscape.
Cummins Inc.: Global Powertrain Innovator
Cummins Inc. commands the heavy and medium-duty engine market by designing and servicing diesel, natural gas, and electrified powertrains. Its revenue hinges on diversified segments, including engines, power systems, and aftermarket parts. In 2026, Cummins focuses strategically on expanding its electrification and emission solutions to meet evolving global standards.
Ingersoll Rand Inc.: Industrial Technologies Specialist
Ingersoll Rand Inc. excels in providing air, fluid, and energy technologies critical to industrial and medical sectors worldwide. Its core revenue derives from manufacturing air compressors, pumps, and precision fluid management systems. The company’s 2026 strategy emphasizes innovation in mission-critical equipment and expanding its integrated sales network across global markets.
Strategic Collision: Similarities & Divergences
Both companies excel in industrial machinery but diverge sharply in focus—Cummins drives powertrain electrification while Ingersoll Rand leads with specialized fluid and air solutions. They compete primarily in aftermarket services and technology innovation. Cummins offers a broad powertrain ecosystem; Ingersoll Rand’s niche precision technologies create distinct investment profiles with unique risk-reward trade-offs.
Income Statement Comparison
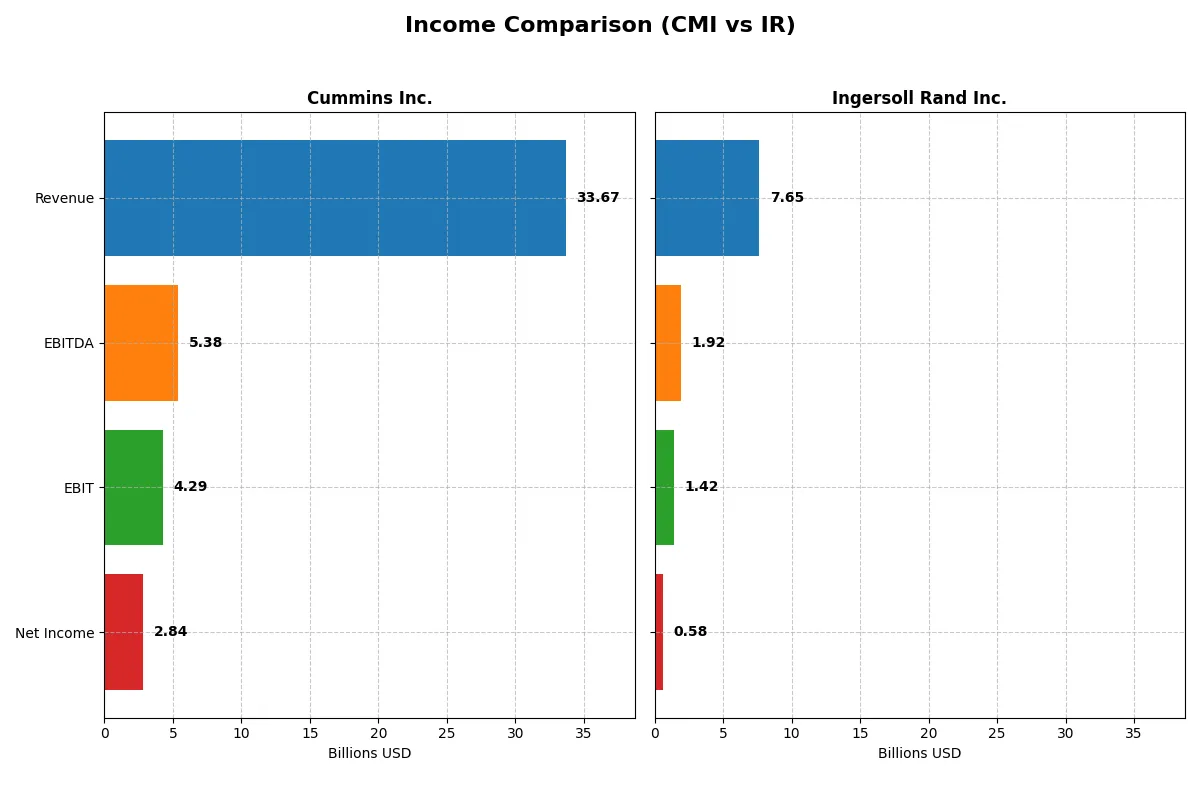
This data dissects the core profitability and scalability of both corporate engines to reveal who dominates the bottom line:
| Metric | Cummins Inc. (CMI) | Ingersoll Rand Inc. (IR) |
|---|---|---|
| Revenue | 33.7B | 7.65B |
| Cost of Revenue | 25.15B | 4.70B |
| Operating Expenses | 4.52B | 1.53B |
| Gross Profit | 8.52B | 2.95B |
| EBITDA | 5.39B | 1.92B |
| EBIT | 4.29B | 1.42B |
| Interest Expense | 329M | 254M |
| Net Income | 2.84B | 581M |
| EPS | 20.62 | 1.46 |
| Fiscal Year | 2025 | 2025 |
Income Statement Analysis: The Bottom-Line Duel
This income statement comparison uncovers which company converts revenue into profits more efficiently across recent fiscal years.
Cummins Inc. Analysis
Cummins’ revenue grew steadily from $24B in 2021 to $34B in 2024, then slightly dipped to $33.7B in 2025. Net income surged from $2.13B in 2021 to $3.95B in 2024 before retreating to $2.84B in 2025. Gross margin remains robust near 25%, while net margin holds a favorable 8.4%. The 2025 dip signals margin pressure despite operational efficiency.
Ingersoll Rand Inc. Analysis
Ingersoll Rand expanded revenue from $5.15B in 2021 to $7.65B in 2025, with net income rising modestly from $563M to $838M in 2024, then falling to $581M in 2025. Gross margin stands higher at 38.5%, and EBIT margin is a healthy 18.5%. However, a recent net margin decline to 7.6% highlights challenges in maintaining bottom-line growth.
Margin Power vs. Revenue Scale
Cummins delivers superior scale with higher absolute profits, but its margins are thinner than Ingersoll Rand’s. Ingersoll Rand boasts stronger profitability ratios, yet lower net income and recent earnings softness limit momentum. For investors, Cummins offers volume-driven earnings, while Ingersoll Rand presents a leaner, margin-focused profile.
Financial Ratios Comparison
These vital ratios act as a diagnostic tool to expose the underlying fiscal health, valuation premiums, and capital efficiency of the companies analyzed:
| Ratios | Cummins Inc. (CMI) | Ingersoll Rand Inc. (IR) |
|---|---|---|
| ROE | 23.0% | 5.8% |
| ROIC | 12.0% | 6.4% |
| P/E | 24.8 | 54.2 |
| P/B | 5.7 | 3.1 |
| Current Ratio | 1.76 | 2.06 |
| Quick Ratio | 1.16 | 1.49 |
| D/E (Debt-to-Equity) | 0.59 | 0.47 |
| Debt-to-Assets | 21.3% | 26.1% |
| Interest Coverage | 12.1 | 5.6 |
| Asset Turnover | 0.99 | 0.42 |
| Fixed Asset Turnover | 4.84 | 8.22 |
| Payout Ratio | 37.1% | 5.5% |
| Dividend Yield | 1.50% | 0.10% |
| Fiscal Year | 2025 | 2025 |
Efficiency & Valuation Duel: The Vital Signs
Financial ratios serve as the company’s DNA, uncovering hidden risks and operational excellence essential for informed investment decisions.
Cummins Inc.
Cummins demonstrates strong profitability with a 23.02% ROE and a favorable 12.01% ROIC, indicating efficient capital use. Its P/E ratio of 24.76 is neutral, suggesting fair valuation, though a 5.7 P/B ratio appears stretched. Cummins returns value via a modest 1.5% dividend yield, balancing shareholder paybacks with steady reinvestment in R&D (4.1% of revenue).
Ingersoll Rand Inc.
Ingersoll Rand shows weaker profitability, with a 5.76% ROE and a neutral 6.36% ROIC, reflecting less efficient capital deployment. The stock trades at an expensive P/E of 54.24, signaling high valuation risk. Its dividend yield is negligible at 0.1%, highlighting limited direct shareholder returns and a focus on growth reinvestment, though less R&D data is disclosed.
Operational Efficiency vs. Valuation Stretch
Cummins offers a more attractive balance of profitability and valuation, with efficient capital use and consistent dividends. In contrast, Ingersoll Rand’s high valuation and lower returns signal greater risk. Investors favoring stable operational efficiency may prefer Cummins, while those seeking growth exposure might consider Ingersoll Rand’s profile.
Which one offers the Superior Shareholder Reward?
I compare Cummins Inc. (CMI) and Ingersoll Rand Inc. (IR) on dividend yield, payout ratio, and buyback intensity. CMI yields 1.5% with a 37% payout, supported by solid free cash flow coverage (1.58x). IR pays a negligible 0.1% dividend with a 5.5% payout ratio but channels most free cash flow into aggressive buybacks. IR’s buyback-driven model suits growth investors seeking capital appreciation. CMI’s balanced dividend and buyback approach suits income-focused investors valuing sustainability. Given IR’s higher free cash flow conversion (90%) and low payout, its buyback strategy offers a superior total return potential in 2026. I favor IR for total shareholder reward despite the low dividend yield.
Comparative Score Analysis: The Strategic Profile
The radar chart reveals the fundamental DNA and trade-offs of Cummins Inc. and Ingersoll Rand Inc., highlighting their strategic strengths and vulnerabilities:
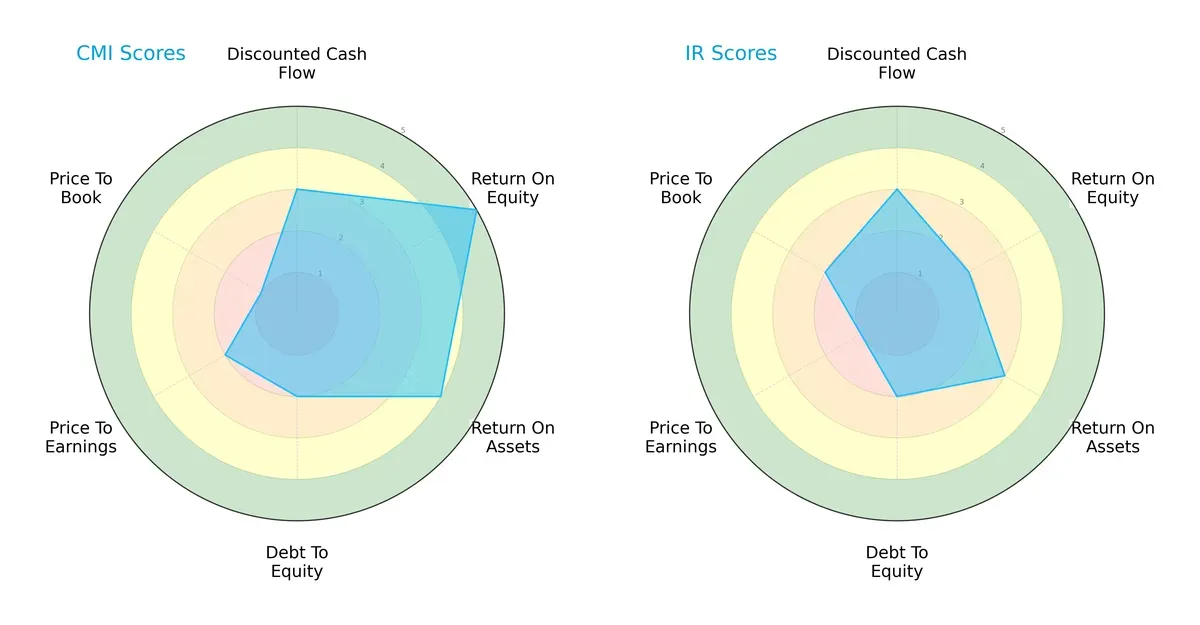
Cummins leads with superior profitability metrics, boasting a very favorable ROE (5) and a favorable ROA (4), while Ingersoll Rand lags with weaker returns (ROE 2, ROA 3). Both firms share unfavorable debt-to-equity scores (2), signaling leverage concerns. Valuation scores show Cummins as more stretched on P/E (2) and extremely weak on P/B (1), whereas Ingersoll Rand’s valuation appears cheaper but still unfavorable. Cummins offers a more balanced profile anchored by operational efficiency, while Ingersoll Rand relies on modest asset utilization but trades at more attractive multiples.
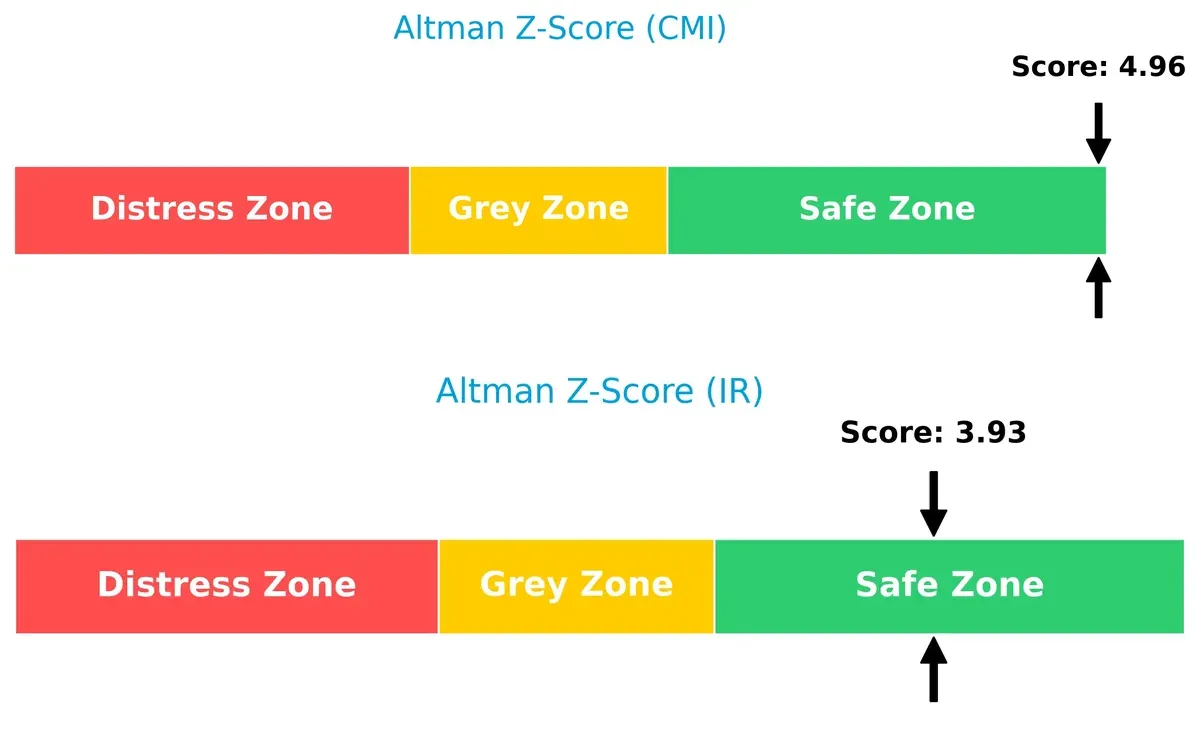
Bankruptcy Risk: Solvency Showdown
Cummins (Altman Z-Score 4.96) and Ingersoll Rand (3.93) both sit comfortably in the safe zone, but Cummins’ higher score indicates stronger financial resilience and lower bankruptcy risk in this economic cycle:
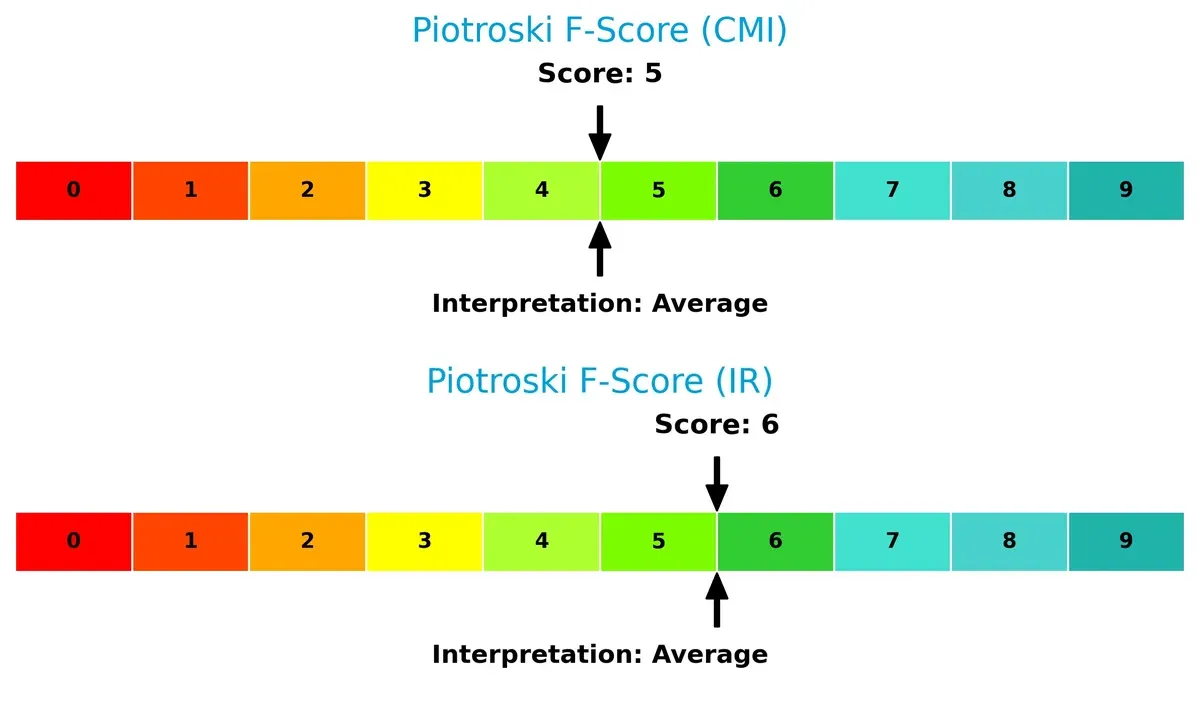
Financial Health: Quality of Operations
Cummins scores a 5 on the Piotroski F-Score, while Ingersoll Rand edges slightly higher at 6, suggesting both companies maintain average financial health with no glaring internal red flags for investors at this time:
How are the two companies positioned?
This section dissects the operational DNA of Cummins and Ingersoll Rand by comparing their revenue distribution and internal dynamics. The goal is to confront their economic moats and identify which model offers the most resilient competitive advantage today.
Revenue Segmentation: The Strategic Mix
The following comparison dissects how Cummins Inc. and Ingersoll Rand Inc. diversify their income streams and where their primary sector bets lie:
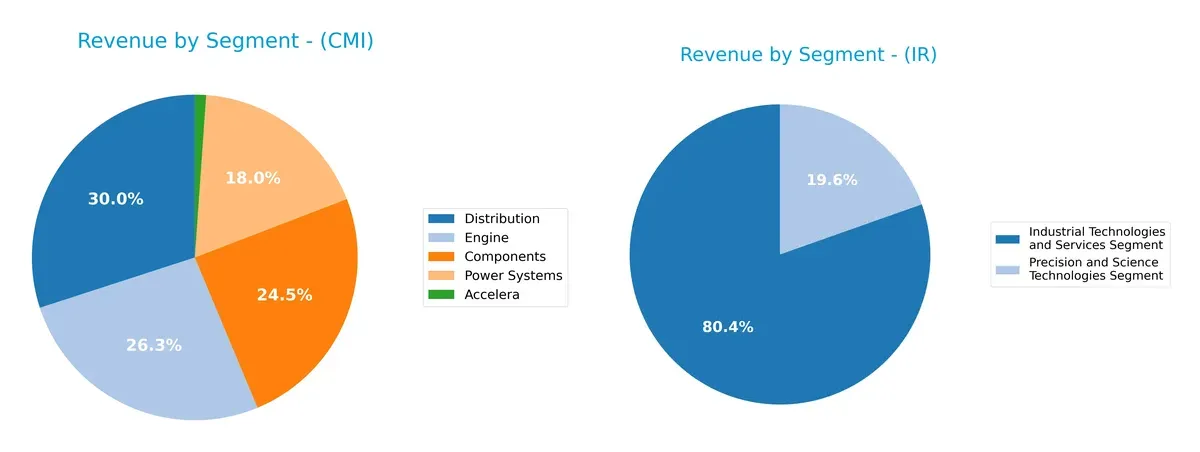
Cummins Inc. anchors its revenue around four robust segments: Distribution at $12.4B, Engine at $10.9B, Components at $10.1B, and Power Systems at $7.5B. This mix reflects a balanced industrial ecosystem with infrastructure dominance and product breadth. In contrast, Ingersoll Rand leans heavily on its Industrial Technologies and Services segment at $5.8B, with a smaller Precision and Science Technologies segment at $1.4B. Cummins’ diversified portfolio reduces concentration risk, while Ingersoll Rand pivots on a narrower, service-focused base.
Strengths and Weaknesses Comparison
This table compares the strengths and weaknesses of Cummins Inc. and Ingersoll Rand Inc. based on diversification, profitability, financials, innovation, global presence, and market share:
Cummins Inc. Strengths
- Diverse product segments including Engines, Components, Power Systems
- Strong profitability with ROE 23% and ROIC 12% above WACC
- Favorable liquidity ratios with current ratio 1.76 and interest coverage 13
- Solid global presence with $19B US and $9.7B Non-US revenue
- Balanced market share across multiple industries
Ingersoll Rand Inc. Strengths
- Favorable liquidity and leverage with current ratio 2.06 and debt-to-assets 26%
- Strong fixed asset turnover at 8.22 indicates efficient asset use
- Geographic diversification across Americas, Asia Pacific, EMEA
- Presence in Industrial Technologies and Precision Science segments
- Maintains favorable interest coverage at 5.58 despite lower profitability
Cummins Inc. Weaknesses
- Price-to-book ratio high at 5.7 signals overvaluation risk
- Neutral net margin 8.44% and PE ratio 24.76 limit valuation upside
- Moderate debt-to-equity at 0.59 could constrain flexibility
- Limited recent segment innovation indicated by static new power revenue
- Market concentration with $19B US revenue may limit growth
Ingersoll Rand Inc. Weaknesses
- Low ROE at 5.76% and neutral ROIC 6.36% raise profitability concerns
- High PE of 54.24 and unfavorable PB 3.13 suggest valuation risk
- Low asset turnover 0.42 signals operational inefficiency
- Dividend yield very low at 0.1% may deter income-focused investors
- Net margin at 7.6% is neutral, limiting competitiveness
Cummins benefits from strong profitability and diversified segments supporting US and international markets. Ingersoll Rand has favorable liquidity and asset efficiency but faces challenges in profitability and valuation. These factors highlight differing strategic priorities and operational focuses.
The Moat Duel: Analyzing Competitive Defensibility
A structural moat is the only barrier protecting long-term profits from relentless competition erosion. Let’s dissect the competitive moats of two industrial machinery giants:
Cummins Inc.: Intangible Assets and Diversified Product Ecosystem
Cummins leverages strong intangible assets—patented engine technologies and a broad powertrain portfolio. Its 3.6% ROIC premium over WACC signals value creation, despite a slight ROIC decline. New electrification and hydrogen initiatives could deepen its moat in 2026.
Ingersoll Rand Inc.: Operational Efficiency and Growth Momentum
Ingersoll Rand’s moat stems from operational efficiency and a growing ROIC trend, reflecting effective capital allocation. Unlike Cummins, it currently sheds value with ROIC below WACC, but expanding industrial technologies and precision solutions fuel profitability gains ahead.
ROIC Premium vs. Growth Momentum: Who Defends the Turf Better?
Cummins boasts a wider moat with consistent value creation, while Ingersoll Rand shows promising ROIC growth but remains value destructive. Cummins is better positioned to defend its market share amid intensifying industry competition.
Which stock offers better returns?
Over the past year, Cummins Inc. and Ingersoll Rand Inc. both showed upward price trends, with Cummins exhibiting strong acceleration and wider price swings compared to Ingersoll Rand’s steadier rise.
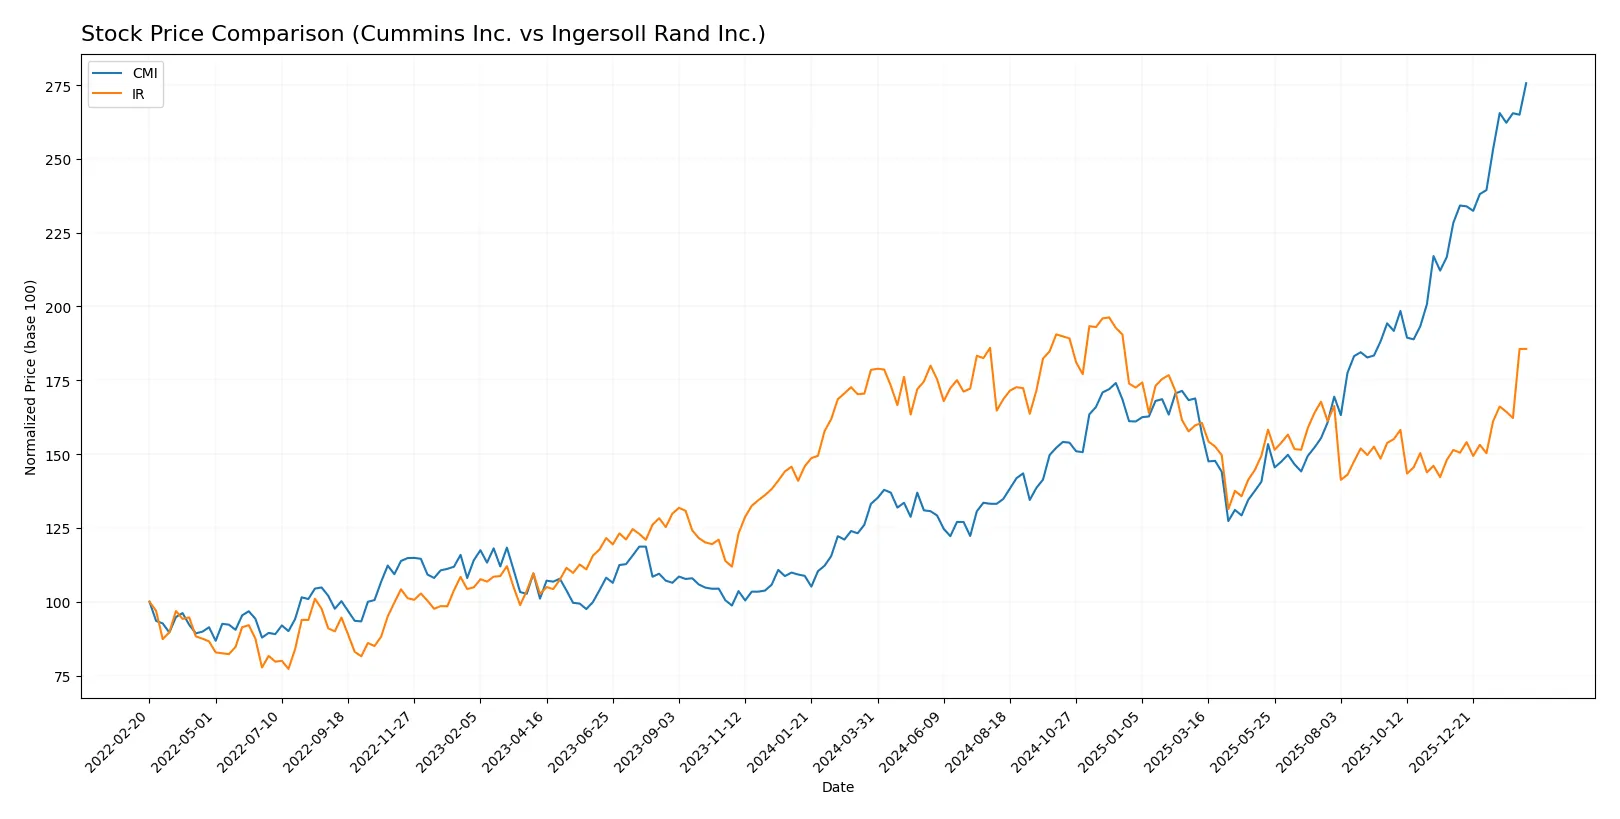
Trend Comparison
Cummins Inc. posted a 107% price increase over the past 12 months, marking a bullish trend with accelerating momentum and a high volatility standard deviation of 82.55.
Ingersoll Rand Inc. delivered a 3.99% gain over the same period, also bullish with acceleration, but with far lower volatility at a standard deviation of 8.19.
Cummins clearly outperformed Ingersoll Rand in market returns, showing significantly higher price appreciation and greater trading volatility.
Target Prices
Analysts present a moderately bullish consensus for Cummins Inc. and Ingersoll Rand Inc.
| Company | Target Low | Target High | Consensus |
|---|---|---|---|
| Cummins Inc. | 540 | 703 | 618.4 |
| Ingersoll Rand Inc. | 87 | 100 | 93 |
Cummins trades near $601, just below its $618 consensus, implying modest upside. Ingersoll Rand, at $98.52, is close to its $93 consensus, suggesting price stability or slight overvaluation.

Don’t Let Luck Decide Your Entry Point
Optimize your entry points with our advanced ProRealTime indicators. You’ll get efficient buy signals with precise price targets for maximum performance. Start outperforming now!
How do institutions grade them?
The following tables summarize recent grades assigned by reputable financial institutions for Cummins Inc. and Ingersoll Rand Inc.:
Cummins Inc. Grades
This table lists recent grades and actions from well-known grading companies for Cummins Inc.:
| Grading Company | Action | New Grade | Date |
|---|---|---|---|
| Raymond James | Maintain | Outperform | 2026-02-09 |
| Truist Securities | Maintain | Buy | 2026-02-06 |
| Wolfe Research | Downgrade | Peer Perform | 2026-01-26 |
| Barclays | Maintain | Overweight | 2026-01-23 |
| Wells Fargo | Maintain | Overweight | 2026-01-23 |
| JP Morgan | Maintain | Neutral | 2026-01-14 |
| Citigroup | Maintain | Buy | 2026-01-13 |
| Raymond James | Upgrade | Outperform | 2025-12-22 |
| Barclays | Upgrade | Overweight | 2025-12-19 |
| Truist Securities | Maintain | Buy | 2025-12-18 |
Ingersoll Rand Inc. Grades
This table shows recent grades and actions from recognized grading companies for Ingersoll Rand Inc.:
| Grading Company | Action | New Grade | Date |
|---|---|---|---|
| Stifel | Maintain | Hold | 2026-01-23 |
| Citigroup | Maintain | Buy | 2026-01-12 |
| Wells Fargo | Maintain | Overweight | 2026-01-07 |
| Stifel | Maintain | Hold | 2025-12-16 |
| Citigroup | Maintain | Buy | 2025-12-08 |
| Citigroup | Maintain | Buy | 2025-11-03 |
| Baird | Maintain | Outperform | 2025-11-03 |
| Stifel | Maintain | Hold | 2025-10-20 |
| Wells Fargo | Maintain | Overweight | 2025-10-06 |
| Morgan Stanley | Maintain | Equal Weight | 2025-08-13 |
Which company has the best grades?
Cummins Inc. generally holds higher and more consistent grades, including multiple Outperform and Overweight ratings. Ingersoll Rand shows a mix of Buy and Hold grades with fewer upgrades. Investors may interpret Cummins’ stronger grades as a sign of more favorable analyst sentiment and potential market confidence.
Risks specific to each company
The following categories identify the critical pressure points and systemic threats facing both firms in the 2026 market environment:
1. Market & Competition
Cummins Inc. (CMI)
- Faces intense competition in diesel and hybrid powertrains; strong brand and diversified segments provide resilience.
Ingersoll Rand Inc. (IR)
- Operates in specialized industrial tech markets; higher beta indicates greater sensitivity to market swings and competition.
2. Capital Structure & Debt
Cummins Inc. (CMI)
- Debt-to-equity moderate at 0.59; interest coverage strong at 13.05x, showing sound debt management.
Ingersoll Rand Inc. (IR)
- Lower debt-to-equity at 0.47 but weaker interest coverage at 5.58x, which may constrain financial flexibility.
3. Stock Volatility
Cummins Inc. (CMI)
- Beta of 1.12 suggests moderate volatility, slightly above market average.
Ingersoll Rand Inc. (IR)
- Higher beta at 1.31 signals greater stock price fluctuations, increasing investor risk.
4. Regulatory & Legal
Cummins Inc. (CMI)
- Exposure to emissions regulations due to engine manufacturing; ongoing transition to clean technologies mitigates risk.
Ingersoll Rand Inc. (IR)
- Faces regulatory scrutiny in industrial and medical tech sectors; compliance costs could pressure margins.
5. Supply Chain & Operations
Cummins Inc. (CMI)
- Complex global supply chain for engines and components; strong operational scale reduces disruption risks.
Ingersoll Rand Inc. (IR)
- Smaller workforce and specialized products increase vulnerability to supply chain shocks.
6. ESG & Climate Transition
Cummins Inc. (CMI)
- Actively developing electrified power systems; ESG initiatives align with industry trends, supporting long-term growth.
Ingersoll Rand Inc. (IR)
- Transitioning in fluid and energy tech but slower ROE may reflect challenges in ESG execution.
7. Geopolitical Exposure
Cummins Inc. (CMI)
- Global footprint in heavy machinery ties exposure to trade tensions and tariffs, especially in emerging markets.
Ingersoll Rand Inc. (IR)
- Significant international sales in volatile regions; higher operational risk amid geopolitical instability.
Which company shows a better risk-adjusted profile?
Cummins Inc. faces its biggest risk from regulatory pressures amid an industry shift to cleaner powertrains. Ingersoll Rand’s primary risk lies in its higher stock volatility and weaker returns on equity. Cummins exhibits a stronger risk-adjusted profile with healthier financial metrics and more robust interest coverage. Its recent Altman Z-score of nearly 5 confirms strong financial stability, while Ingersoll Rand’s elevated beta and less favorable capital efficiency warrant caution.
Final Verdict: Which stock to choose?
Cummins Inc. stands out for its superpower in delivering strong returns on equity and invested capital, showcasing efficient capital allocation. Its main point of vigilance is a relatively high price-to-book ratio, which could signal valuation risk. Cummins fits well in an aggressive growth portfolio aiming for durable value creation.
Ingersoll Rand Inc. offers a strategic moat rooted in its operational efficiency and improving profitability trend, despite currently shedding value. It provides a safer liquidity profile and lower leverage relative to Cummins. This stock appeals more to investors seeking growth at a reasonable price with a focus on stability.
If you prioritize robust capital efficiency and proven value creation, Cummins commands attention for its superior ROE and ROIC profile. However, if you seek improving profitability with a more conservative balance sheet, Ingersoll Rand offers better stability and an attractive growth trajectory. Both present analytical scenarios for different investor risk appetites and time horizons.
Disclaimer: Investment carries a risk of loss of initial capital. The past performance is not a reliable indicator of future results. Be sure to understand risks before making an investment decision.
Go Further
I encourage you to read the complete analyses of Cummins Inc. and Ingersoll Rand Inc. to enhance your investment decisions: