Home > Comparison > Industrials > ITW vs CMI
The strategic rivalry between Illinois Tool Works Inc. and Cummins Inc. defines the current trajectory of the industrial machinery sector. Illinois Tool Works operates as a diversified industrial products manufacturer across multiple segments, while Cummins Inc. focuses on designing and producing advanced engines and power systems. This head-to-head reflects a contest between broad-based industrial manufacturing and specialized powertrain innovation. This analysis aims to uncover which corporate strategy offers superior risk-adjusted returns for a diversified portfolio.
Table of contents
Companies Overview
Illinois Tool Works Inc. and Cummins Inc. anchor critical niches in the industrial machinery sector, shaping global manufacturing and power solutions.
Illinois Tool Works Inc.: Industrial Innovator with Diverse Segments
Illinois Tool Works Inc. stands as a diversified industrial manufacturer. Its revenue derives from seven segments, including Automotive OEM components, Food Equipment, and Welding products. In 2026, the company emphasizes expanding its engineered fastening systems and specialty product lines, leveraging direct distribution and independent distributors worldwide.
Cummins Inc.: Powertrain and Engine Leader
Cummins Inc. dominates as a global designer and manufacturer of engines and power solutions. It generates revenue from diesel and natural gas engines, electrified powertrains, and related components across five segments. The 2026 strategic focus centers on advancing electric and hybrid power systems alongside traditional engine markets, targeting sustainable transportation and industrial applications.
Strategic Collision: Similarities & Divergences
Both firms operate in industrial machinery but diverge sharply in product focus. Illinois Tool Works pursues a broad segment diversification strategy, while Cummins concentrates on powertrains and electrification. Their primary battleground lies in industrial innovation and sustainability adoption. This contrast shapes distinct investment profiles: Illinois Tool Works offers broad industrial exposure; Cummins bets on energy transition and mobility evolution.
Income Statement Comparison
This data dissects the core profitability and scalability of both corporate engines to reveal who dominates the bottom line:
| Metric | Illinois Tool Works Inc. (ITW) | Cummins Inc. (CMI) |
|---|---|---|
| Revenue | 16B | 34B |
| Cost of Revenue | 9B | 25B |
| Operating Expenses | 2.9B | 4.5B |
| Gross Profit | 7.1B | 8.5B |
| EBITDA | 4.6B | 5.4B |
| EBIT | 4.3B | 4.3B |
| Interest Expense | 292M | 329M |
| Net Income | 3.1B | 2.8B |
| EPS | 10.52 | 20.62 |
| Fiscal Year | 2025 | 2025 |
Income Statement Analysis: The Bottom-Line Duel
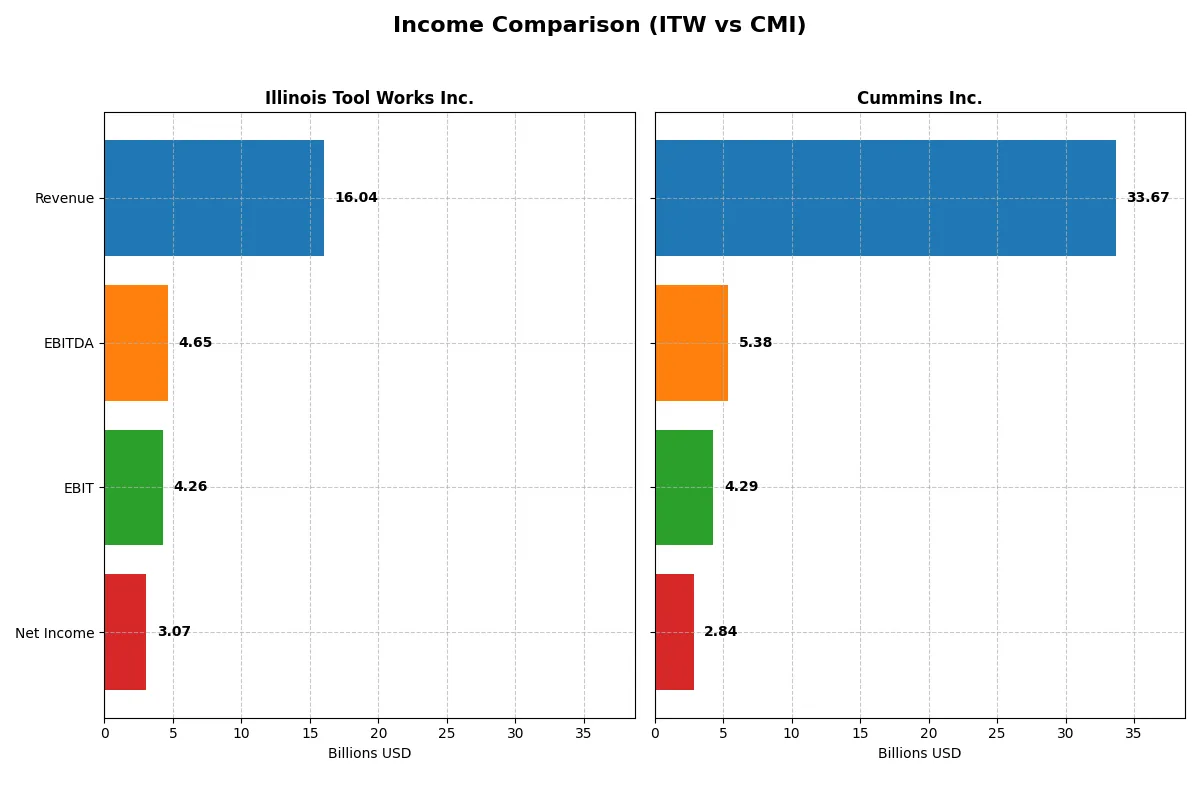
The income statement comparison reveals which company converts sales into profits most efficiently, exposing the strength of each business model.
Illinois Tool Works Inc. (ITW) Analysis
ITW’s revenue grew modestly to $16B in 2025, with net income at $3.07B. Its gross margin sustains a strong 44.1%, and net margin remains favorable at 19.1%. Despite a slight decline in EBIT and net income growth last year, ITW shows consistent long-term earnings expansion and margin resilience, signaling operational efficiency.
Cummins Inc. (CMI) Analysis
CMI posted $33.7B revenue in 2025, with net income of $2.84B. Gross margin stands at a solid 25.3%, though net margin is lower at 8.4%. Recent results show a 1.3% revenue decline and steeper EBIT and net income drops, reflecting margin pressure. Nevertheless, CMI’s overall five-year revenue and EPS growth outpace ITW, highlighting robust top-line momentum.
Margin Strength vs. Growth Trajectory
ITW leads in margin robustness and bottom-line efficiency, delivering higher profitability ratios despite slower revenue growth. CMI offers superior revenue and EPS growth but at the cost of compressed margins and recent profitability weakness. Investors favoring steady earnings and margin quality may prefer ITW, while those targeting growth might focus on CMI’s accelerating scale.
Financial Ratios Comparison
These vital ratios act as a diagnostic tool to expose the underlying fiscal health, valuation premiums, and capital efficiency of the companies analyzed:
| Ratios | Illinois Tool Works Inc. (ITW) | Cummins Inc. (CMI) |
|---|---|---|
| ROE | 95.07% | 23.02% |
| ROIC | 24.49% | 12.01% |
| P/E | 23.48 | 24.76 |
| P/B | 22.32 | 5.70 |
| Current Ratio | 1.21 | 1.76 |
| Quick Ratio | 0.89 | 1.16 |
| D/E | 2.78 | 0.59 |
| Debt-to-Assets | 55.54% | 21.30% |
| Interest Coverage | 14.44 | 12.14 |
| Asset Turnover | 0.99 | 0.99 |
| Fixed Asset Turnover | 7.19 | 4.84 |
| Payout ratio | 58.25% | 37.11% |
| Dividend yield | 2.48% | 1.50% |
| Fiscal Year | 2025 | 2025 |
Efficiency & Valuation Duel: The Vital Signs
Financial ratios act as a company’s DNA, unveiling hidden risks and operational precision beyond surface-level metrics.
Illinois Tool Works Inc.
ITW demonstrates exceptional profitability with a stellar 95.1% ROE and a robust 19.1% net margin, signaling operational excellence. The valuation appears fair with a neutral 23.5 P/E, though its high 22.3 P/B signals potential overvaluation. ITW rewards shareholders with a 2.48% dividend yield, balancing growth and income.
Cummins Inc.
CMI posts a modest 23.0% ROE and an 8.4% net margin, reflecting steady but less aggressive profitability. Its 24.8 P/E is neutral, while a lower 5.7 P/B suggests more reasonable valuation metrics. CMI maintains a conservative 1.5% dividend yield, prioritizing operational stability and moderate shareholder returns.
Premium Profitability vs. Conservative Stability
ITW leads with superior profitability metrics but carries higher leverage and valuation risks. CMI offers a more balanced risk profile with stronger liquidity and lower debt. Investors seeking high operational efficiency may prefer ITW; those favoring stability might lean toward CMI.
Which one offers the Superior Shareholder Reward?
I compare Illinois Tool Works (ITW) and Cummins Inc. (CMI) on shareholder rewards by analyzing dividends, payout ratios, and buybacks. ITW yields 2.48% with a 58% payout ratio, supported by solid free cash flow. CMI yields 1.5% with a lower 37% payout ratio but stronger free cash flow per share. Both maintain buyback programs, but ITW’s consistent buybacks and dividend growth signal a more sustainable model. CMI reinvests aggressively in capital expenditures, limiting immediate returns. I conclude ITW offers a superior total return profile in 2026 for income-focused investors seeking steady, sustainable rewards.
Comparative Score Analysis: The Strategic Profile
The radar chart reveals the fundamental DNA and strategic trade-offs of Illinois Tool Works Inc. and Cummins Inc.:
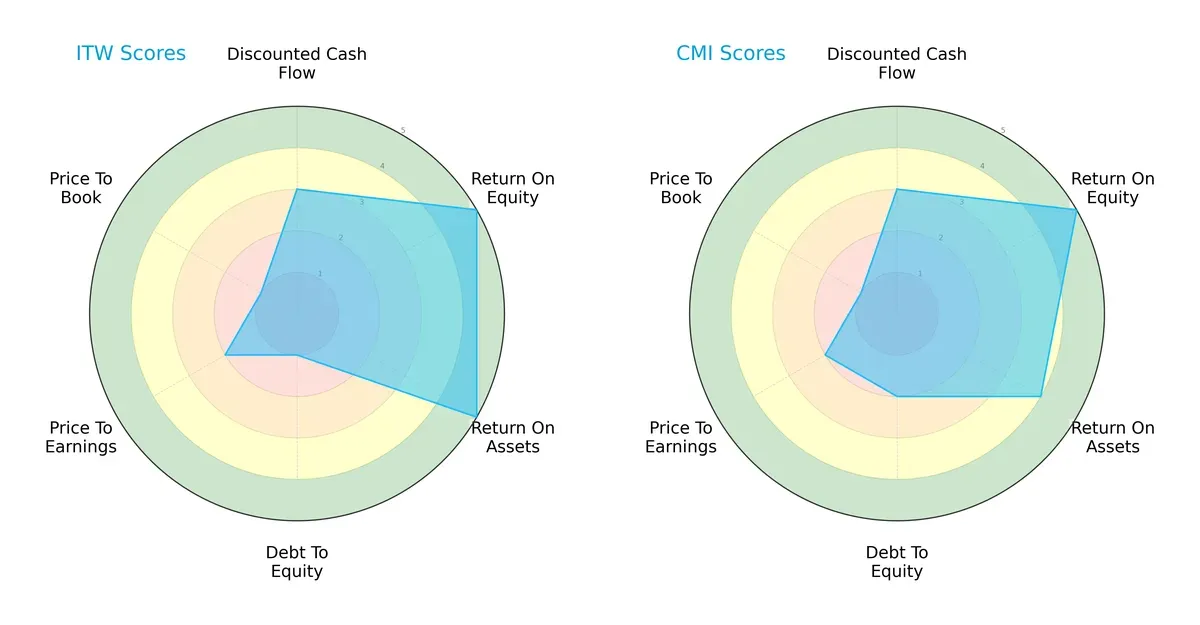
Illinois Tool Works (ITW) excels in return on assets and equity (scores of 5 each), signaling operational efficiency. Cummins (CMI) shows slightly lower asset utilization (ROA score 4) but edges out ITW in debt management with a better debt-to-equity score (2 vs. 1). Both firms share moderate discounted cash flow scores (3) and unfavorable valuation metrics (P/E and P/B). ITW’s profile is more skewed toward operational strength but carries higher financial leverage risk. CMI presents a more balanced risk-return trade-off, blending solid returns with stronger balance sheet discipline.
Bankruptcy Risk: Solvency Showdown
The Altman Z-Score gap favors Illinois Tool Works, scoring 8.5 versus Cummins’ 4.8, both safely above distress thresholds:
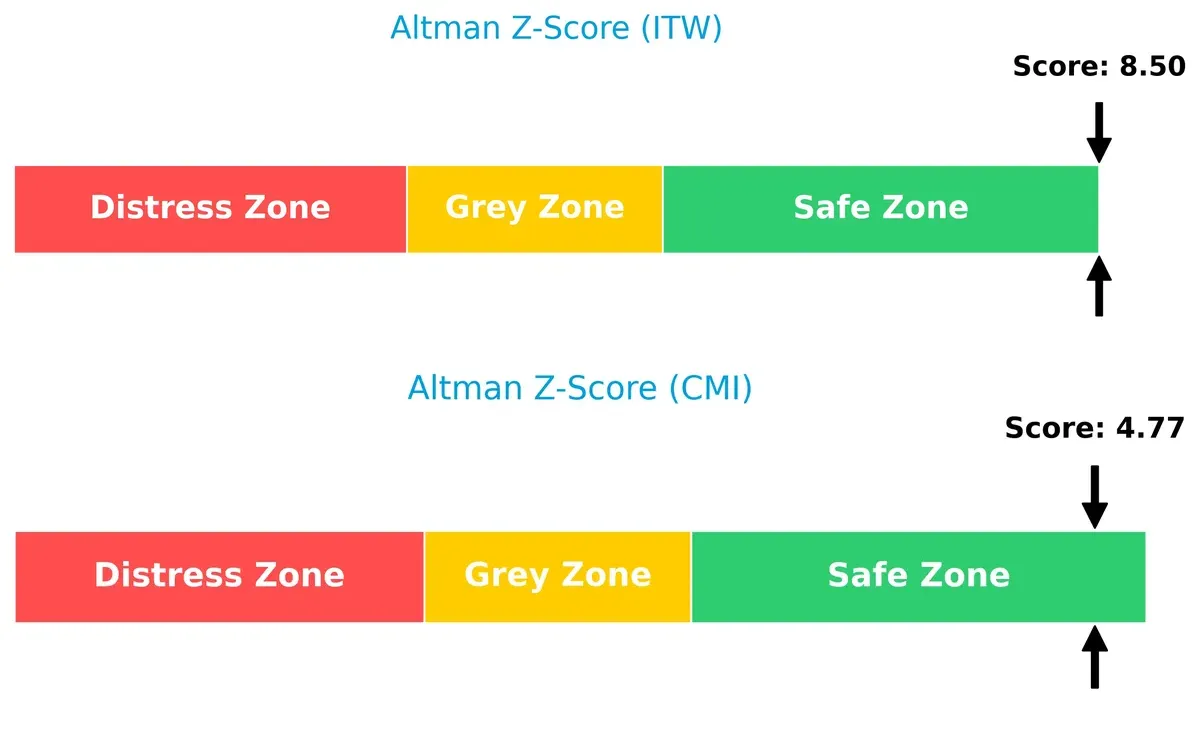
This substantial difference signals ITW’s superior long-term solvency under current economic cycles. ITW’s strong buffer suggests resilience against downturns, while CMI, though safe, operates with slimmer margins of financial safety.
Financial Health: Quality of Operations
Both companies share identical Piotroski F-Scores of 5, reflecting average financial health:
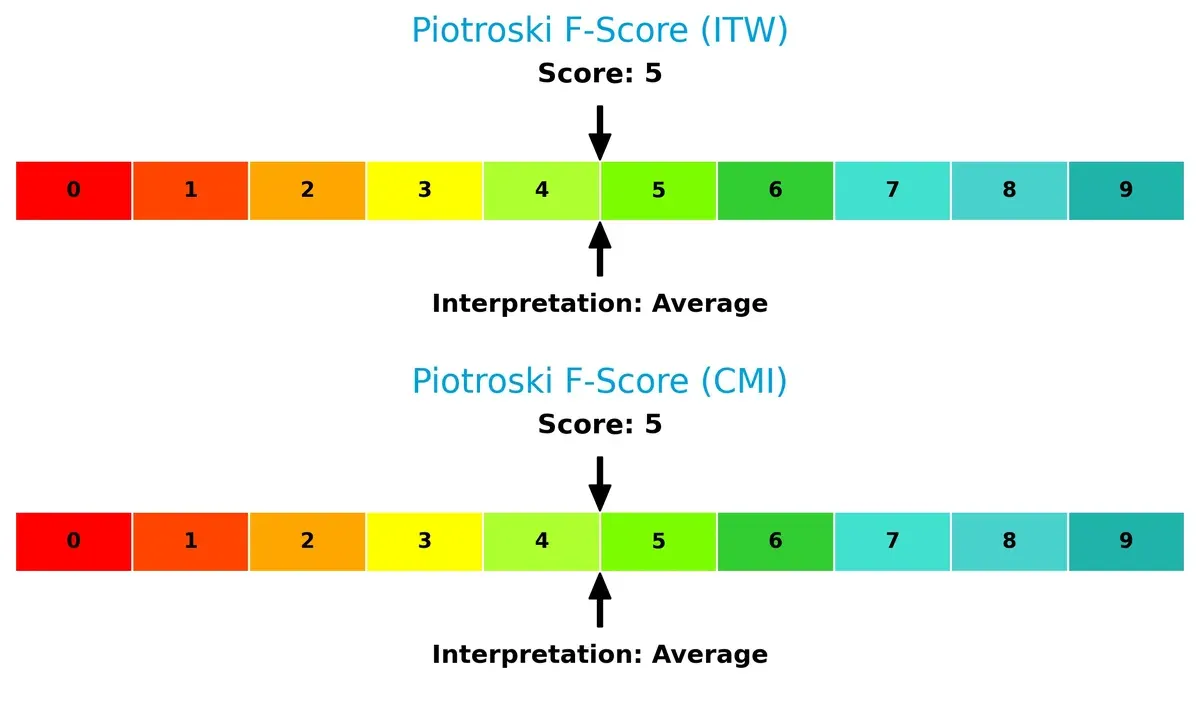
Neither firm signals acute red flags, yet neither demonstrates peak operational robustness. Investors should watch internal metrics for potential volatility, as average scores imply moderate efficiency and profitability strength relative to sector leaders.
How are the two companies positioned?
This section dissects the operational DNA of ITW and CMI by comparing their revenue distribution by segment and internal dynamics. The goal is to confront their economic moats to identify which business model offers a more resilient and sustainable competitive advantage in today’s market.
Revenue Segmentation: The Strategic Mix
This visual comparison dissects how Illinois Tool Works and Cummins diversify their income streams and where their primary sector bets lie:
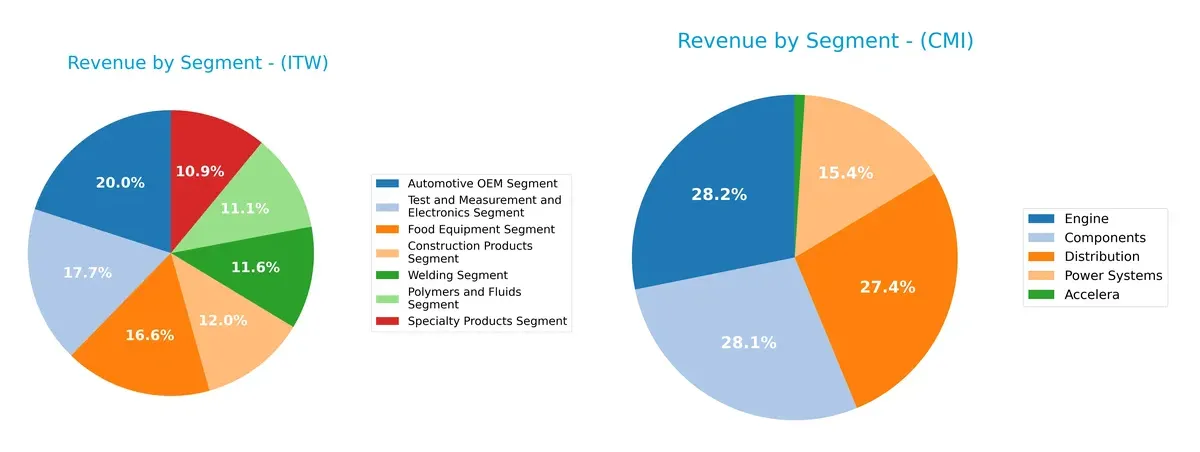
Illinois Tool Works shows a balanced revenue mix, with no single segment exceeding $3.2B, spreading risk across seven key areas. Cummins pivots heavily on its Engine segment, which dwarfs others at $11.7B, anchoring revenue but raising concentration risk. ITW’s diversified approach supports resilience, while Cummins’ focus signals strength in core powertrain but potential vulnerability to sector downturns.
Strengths and Weaknesses Comparison
This table compares the Strengths and Weaknesses of Illinois Tool Works Inc. (ITW) and Cummins Inc. (CMI):
ITW Strengths
- Diversified revenue from seven distinct product segments
- Strong profitability with 19.11% net margin and 95.07% ROE
- Favorable interest coverage at 14.58
- Solid global presence with significant North America and Europe sales
CMI Strengths
- Favorable ROE of 23.02% and ROIC of 12.01%
- Strong liquidity with current ratio 1.76 and quick ratio 1.16
- Lower debt-to-assets at 21.3% indicating financial prudence
- Large U.S. market presence with 19.4B revenue
ITW Weaknesses
- High leverage with debt-to-equity 2.78 and debt-to-assets 55.54%
- Unfavorable price-to-book ratio at 22.32
- Moderate liquidity with quick ratio 0.89 below 1.0
- Market concentration mainly in North America
CMI Weaknesses
- Lower net margin at 8.44% compared to ITW
- Unfavorable price-to-book at 5.7
- Negative reported total segment revenue
- Moderate dividend yield at 1.5% neutral status
Both companies exhibit slightly favorable financial profiles but diverge in capital structure risks and profitability. ITW’s high leverage contrasts with CMI’s stronger liquidity and lower debt load. ITW’s diversified business model supports resilience, while CMI’s concentrated segments and negative total segment revenue require cautious monitoring.
The Moat Duel: Analyzing Competitive Defensibility
A structural moat shields long-term profits from the relentless erosion of competition by securing sustainable advantages:
Illinois Tool Works Inc. (ITW): Precision Engineered Switching Costs
ITW’s moat stems from complex, integrated industrial systems creating high switching costs. Its 26.5% EBIT margin and 16.9% rising ROIC confirm strong capital efficiency. Expansion into food equipment and specialty products in 2026 should deepen its moats.
Cummins Inc. (CMI): Innovation-Driven Product Ecosystem
CMI relies on advanced powertrain technologies and a robust service network, differentiating from ITW’s manufacturing focus. Despite a lower 12.7% EBIT margin, CMI’s broad portfolio drives value. However, a declining ROIC trend signals pressure; new electrification ventures offer growth potential.
Margin Strength vs. Innovation Momentum
ITW’s higher and growing ROIC signals a wider, more durable moat compared to CMI’s shrinking profitability. ITW stands better poised to defend market share amid intensifying industrial competition.
Which stock offers better returns?
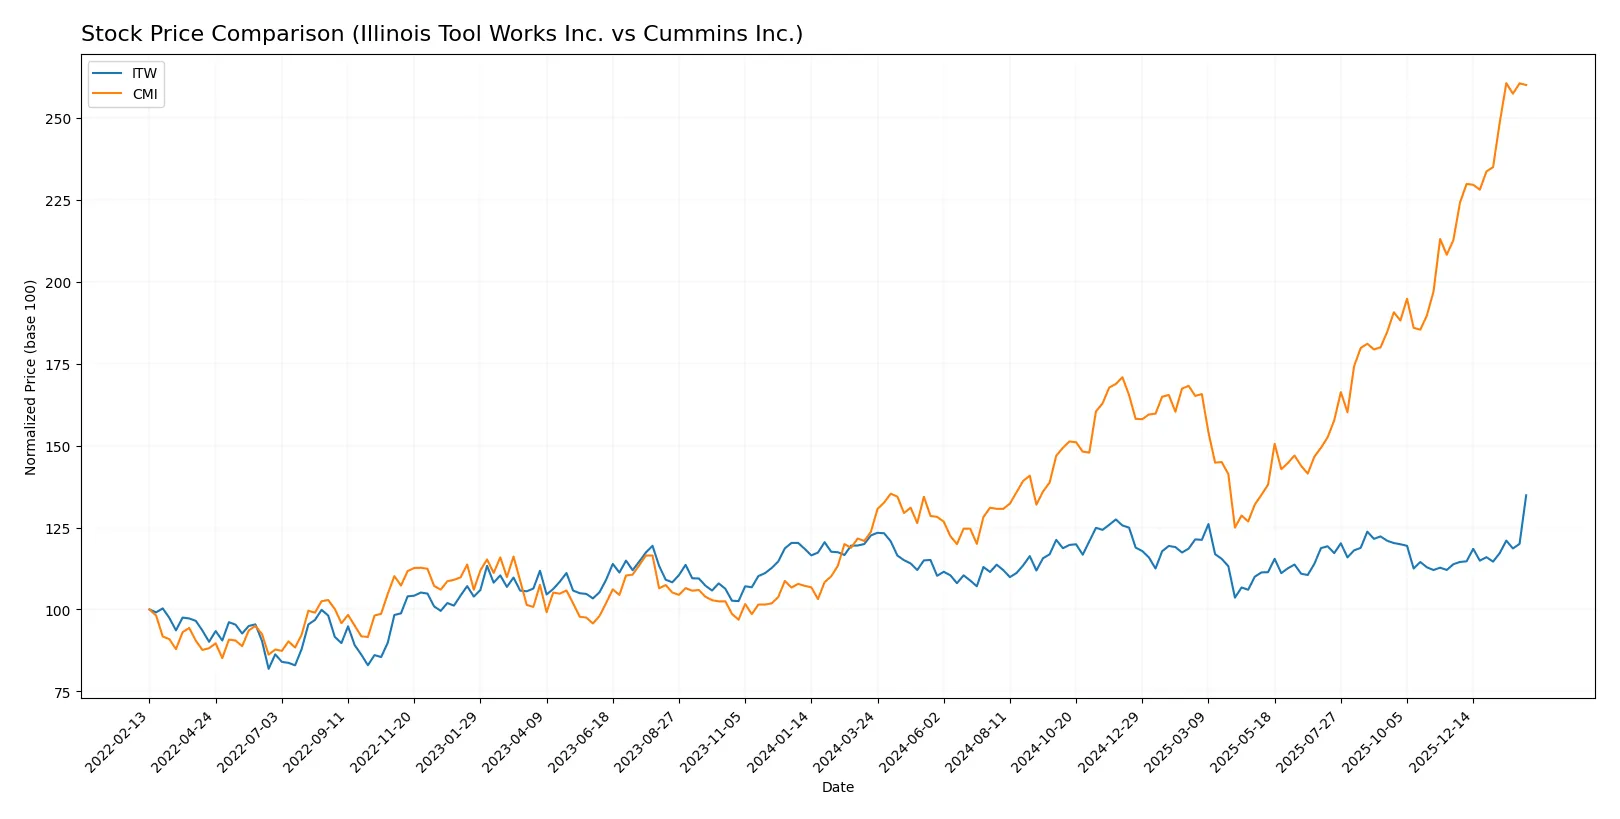
The past year shows strong price gains for both Illinois Tool Works and Cummins, with notable acceleration phases and varying volatility in their trading dynamics.
Trend Comparison
Illinois Tool Works’ stock rose 9.98% over the past 12 months, showing a bullish trend with accelerating momentum and moderate volatility (11.41% std deviation). The highest price reached $293.57.
Cummins’ stock surged 110.21% in the same period, also bullish with accelerating gains but much higher volatility (79.49% std deviation). The peak price hit $578.94.
Cummins delivered significantly higher market performance than Illinois Tool Works, driven by stronger price appreciation despite elevated volatility.
Target Prices
Analysts project mixed outcomes for ITW and CMI with varied upside potential.
| Company | Target Low | Target High | Consensus |
|---|---|---|---|
| Illinois Tool Works Inc. | 244 | 285 | 267.86 |
| Cummins Inc. | 540 | 703 | 606.1 |
Illinois Tool Works trades above consensus targets, suggesting market optimism or potential overvaluation. Cummins shows a significant upside gap versus its current price, indicating strong analyst confidence.

Don’t Let Luck Decide Your Entry Point
Optimize your entry points with our advanced ProRealTime indicators. You’ll get efficient buy signals with precise price targets for maximum performance. Start outperforming now!
How do institutions grade them?
The following tables summarize recent grades assigned by reputable financial institutions for both companies:
Illinois Tool Works Inc. Grades
This table shows the latest ratings and grade changes from top-tier firms for Illinois Tool Works Inc.:
| Grading Company | Action | New Grade | Date |
|---|---|---|---|
| Wells Fargo | Maintain | Underweight | 2026-02-04 |
| Citigroup | Maintain | Neutral | 2026-02-04 |
| Wells Fargo | Maintain | Underweight | 2026-01-07 |
| Goldman Sachs | Downgrade | Sell | 2025-12-16 |
| B of A Securities | Upgrade | Neutral | 2025-11-18 |
| Barclays | Maintain | Underweight | 2025-10-27 |
| Wells Fargo | Maintain | Underweight | 2025-10-27 |
| Truist Securities | Maintain | Hold | 2025-10-27 |
| Truist Securities | Maintain | Hold | 2025-10-08 |
| Barclays | Downgrade | Underweight | 2025-08-14 |
Cummins Inc. Grades
Here is a summary of recent institutional grades and rating actions for Cummins Inc.:
| Grading Company | Action | New Grade | Date |
|---|---|---|---|
| Truist Securities | Maintain | Buy | 2026-02-06 |
| Wolfe Research | Downgrade | Peer Perform | 2026-01-26 |
| Barclays | Maintain | Overweight | 2026-01-23 |
| Wells Fargo | Maintain | Overweight | 2026-01-23 |
| JP Morgan | Maintain | Neutral | 2026-01-14 |
| Citigroup | Maintain | Buy | 2026-01-13 |
| Raymond James | Upgrade | Outperform | 2025-12-22 |
| Barclays | Upgrade | Overweight | 2025-12-19 |
| Truist Securities | Maintain | Buy | 2025-12-18 |
| Citigroup | Maintain | Buy | 2025-12-11 |
Which company has the best grades?
Cummins Inc. consistently holds stronger grades, including multiple “Buy” and “Overweight” ratings. Illinois Tool Works shows predominantly neutral to underweight grades with some downgrades. This grading gap may influence investor sentiment and portfolio positioning.
Risks specific to each company
The following categories identify the critical pressure points and systemic threats facing both firms in the 2026 market environment:
1. Market & Competition
Illinois Tool Works Inc.
- Diverse industrial segments face intense competition; automotive OEM exposure adds cyclical risk.
Cummins Inc.
- Heavy reliance on diesel and natural gas engines subjects it to evolving powertrain competition and regulatory shifts.
2. Capital Structure & Debt
Illinois Tool Works Inc.
- High debt-to-equity ratio of 2.78 signals elevated financial leverage and risk.
Cummins Inc.
- Lower debt-to-equity at 0.59 shows more conservative capital structure and stronger balance sheet.
3. Stock Volatility
Illinois Tool Works Inc.
- Beta at 1.159 indicates moderate sensitivity to market swings.
Cummins Inc.
- Beta of 1.119 suggests slightly lower market volatility exposure.
4. Regulatory & Legal
Illinois Tool Works Inc.
- Exposure to multiple industrial product regulations; potential liability in automotive and construction sectors.
Cummins Inc.
- Faces stringent emissions regulations impacting engine design and compliance costs.
5. Supply Chain & Operations
Illinois Tool Works Inc.
- Complex global supply chain across seven segments; susceptible to raw material price volatility.
Cummins Inc.
- Supply chain pressures in engine components and electrification technology integration.
6. ESG & Climate Transition
Illinois Tool Works Inc.
- Moderate ESG risks; diversified portfolio dilutes impact but requires adaptation to sustainability demands.
Cummins Inc.
- High risk due to fossil fuel engine focus; transition to electrification critical for long-term viability.
7. Geopolitical Exposure
Illinois Tool Works Inc.
- Broad global footprint exposes it to trade tensions and tariffs, especially in automotive markets.
Cummins Inc.
- Global operations face risks from geopolitical instability affecting raw materials and export markets.
Which company shows a better risk-adjusted profile?
Illinois Tool Works faces its greatest risk in high financial leverage, which could amplify market downturns. Cummins’ main threat lies in regulatory and ESG pressures from shifting emission standards and climate transition. Cummins’ stronger balance sheet and lower debt reduce financial risk, giving it a more resilient risk-adjusted profile. However, Illinois Tool Works’ diversified segments moderate operational risks compared to Cummins’ narrower engine focus. Recent data show Illinois Tool Works’ debt-to-equity at 2.78 versus Cummins’ 0.59, underscoring Cummins’ superior capital stability and risk management.
Final Verdict: Which stock to choose?
Illinois Tool Works (ITW) showcases unmatched capital efficiency and a robust economic moat, consistently generating returns well above its cost of capital. Its leverage level, however, requires vigilance as it poses a financial risk in volatile cycles. ITW suits investors seeking steady value creation with a tilt toward aggressive growth.
Cummins Inc. (CMI) builds its moat on strong operational cash flow and a safer balance sheet with lower leverage. While its profitability growth shows signs of deceleration, the company’s recurring revenue and healthier liquidity profile offer a defensive edge. CMI fits well in a GARP portfolio aiming for growth balanced with relative stability.
If you prioritize sustainable competitive advantage and high capital returns, ITW outshines thanks to its proven value creation despite leverage risks. However, if you seek better financial stability and a more conservative risk profile, CMI offers superior balance sheet strength and steady cash flow resilience. Both present viable scenarios aligned with distinct investor risk appetites and growth preferences.
Disclaimer: Investment carries a risk of loss of initial capital. The past performance is not a reliable indicator of future results. Be sure to understand risks before making an investment decision.
Go Further
I encourage you to read the complete analyses of Illinois Tool Works Inc. and Cummins Inc. to enhance your investment decisions: