Home > Comparison > Industrials > HWM vs CMI
The strategic rivalry between Howmet Aerospace Inc. and Cummins Inc. shapes the trajectory of the industrial machinery sector. Howmet Aerospace operates as a specialized aerospace components manufacturer, while Cummins leads with diversified powertrain and engine solutions. This head-to-head pits precision engineering against broad-spectrum power innovation. This analysis aims to identify which company presents a superior risk-adjusted opportunity for investors seeking exposure to industrial innovation and durable competitive moats.

Table of contents
Companies Overview
Howmet Aerospace and Cummins stand as titans in the industrial machinery sector, shaping global transportation and power solutions.
Howmet Aerospace Inc.: Advanced Engineered Solutions Leader
Howmet Aerospace dominates aerospace and transportation with engine products, fastening systems, engineered structures, and forged wheels. Its revenue stems from selling airfoils, fasteners, and titanium components across multiple continents. In 2026, it prioritizes innovation in lightweight materials to enhance fuel efficiency and durability in aerospace applications.
Cummins Inc.: Powertrain and Engine Systems Innovator
Cummins leads in designing and servicing diesel, natural gas engines, and electrified powertrains for heavy-duty vehicles and industrial markets. It generates income through engine sales, power generation, and aftermarket services worldwide. The firm’s 2026 focus sharpens on expanding electrified power systems and emission solutions amid tightening environmental regulations.
Strategic Collision: Similarities & Divergences
Both companies excel in industrial machinery but diverge in scope: Howmet focuses on aerospace materials, while Cummins targets powertrains and energy systems. Their battlefront lies in transportation sector innovation, balancing traditional engine technology with electrification. Investors should note Howmet’s material engineering edge contrasts with Cummins’ comprehensive powertrain ecosystem, defining distinct investment risk and growth profiles.
Income Statement Comparison
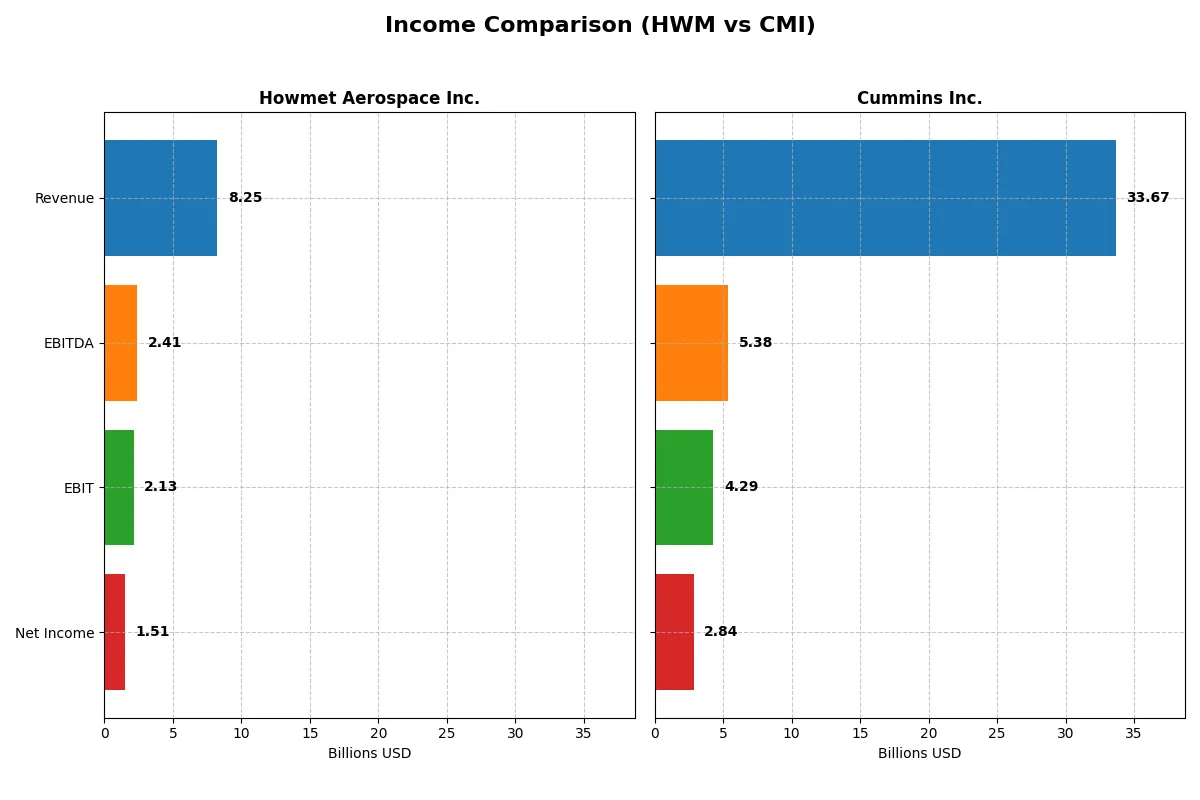
This data dissects the core profitability and scalability of both corporate engines to reveal who dominates the bottom line:
| Metric | Howmet Aerospace Inc. (HWM) | Cummins Inc. (CMI) |
|---|---|---|
| Revenue | 8.25B | 33.67B |
| Cost of Revenue | 5.72B | 25.15B |
| Operating Expenses | 407M | 4.52B |
| Gross Profit | 2.54B | 8.52B |
| EBITDA | 2.41B | 5.39B |
| EBIT | 2.13B | 4.29B |
| Interest Expense | 151M | 329M |
| Net Income | 1.51B | 2.84B |
| EPS | 3.73 | 20.62 |
| Fiscal Year | 2025 | 2025 |
Income Statement Analysis: The Bottom-Line Duel
Comparing these income statements reveals which company runs a more efficient and profitable core business engine over recent years.
Howmet Aerospace Inc. Analysis
Howmet Aerospace’s revenue climbed steadily from 5B in 2021 to 8.25B in 2025, with net income surging from 256M to 1.51B. Gross and net margins remain robust at 30.7% and 18.3%, respectively, highlighting strong cost control. The latest year shows accelerating EBIT growth of 36%, signaling enhanced operational momentum and profitability.
Cummins Inc. Analysis
Cummins posted larger revenues near 34B in recent years but faced a slight 1.3% dip in 2025. Net income grew moderately over five years, reaching 2.84B in 2025, yet net margin slipped to 8.4%. EBIT margin halved below 13%, reflecting margin pressure. The latest year’s 18.6% EBIT decline signals weakening operational efficiency despite scale.
Margin Strength vs. Scale Supremacy
Howmet Aerospace outperforms in margin expansion and profit growth, boasting superior net and EBIT margins alongside accelerating earnings. Cummins leads in absolute scale but suffers margin compression and recent profit declines. For investors prioritizing efficiency and growth momentum, Howmet’s profile appears more compelling in this income statement duel.
Financial Ratios Comparison
These vital ratios act as a diagnostic tool to expose the underlying fiscal health, valuation premiums, and capital efficiency of the companies compared below:
| Ratios | Howmet Aerospace Inc. (HWM) | Cummins Inc. (CMI) |
|---|---|---|
| ROE | 28.17% | 23.02% |
| ROIC | 18.19% | 12.01% |
| P/E | 54.93 | 24.76 |
| P/B | 15.47 | 5.70 |
| Current Ratio | 2.13 | 1.76 |
| Quick Ratio | 1.09 | 1.16 |
| D/E | 0.57 | 0.59 |
| Debt-to-Assets | 27.28% | 21.30% |
| Interest Coverage | 14.11 | 12.14 |
| Asset Turnover | 0.74 | 0.99 |
| Fixed Asset Turnover | 3.18 | 4.84 |
| Payout ratio | 12.00% | 37.11% |
| Dividend yield | 0.22% | 1.50% |
| Fiscal Year | 2025 | 2025 |
Efficiency & Valuation Duel: The Vital Signs
Financial ratios act as a company’s DNA, uncovering hidden risks and operational strengths that shape investment decisions.
Howmet Aerospace Inc.
Howmet Aerospace exhibits strong profitability with a 28.17% ROE and an 18.27% net margin, signaling operational excellence. However, its valuation appears stretched with a P/E of 54.93 and P/B of 15.47, suggesting a premium price. The company returns modest dividends at 0.22%, favoring reinvestment in growth and R&D.
Cummins Inc.
Cummins delivers solid returns, boasting a 23.02% ROE and an 8.44% net margin, reflecting efficient capital use. Its valuation is more reasonable, with a P/E of 24.76. Cummins balances shareholder returns with a 1.5% dividend yield, indicating a clearer focus on income distribution alongside growth investments.
Premium Valuation vs. Operational Safety
Howmet Aerospace commands a premium valuation driven by superior profitability but at higher risk of valuation pressure. Cummins offers a more balanced risk-reward profile with solid returns and a moderate payout. Investors seeking growth may lean towards Howmet, while those prioritizing income and stability may prefer Cummins.
Which one offers the Superior Shareholder Reward?
I see Howmet Aerospace (HWM) pays a low dividend yield near 0.22%, with a modest 12% payout ratio and strong free cash flow coverage above 75%. Its buyback program is less intense but consistent. Cummins (CMI) yields about 1.5%, with a higher 37% payout ratio, though its free cash flow coverage is weaker and more volatile. Cummins aggressively buys back shares, enhancing total returns but at the risk of sustainability. I favor Howmet’s conservative distribution, balancing dividends and buybacks sustainably while preserving capital for growth. In 2026, Howmet offers a more attractive total return profile with lower financial risk and better long-term value creation.
Comparative Score Analysis: The Strategic Profile
The radar chart reveals the fundamental DNA and trade-offs of Howmet Aerospace Inc. and Cummins Inc., highlighting their financial strengths and vulnerabilities:
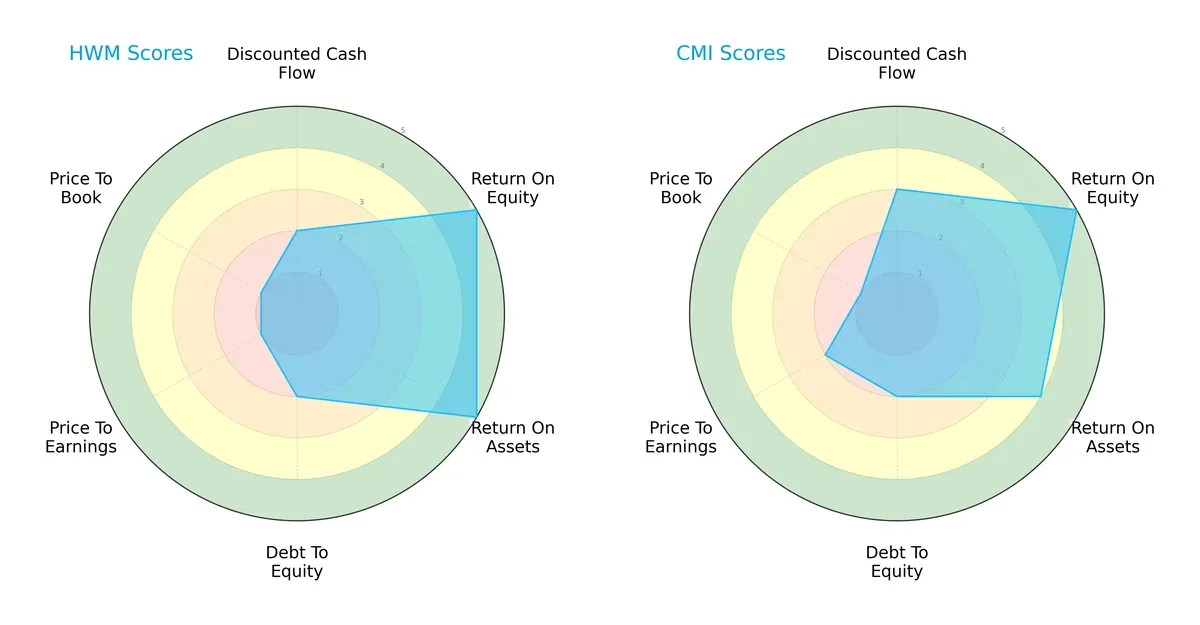
Howmet Aerospace delivers superior operational efficiency with top ROE and ROA scores of 5 each but struggles in valuation metrics, scoring very unfavorably in P/E and P/B ratios. Cummins presents a more balanced profile, with moderate DCF and slightly better valuation scores, though it lags Howmet in asset efficiency. Overall, Cummins depends less on a singular strength, while Howmet’s edge lies in profitability rather than market valuation.
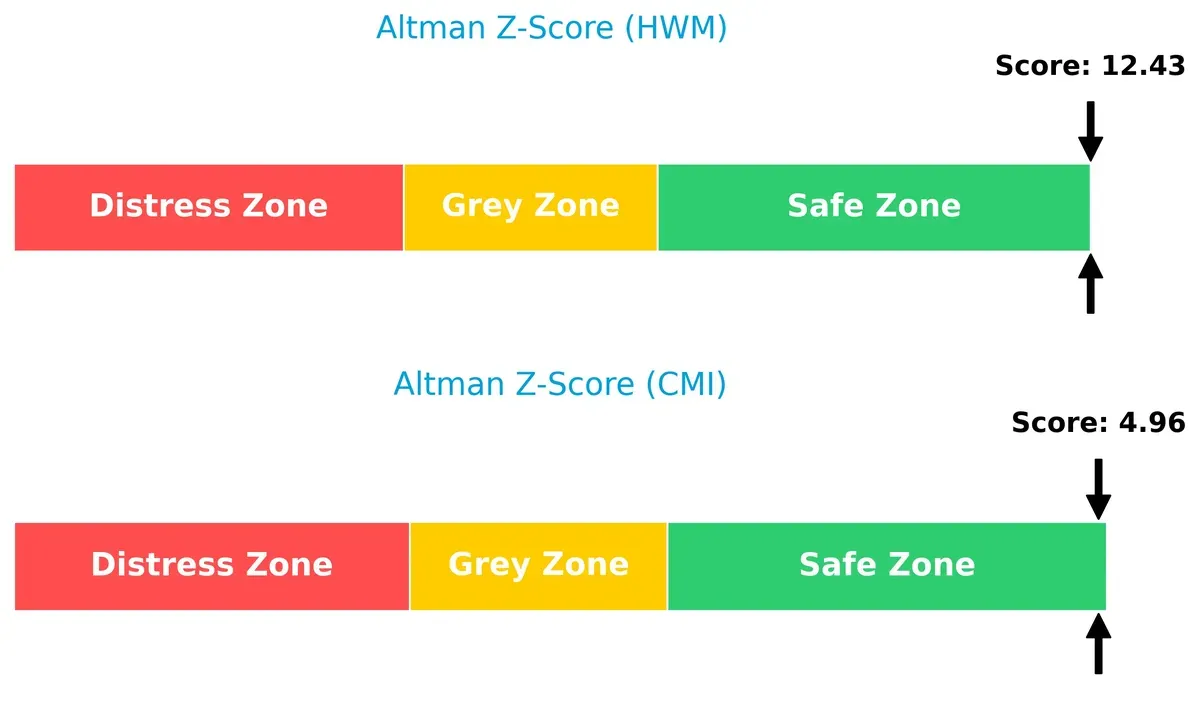
Bankruptcy Risk: Solvency Showdown
The Altman Z-Score gap signals both firms operate safely, but Howmet’s score at 12.4 far exceeds Cummins’ 5.0, underscoring Howmet’s robust solvency and lower bankruptcy risk in this cycle:
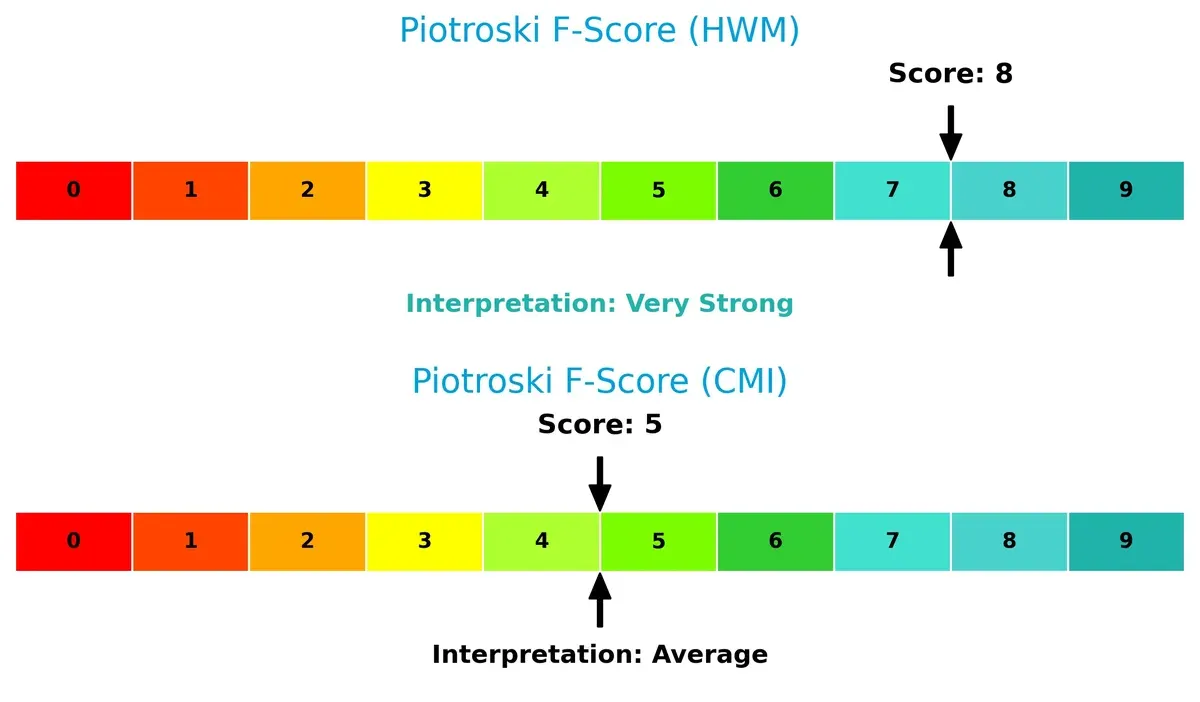
Financial Health: Quality of Operations
Howmet Aerospace’s Piotroski F-Score of 8 indicates very strong financial health, outperforming Cummins’ average score of 5. This suggests Howmet maintains superior internal metrics, while Cummins may harbor operational red flags investors should monitor:
How are the two companies positioned?
This section dissects the operational DNA of Howmet Aerospace (HWM) and Cummins Inc. (CMI) by comparing their revenue distribution and internal dynamics. The goal is to confront their economic moats and identify which model offers the most resilient competitive advantage today.
Revenue Segmentation: The Strategic Mix
The following visual comparison dissects how Howmet Aerospace Inc. and Cummins Inc. diversify their income streams and where their primary sector bets lie:
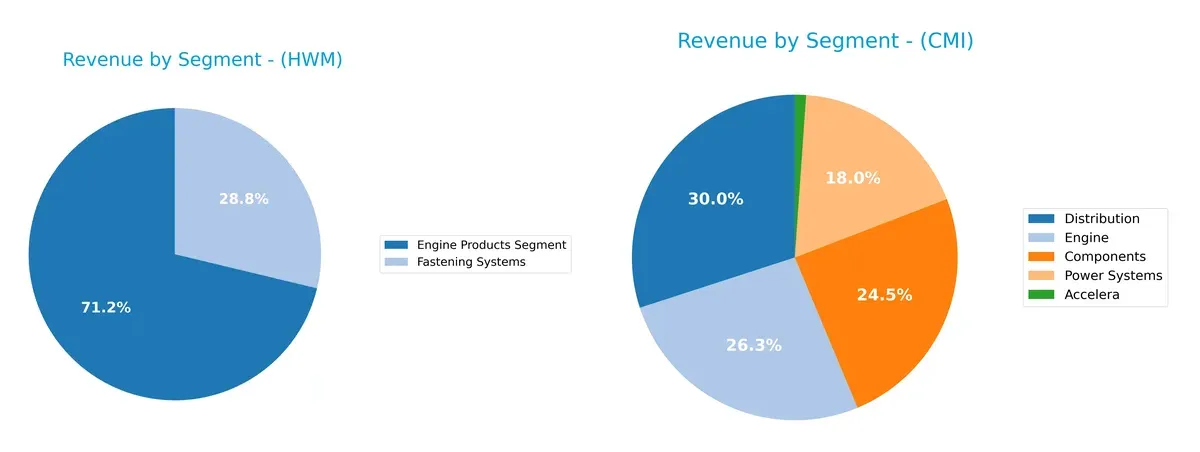
Howmet Aerospace anchors its revenue in the Engine Products Segment with $4.33B in 2025, supplemented by $1.75B from Fastening Systems. This mix shows moderate diversification with a lean toward aerospace components. Cummins dwarfs Howmet in scale, with $12.41B combined from Distribution and Engine segments alone, alongside $10.15B in Components. Cummins’ portfolio pivots on heavy industrial powertrain solutions, exposing it to broader market cycles but also infrastructure dominance risks.
Strengths and Weaknesses Comparison
This table compares the strengths and weaknesses of Howmet Aerospace Inc. and Cummins Inc.:
Howmet Aerospace Inc. Strengths
- Higher net margin at 18.27% indicates superior profitability
- ROE and ROIC exceed WACC, showing efficient capital allocation
- Strong liquidity with current ratio of 2.13 and quick ratio of 1.09
- Diverse product segments including Engine Products and Fastening Systems
- Solid global presence with substantial US and European revenues
- Favorable interest coverage ratio at 14.11 supports debt servicing
Cummins Inc. Strengths
- Strong ROE at 23.02% and favorable ROIC at 12.01%
- Good liquidity with current ratio of 1.76 and quick ratio of 1.16
- Larger revenue base across multiple segments like Components, Engine, and Distribution
- Significant global presence with nearly $19B US and $9.7B Non-US sales
- Favorable interest coverage ratio at 13.05 ensures financial stability
- Lower debt to assets ratio at 21.3% reduces financial risk
Howmet Aerospace Inc. Weaknesses
- Unfavorable high P/E at 54.93 and P/B at 15.47 suggest overvaluation risk
- Dividend yield of 0.22% is low for income-focused investors
- Neutral asset turnover at 0.74 hints at moderate operational efficiency
- Product diversification less broad compared to Cummins with fewer segments
- Neutral debt to equity ratio at 0.57 indicates moderate leverage
- Limited geographic diversification beyond US and Europe
Cummins Inc. Weaknesses
- Neutral net margin at 8.44% implies lower profitability
- P/B ratio at 5.7 remains unfavorable compared to industry norms
- Neutral asset turnover at 0.99 shows average asset utilization
- Higher neutral debt to equity ratio at 0.59 reflects moderate leverage
- Global revenue concentration in US may increase exposure to domestic risks
- Dividend yield at 1.5% is moderate but not a strong income driver
Howmet Aerospace demonstrates stronger profitability and liquidity metrics but faces valuation and diversification challenges. Cummins shows broader product and geographic diversity with solid capital efficiency but lower margins and moderate leverage. These factors shape each company’s strategic positioning and risk profile.
The Moat Duel: Analyzing Competitive Defensibility
A structural moat is the only true shield protecting long-term profits from relentless competitive pressures. Let’s dissect these two industrial giants:
Howmet Aerospace Inc. (HWM): Engineering Precision with Cost Advantage
I identify a robust cost advantage moat in Howmet, driven by proprietary aerospace manufacturing and forged components. Its 2025 ROIC outpaces WACC by 8.8%, reflecting strong value creation and margin stability. New aerospace and transportation markets in 2026 could deepen this moat, sustaining profitability.
Cummins Inc. (CMI): Powertrain Expertise with Brand and Scale Moat
Cummins relies on brand strength and scale in diesel and hybrid engines, contrasting with Howmet’s cost edge. Though still creating value, its ROIC exceeds WACC by a narrower 3.6%, and profitability trends downward. Expansion in electrified powertrain systems offers growth but also exposes it to market disruption risks.
Cost Leadership vs. Brand & Scale: Who Holds the Stronger Moat?
Howmet Aerospace commands a wider, more sustainable moat, evidenced by a rising ROIC and robust margin growth. Cummins creates value but faces shrinking returns and competitive headwinds. Howmet stands better equipped to defend and expand its market share over the next cycle.
Which stock offers better returns?
Over the past year, both Howmet Aerospace Inc. and Cummins Inc. exhibited strong price gains with notable acceleration phases. Howmet’s stock surged sharply, while Cummins showed robust, steady growth.
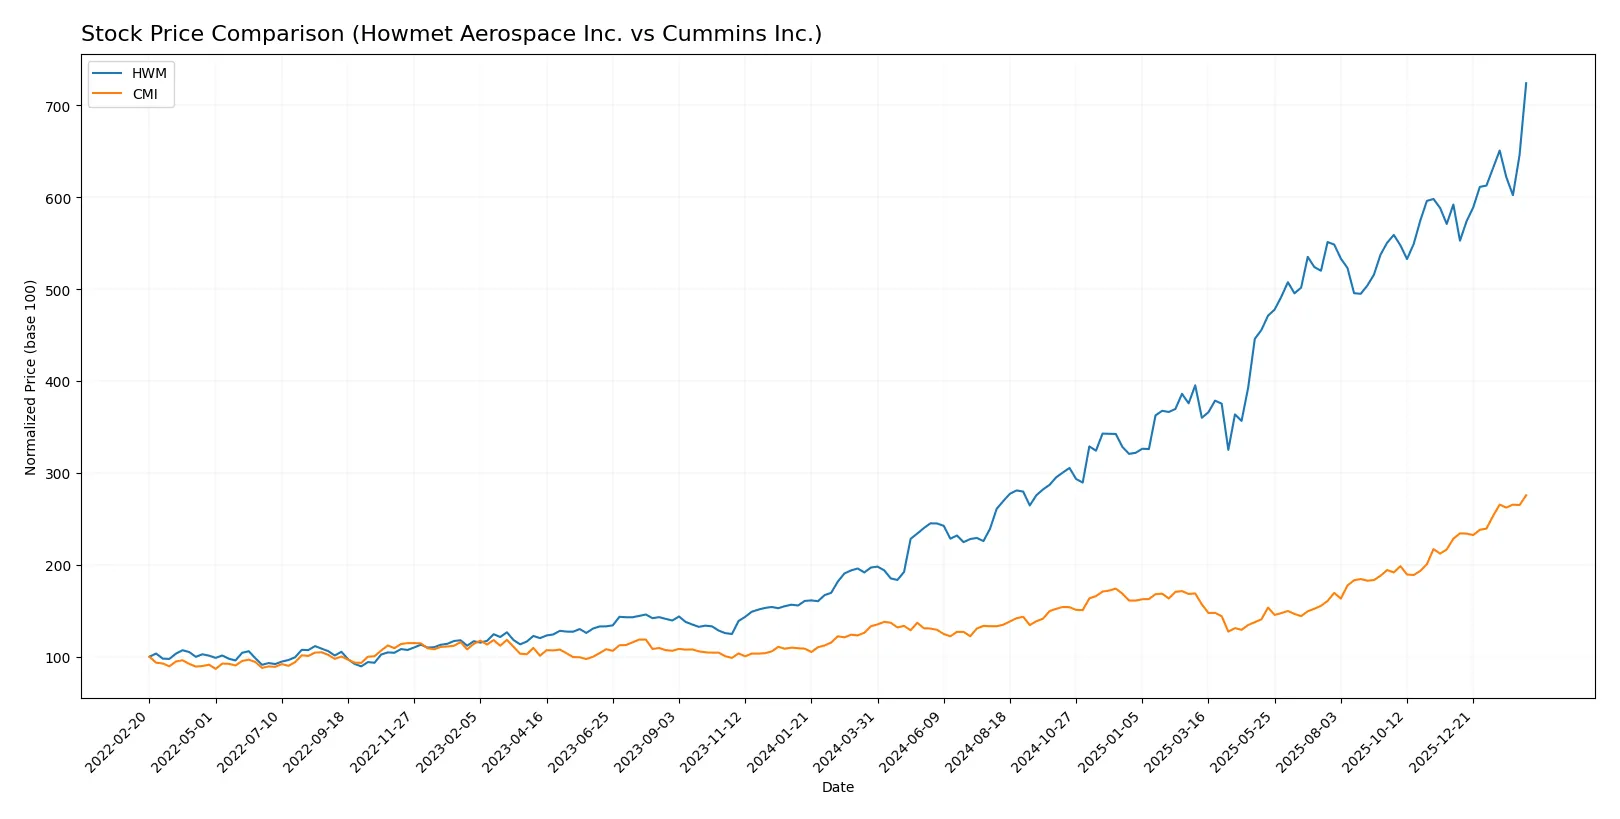
Trend Comparison
Howmet Aerospace’s stock price rose 267.42% over the last 12 months, marking a bullish trend with accelerating gains and a high volatility of 48.78. It hit a peak of 250.21 and a low near 63.41.
Cummins’ share price increased 107.0% over the same period, also in a bullish trend with acceleration. Volatility was higher at 82.55, with prices ranging from 266.48 to 601.01.
Howmet delivered the highest market performance with more than double Cummins’ percentage gain, despite lower volatility and a narrower price range.
Target Prices
Analysts present confident target price ranges for Howmet Aerospace Inc. and Cummins Inc., suggesting potential upside.
| Company | Target Low | Target High | Consensus |
|---|---|---|---|
| Howmet Aerospace Inc. | 209 | 290 | 259.63 |
| Cummins Inc. | 540 | 703 | 618.4 |
Howmet’s consensus target at 259.63 slightly exceeds its current price of 250.21, indicating moderate upside. Cummins shows a stronger upside potential, with a consensus 3% above the current 601.01 price.

Don’t Let Luck Decide Your Entry Point
Optimize your entry points with our advanced ProRealTime indicators. You’ll get efficient buy signals with precise price targets for maximum performance. Start outperforming now!
How do institutions grade them?
Howmet Aerospace Inc. Grades
Below is a summary of recent institutional grades for Howmet Aerospace Inc.:
| Grading Company | Action | New Grade | Date |
|---|---|---|---|
| Susquehanna | Maintain | Positive | 2026-02-13 |
| Citigroup | Maintain | Buy | 2026-01-13 |
| B of A Securities | Maintain | Buy | 2025-11-14 |
| JP Morgan | Maintain | Overweight | 2025-11-10 |
| BTIG | Maintain | Buy | 2025-11-03 |
| Goldman Sachs | Maintain | Buy | 2025-11-03 |
| TD Cowen | Maintain | Buy | 2025-10-31 |
| RBC Capital | Maintain | Outperform | 2025-10-31 |
| UBS | Maintain | Neutral | 2025-10-31 |
| Truist Securities | Maintain | Buy | 2025-10-15 |
Cummins Inc. Grades
Below is a summary of recent institutional grades for Cummins Inc.:
| Grading Company | Action | New Grade | Date |
|---|---|---|---|
| Raymond James | Maintain | Outperform | 2026-02-09 |
| Truist Securities | Maintain | Buy | 2026-02-06 |
| Wolfe Research | Downgrade | Peer Perform | 2026-01-26 |
| Barclays | Maintain | Overweight | 2026-01-23 |
| Wells Fargo | Maintain | Overweight | 2026-01-23 |
| JP Morgan | Maintain | Neutral | 2026-01-14 |
| Citigroup | Maintain | Buy | 2026-01-13 |
| Raymond James | Upgrade | Outperform | 2025-12-22 |
| Barclays | Upgrade | Overweight | 2025-12-19 |
| Truist Securities | Maintain | Buy | 2025-12-18 |
Which company has the best grades?
Howmet Aerospace holds predominantly Buy and Outperform ratings with no downgrades. Cummins Inc. also shows strong grades, but includes a recent downgrade to Peer Perform. Investors may perceive Howmet’s steadier positive ratings as a sign of greater consensus confidence.
Risks specific to each company
The following categories identify the critical pressure points and systemic threats facing both firms in the 2026 market environment:
1. Market & Competition
Howmet Aerospace Inc. (HWM)
- Faces intense competition in aerospace and transportation sectors with innovation-driven rivals.
Cummins Inc. (CMI)
- Competes in diversified powertrain markets, balancing diesel and emerging electrification challenges.
2. Capital Structure & Debt
Howmet Aerospace Inc. (HWM)
- Moderate leverage with debt-to-assets at 27.3% and interest coverage at 14.1, indicating manageable risk.
Cummins Inc. (CMI)
- Slightly lower leverage at 21.3% debt-to-assets and interest coverage of 13.0, reflecting prudent debt levels.
3. Stock Volatility
Howmet Aerospace Inc. (HWM)
- Higher beta of 1.25 suggests greater price swings and sensitivity to market shifts.
Cummins Inc. (CMI)
- Lower beta of 1.12 indicates relatively steadier stock performance amid market fluctuations.
4. Regulatory & Legal
Howmet Aerospace Inc. (HWM)
- Subject to aerospace industry regulations with potential export controls and environmental compliance costs.
Cummins Inc. (CMI)
- Faces stringent emissions regulations and compliance costs in evolving powertrain and fuel technology markets.
5. Supply Chain & Operations
Howmet Aerospace Inc. (HWM)
- Complex global supply chain exposed to geopolitical tensions and raw material price volatility.
Cummins Inc. (CMI)
- Large, diversified operations with risks in component sourcing and shift to electrification components.
6. ESG & Climate Transition
Howmet Aerospace Inc. (HWM)
- Pressure to innovate sustainable aerospace materials amid rising climate standards.
Cummins Inc. (CMI)
- Accelerating shift to electrified powertrains creates both risk and opportunity in climate transition.
7. Geopolitical Exposure
Howmet Aerospace Inc. (HWM)
- Operations span multiple countries, increasing exposure to trade tensions and foreign policy risks.
Cummins Inc. (CMI)
- Global footprint with exposure to trade tariffs and regional instability affecting supply chains.
Which company shows a better risk-adjusted profile?
Howmet Aerospace faces its largest risk in market competition amplified by high valuation multiples. Cummins contends mostly with regulatory and transition risks amid a steadier valuation and lower volatility. Cummins’ Altman Z-score of 4.96 versus Howmet’s 12.43 shows both are financially stable, but Howmet’s superior Piotroski score (8 vs. 5) indicates stronger operational health. Overall, Cummins presents a slightly better risk-adjusted profile due to its balanced leverage, more moderate stock volatility, and diversified product exposure, while Howmet’s high P/E and price-to-book ratios warrant caution.
Final Verdict: Which stock to choose?
Howmet Aerospace Inc. (HWM) showcases unmatched capital efficiency and a rapidly growing return on invested capital. Its superpower lies in consistently creating value well above its cost of capital, driving strong profitability and robust cash flow. A point of vigilance remains its high valuation multiples, which suggest premium pricing. HWM fits aggressive growth portfolios seeking dynamic value creators.
Cummins Inc. (CMI) commands a strategic moat through its diversified industrial footprint and solid recurring revenue streams. The company offers greater relative safety with a steadier financial profile and lower valuation metrics compared to HWM. CMI suits portfolios focused on growth at a reasonable price, balancing stability with moderate expansion.
If you prioritize aggressive value creation and are comfortable with premium valuation, Howmet Aerospace outshines as the compelling choice due to its superior ROIC trajectory and profitability momentum. However, if you seek better stability and a more grounded valuation, Cummins offers a safer harbor with consistent returns and a resilient business model. Each scenario aligns with distinct investor risk appetites and time horizons.
Disclaimer: Investment carries a risk of loss of initial capital. The past performance is not a reliable indicator of future results. Be sure to understand risks before making an investment decision.
Go Further
I encourage you to read the complete analyses of Howmet Aerospace Inc. and Cummins Inc. to enhance your investment decisions: