Home > Comparison > Industrials > CMI vs GNRC
The strategic rivalry between Cummins Inc. and Generac Holdings shapes the industrial machinery sector’s direction. Cummins operates as a diversified, capital-intensive engine and powertrain manufacturer, while Generac focuses on high-growth power generation and energy storage for residential and commercial markets. This analysis explores their contrasting business models and growth trajectories to assess which company offers a superior risk-adjusted investment opportunity for a diversified portfolio in 2026.
Table of contents
Companies Overview
Cummins Inc. and Generac Holdings Inc. both play pivotal roles in the industrial machinery market, shaping power solutions globally.
Cummins Inc.: Global Powertrain Innovator
Cummins Inc. dominates industrial engines and power systems with a broad portfolio including diesel, natural gas, and electrified powertrains. Its revenue stems from manufacturing and servicing engines and components across heavy-duty transport, construction, and energy sectors. In 2026, Cummins focuses on expanding its new power segment, emphasizing battery, fuel cell, and hydrogen technologies to lead the energy transition.
Generac Holdings Inc.: Residential and Commercial Power Specialist
Generac Holdings Inc. specializes in power generation and energy storage for residential, light commercial, and industrial markets. It generates revenue through sales of standby generators, portable power equipment, and clean energy solutions. The company’s 2026 strategy centers on scaling its PWRcell clean energy brand and enhancing remote monitoring capabilities with Mobile Link technology to capture growing demand for home energy resilience.
Strategic Collision: Similarities & Divergences
Both companies operate in power solutions but diverge in scope and customer focus. Cummins pursues a diversified, global industrial engine market with a heavy push into electrification. Generac targets primarily residential and light commercial segments with a strong emphasis on backup power and clean energy integration. Their main battleground is the evolving energy landscape where industrial scale meets consumer resilience. Cummins offers a broad industrial moat, while Generac presents a nimble growth profile in residential power innovation.
Income Statement Comparison
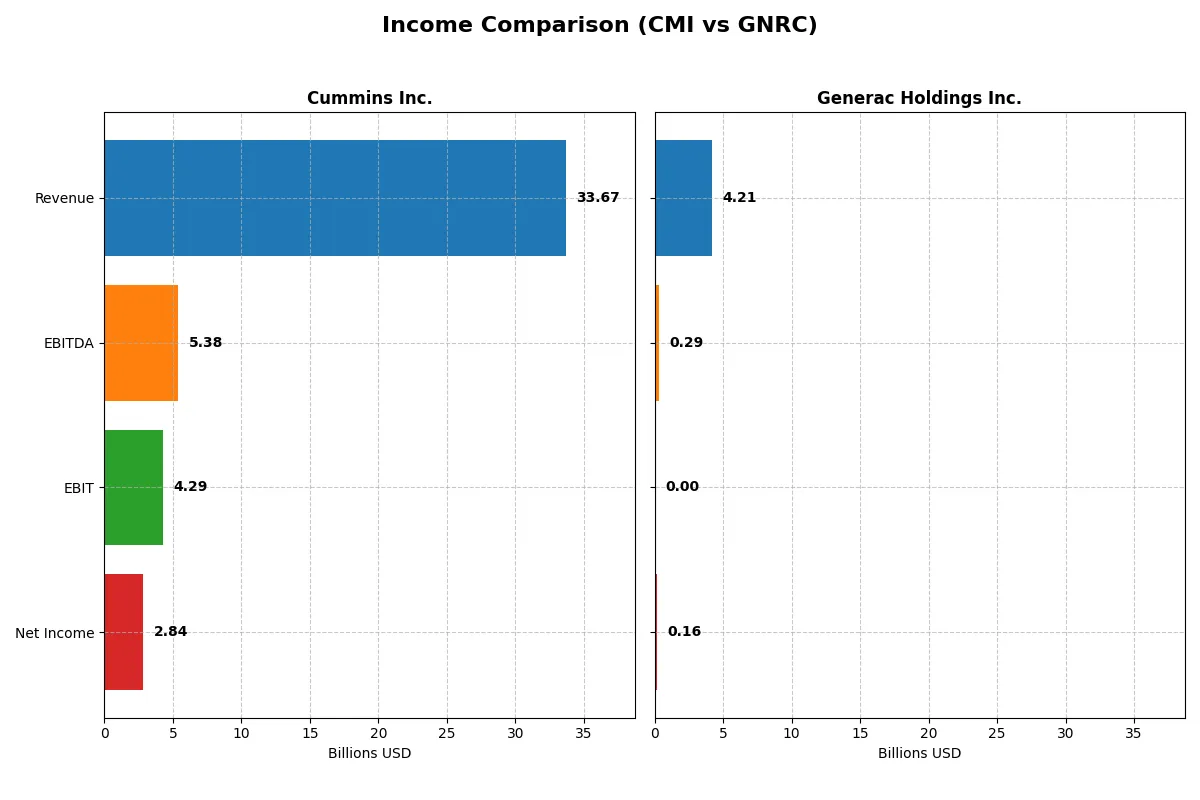
This data dissects the core profitability and scalability of both corporate engines to reveal who dominates the bottom line:
| Metric | Cummins Inc. (CMI) | Generac Holdings Inc. (GNRC) |
|---|---|---|
| Revenue | 33.7B | 4.21B |
| Cost of Revenue | 25.15B | 2.60B |
| Operating Expenses | 4.52B | 1.32B |
| Gross Profit | 8.52B | 1.61B |
| EBITDA | 5.39B | 289M |
| EBIT | 4.29B | 0 |
| Interest Expense | 329M | 71M |
| Net Income | 2.84B | 160M |
| EPS | 20.62 | 2.73 |
| Fiscal Year | 2025 | 2025 |
Income Statement Analysis: The Bottom-Line Duel
This income statement comparison reveals which company operates its business with greater efficiency and stronger financial discipline.
Cummins Inc. Analysis
Cummins shows a strong revenue base around 33.7B in 2025, slightly down from 34.1B in 2024, but net income remains robust at 2.84B. Its gross margin holds steady near 25%, and net margin at 8.4% is favorable. Despite a 1.3% revenue dip last year, Cummins sustains healthy profitability and operational efficiency.
Generac Holdings Inc. Analysis
Generac’s 2025 revenue stands at 4.2B, down modestly from 4.3B in 2024, with net income shrinking sharply to 160M. Gross margin is higher at 38%, but net margin compresses to 3.8%. The company faces a steep decline in EBIT and net income margins, signaling pressure on operational leverage and cost control.
Margin Strength vs. Earnings Stability
Cummins delivers superior bottom-line results and margin stability despite minor revenue fluctuations. Generac’s higher gross margin fails to translate into consistent profit growth, with net income and margins under significant stress. Investors seeking dependable earnings will find Cummins’ profile more attractive due to its proven operational resilience.
Financial Ratios Comparison
These vital ratios act as a diagnostic tool to expose the underlying fiscal health, valuation premiums, and capital efficiency of the companies compared below:
| Ratios | Cummins Inc. (CMI) | Generac Holdings Inc. (GNRC) |
|---|---|---|
| ROE | 23.02% | 0% |
| ROIC | 12.01% | 0% |
| P/E | 24.76 | 50.02 |
| P/B | 5.70 | 0 |
| Current Ratio | 1.76 | 0 |
| Quick Ratio | 1.16 | 0 |
| D/E (Debt-to-Equity) | 0.59 | 0 |
| Debt-to-Assets | 21.30% | 0% |
| Interest Coverage | 12.14 | -4.09 |
| Asset Turnover | 0.99 | 0 |
| Fixed Asset Turnover | 4.84 | 0 |
| Payout Ratio | 37.11% | 0.18% |
| Dividend Yield | 1.50% | 0.00% |
| Fiscal Year | 2025 | 2025 |
Efficiency & Valuation Duel: The Vital Signs
Financial ratios act as a company’s DNA, revealing hidden risks and operational excellence that drive investor confidence or caution.
Cummins Inc.
Cummins delivers strong profitability with a 23.02% ROE and 8.44% net margin, signaling efficient capital use. Its P/E of 24.76 appears fairly valued, though a high PB ratio of 5.7 suggests some price premium. The company supports shareholders with a 1.5% dividend yield, balancing returns and reinvestment in R&D.
Generac Holdings Inc.
Generac struggles with profitability, showing a low 3.79% net margin and zero ROE, while its P/E of 50.02 marks it as expensive. Lack of dividends and unfavorable liquidity ratios flag risks. The firm reinvests heavily in growth via R&D (5.78% of revenue), but operational efficiency remains weak in 2025 metrics.
Premium Valuation vs. Operational Safety
Cummins offers a better balance of steady profitability and moderate valuation, while Generac’s high valuation and poor efficiency raise caution. Investors prioritizing operational safety and consistent returns may prefer Cummins, whereas those seeking growth despite risks might consider Generac’s profile.
Which one offers the Superior Shareholder Reward?
I compare Cummins Inc. (CMI) and Generac Holdings Inc. (GNRC) on their shareholder distribution strategies. CMI offers a 1.5% dividend yield with a 37% payout ratio, well-covered by steady free cash flow of 17.3/share. It also deploys capital through moderate buybacks, enhancing total return. GNRC barely pays dividends (0.0037% yield) and retains almost all cash to fuel growth, supported by strong free cash flow of 7.5/share and an aggressive buyback program. However, GNRC’s volatile margins and higher valuation multiples suggest greater risk. I find CMI’s balanced dividend and buyback mix more sustainable, offering the superior total return profile for prudent investors in 2026.
Comparative Score Analysis: The Strategic Profile
The radar chart reveals the fundamental DNA and trade-offs of Cummins Inc. and Generac Holdings Inc., highlighting their strategic strengths and vulnerabilities:
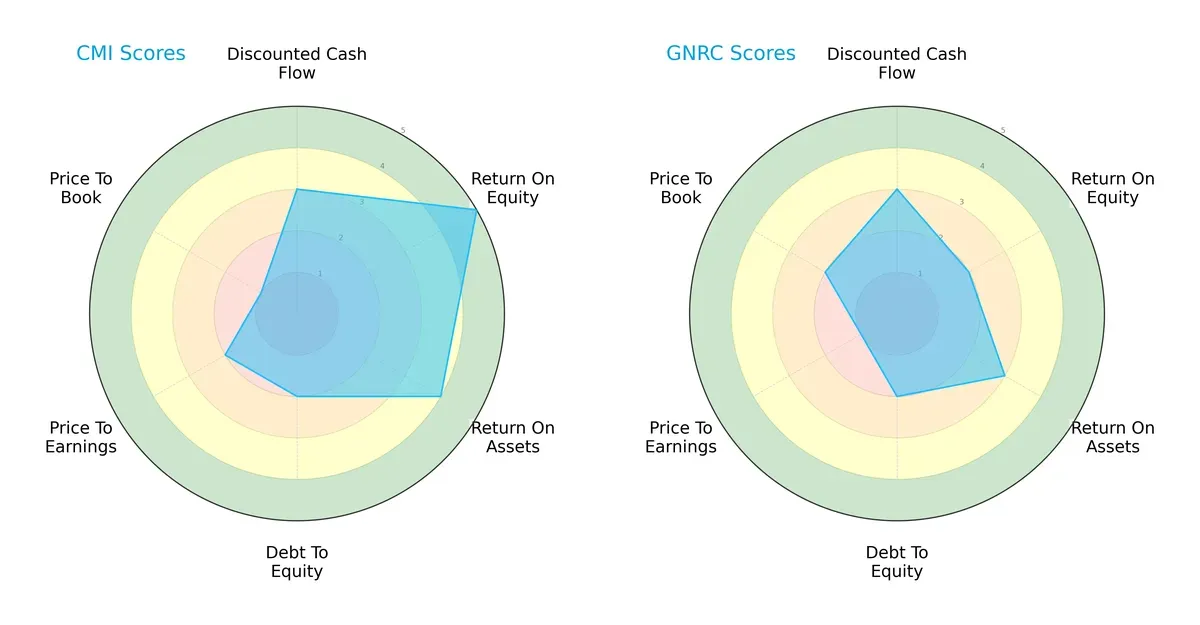
Cummins Inc. shows a balanced profile with strong ROE (5) and ROA (4), though it struggles with valuation metrics (P/E: 2, P/B: 1) and debt management (2). Generac relies more on moderate asset returns (ROA: 3) but suffers from weak profitability (ROE: 2) and valuation scores (P/E: 1, P/B: 2). Cummins dominates in operational efficiency, while Generac lacks a clear competitive edge.
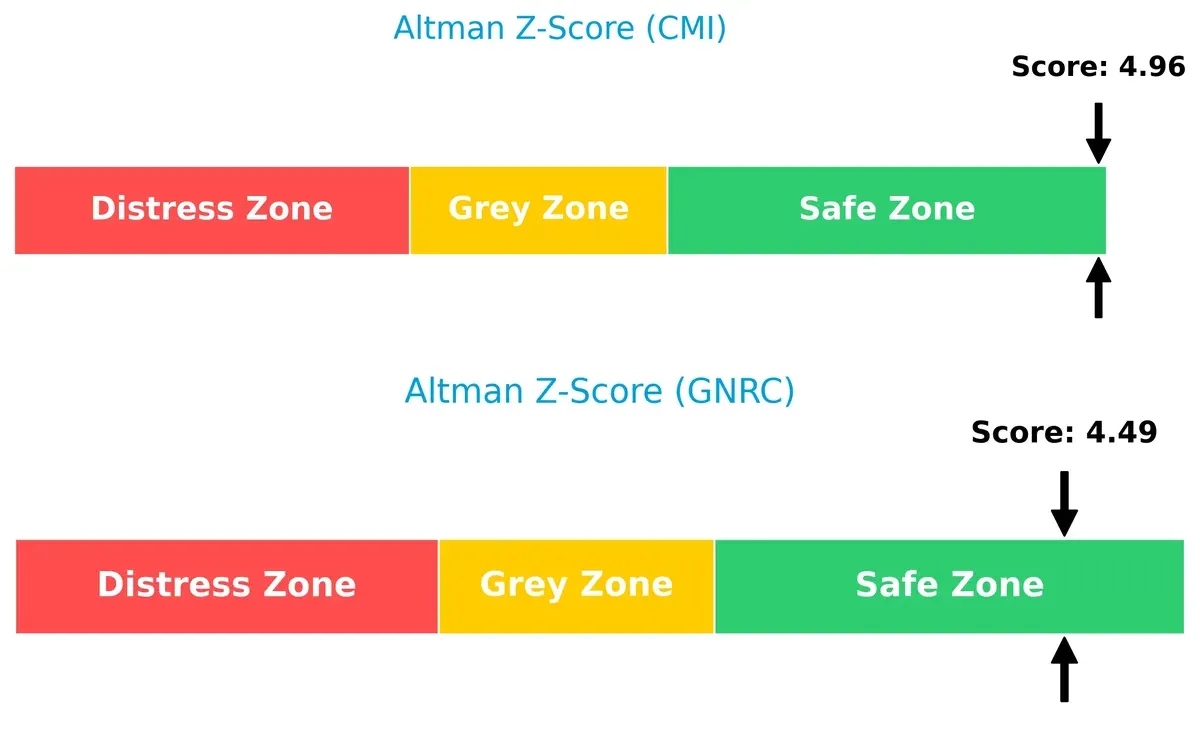
Bankruptcy Risk: Solvency Showdown
The Altman Z-Scores place both firms securely in the safe zone, with Cummins marginally stronger at 4.96 versus Generac’s 4.49, implying robust long-term survival prospects in this cycle:
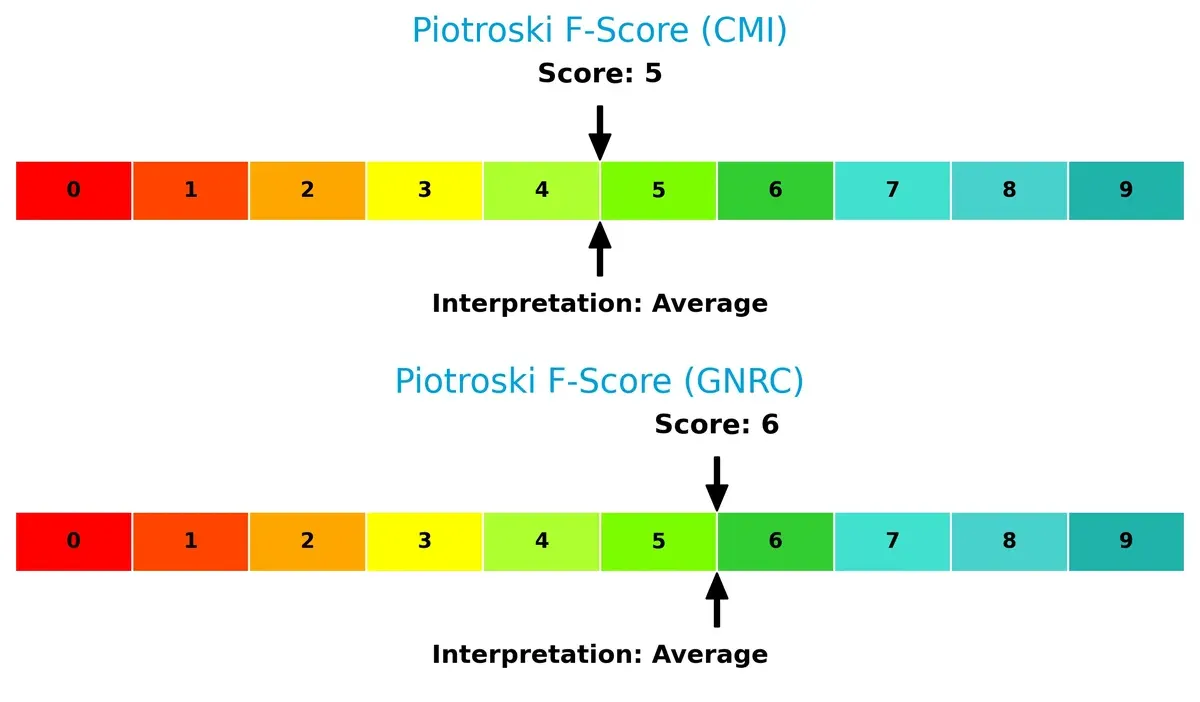
Financial Health: Quality of Operations
Cummins and Generac display average Piotroski F-Scores, 5 and 6 respectively, indicating moderate financial health with no glaring red flags in operations, but room for improvement remains:
How are the two companies positioned?
This section dissects the operational DNA of Cummins and Generac by comparing their revenue distribution and internal dynamics. The goal is to confront their economic moats to identify which model offers the most resilient competitive advantage today.
Revenue Segmentation: The Strategic Mix
This visual comparison dissects how Cummins Inc. and Generac Holdings diversify their income streams and reveals their primary sector bets:
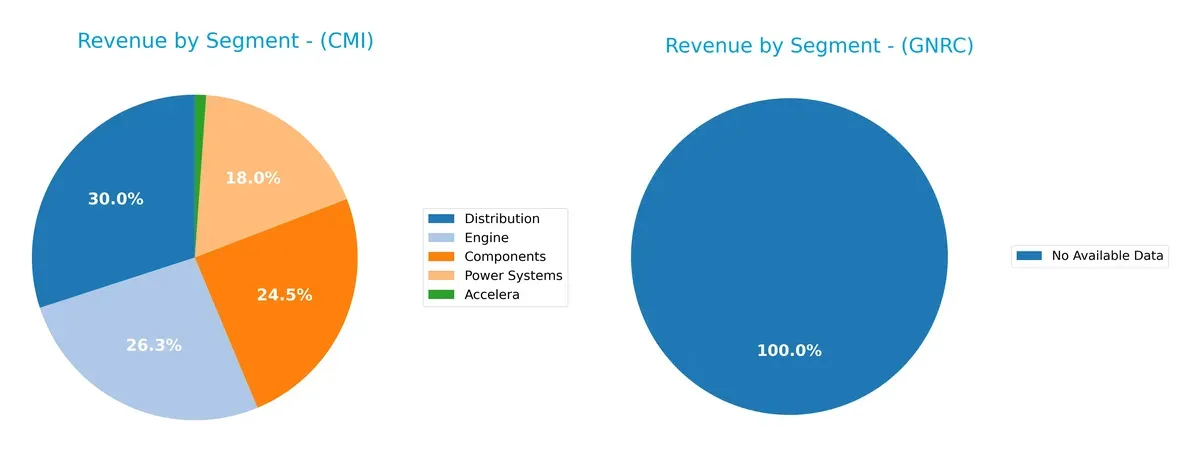
Cummins Inc. shows a balanced revenue mix across Components ($10.1B), Distribution ($12.4B), Engine ($10.9B), and Power Systems ($7.5B). This diversification anchors Cummins in multiple industrial segments, reducing concentration risk. Generac Holdings lacks available data, preventing segmentation analysis. Cummins’ broad industrial exposure suggests resilience through market cycles, leveraging ecosystem lock-in in engine and power infrastructure markets.
Strengths and Weaknesses Comparison
This table compares the Strengths and Weaknesses of Cummins Inc. and Generac Holdings Inc.:
Cummins Inc. Strengths
- Strong profitability with 23% ROE and 12% ROIC
- Favorable liquidity ratios with current ratio 1.76 and quick ratio 1.16
- Low debt to assets at 21.3%
- Global presence with $19B US and $9.7B Non-US revenue
- Diversified segments including Components, Distribution, Engine, and Power Systems
- Favorable fixed asset turnover 4.84
Generac Holdings Inc. Strengths
- Favorable price-to-book ratio suggesting undervaluation
- No debt, indicating low financial risk
- Some level of market presence despite unavailable revenue segmentation
Cummins Inc. Weaknesses
- High price-to-book ratio at 5.7, possibly overvalued
- Neutral net margin at 8.44% indicating moderate profitability
- Moderate asset turnover at 0.99 could limit growth
- No explicit innovation metrics provided
Generac Holdings Inc. Weaknesses
- Very weak profitability with 3.8% net margin, 0% ROE, and ROIC
- Unfavorable liquidity ratios at 0, indicating potential solvency issues
- Negative interest coverage signals financial distress
- Lack of revenue and geographic diversification data
- High PE ratio at 50.02 suggesting overvaluation
Cummins demonstrates a solid financial foundation with broad diversification and global reach. Generac faces significant profitability and liquidity challenges, indicating strategic risks to address.
The Moat Duel: Analyzing Competitive Defensibility
A structural moat is the only reliable barrier protecting long-term profits from relentless competition erosion. Let’s dissect the moats of two industrial machinery leaders:
Cummins Inc.: Intangible Assets and Diversified Power Solutions
Cummins leverages deep engineering expertise and global brand recognition, reflected in a 3.6% ROIC premium over WACC and stable margins. Its push into electrified powertrains and emission solutions could widen its moat in 2026.
Generac Holdings Inc.: Cost Advantage in Residential Power
Generac’s moat centers on cost-efficient manufacturing and strong market presence in home standby generators. However, its financials show margin pressure and a steep ROIC decline, suggesting vulnerability despite opportunities in energy storage.
Moat Strength: Engineering Expertise vs. Cost Efficiency
Cummins possesses a deeper, more sustainable moat with value creation confirmed by ROIC exceeding WACC. Generac’s narrowing margins and declining profitability indicate a weaker moat. Cummins is better positioned to defend and grow market share amid industrial power transitions.
Which stock offers better returns?
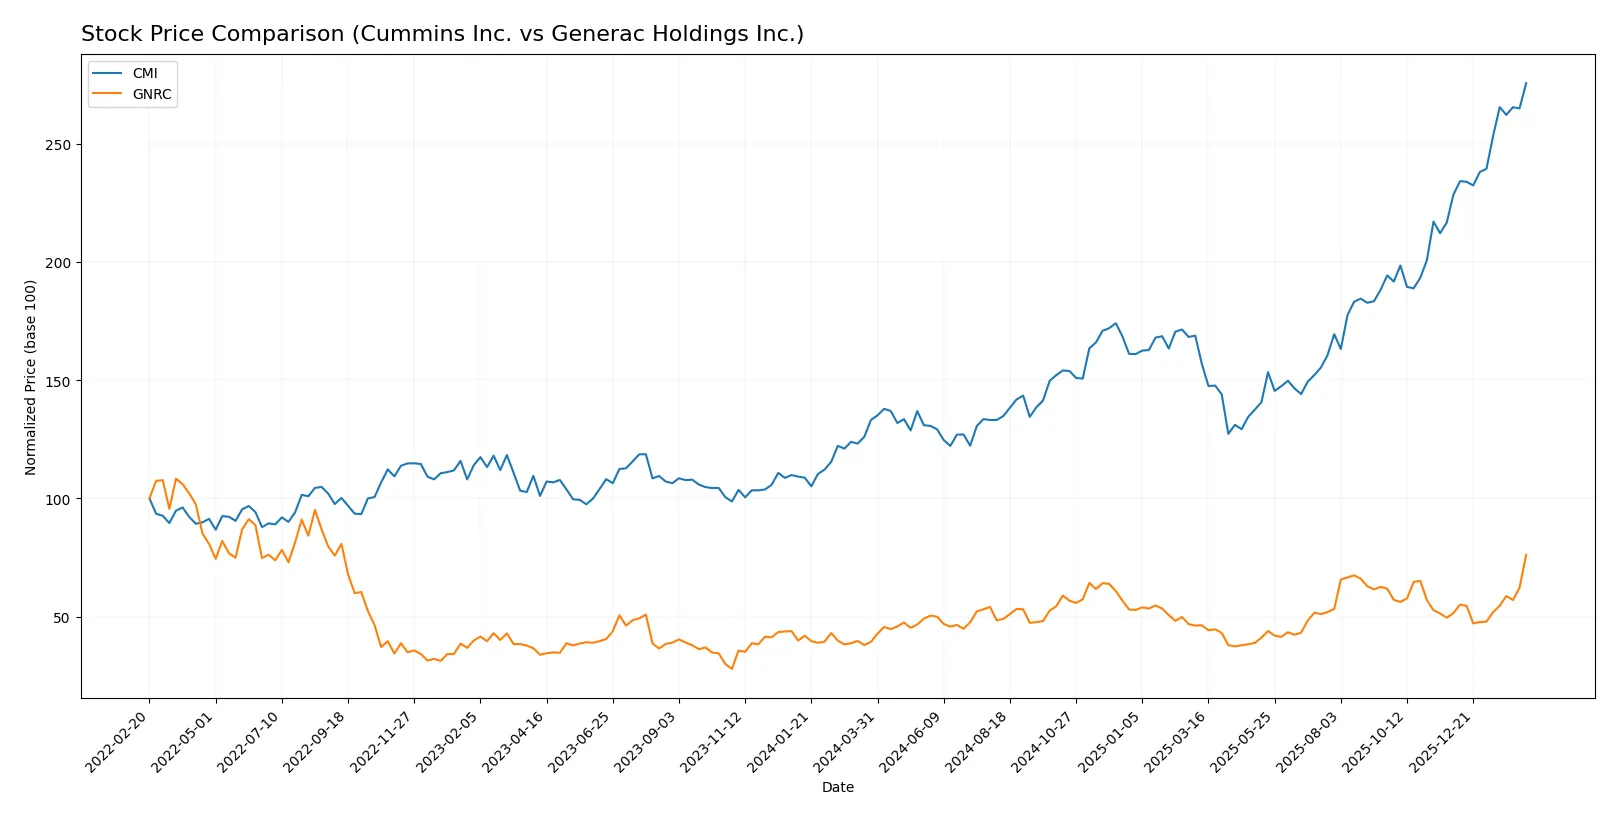
Over the past year, both Cummins Inc. and Generac Holdings Inc. showed strong upward price momentum with notable acceleration and distinct trading volume dynamics.
Trend Comparison
Cummins Inc. gained 107.0% over the past 12 months, confirming a bullish trend with accelerating gains and a high volatility of 82.55. The stock reached a peak of 601.01 and a low of 266.48.
Generac Holdings Inc. rose 93.64% during the same period, also bullish with accelerating momentum but lower volatility at 22.77. Its highest and lowest prices were 224.45 and 110.25 respectively.
Cummins Inc. outperformed Generac Holdings Inc. in total price appreciation, delivering the strongest market performance over the last year.
Target Prices
Analysts present a moderately bullish consensus for both Cummins Inc. and Generac Holdings Inc.
| Company | Target Low | Target High | Consensus |
|---|---|---|---|
| Cummins Inc. | 540 | 703 | 618.4 |
| Generac Holdings Inc. | 195 | 292 | 238.89 |
Cummins’ target consensus of 618.4 slightly exceeds its current price of 601, indicating modest upside potential. Generac’s consensus at 238.89 also suggests room for appreciation from its 224.45 current price, reflecting positive analyst expectations.

Don’t Let Luck Decide Your Entry Point
Optimize your entry points with our advanced ProRealTime indicators. You’ll get efficient buy signals with precise price targets for maximum performance. Start outperforming now!
How do institutions grade them?
Cummins Inc. Grades
The following table summarizes recent grades from major financial institutions for Cummins Inc.:
| Grading Company | Action | New Grade | Date |
|---|---|---|---|
| Raymond James | Maintain | Outperform | 2026-02-09 |
| Truist Securities | Maintain | Buy | 2026-02-06 |
| Wolfe Research | Downgrade | Peer Perform | 2026-01-26 |
| Barclays | Maintain | Overweight | 2026-01-23 |
| Wells Fargo | Maintain | Overweight | 2026-01-23 |
| JP Morgan | Maintain | Neutral | 2026-01-14 |
| Citigroup | Maintain | Buy | 2026-01-13 |
| Raymond James | Upgrade | Outperform | 2025-12-22 |
| Barclays | Upgrade | Overweight | 2025-12-19 |
| Truist Securities | Maintain | Buy | 2025-12-18 |
Generac Holdings Inc. Grades
The following table summarizes recent grades from major financial institutions for Generac Holdings Inc.:
| Grading Company | Action | New Grade | Date |
|---|---|---|---|
| Barclays | Maintain | Equal Weight | 2026-02-13 |
| Wells Fargo | Maintain | Overweight | 2026-02-12 |
| Guggenheim | Downgrade | Neutral | 2026-02-12 |
| Guggenheim | Maintain | Buy | 2026-02-10 |
| Barclays | Maintain | Equal Weight | 2026-01-20 |
| Canaccord Genuity | Maintain | Buy | 2026-01-13 |
| Baird | Upgrade | Outperform | 2026-01-09 |
| Citigroup | Upgrade | Buy | 2026-01-08 |
| B of A Securities | Maintain | Buy | 2026-01-07 |
| Wells Fargo | Upgrade | Overweight | 2025-12-19 |
Which company has the best grades?
Cummins Inc. holds mostly positive grades with multiple “Buy” and “Outperform” ratings, though one downgrade to “Peer Perform” exists. Generac’s grades vary more, including downgrades and “Equal Weight” ratings but also recent upgrades. Cummins shows more consistently favorable institutional sentiment, potentially indicating stronger investor confidence.
Risks specific to each company
The following categories identify the critical pressure points and systemic threats facing both firms in the 2026 market environment:
1. Market & Competition
Cummins Inc.
- Diversified global presence in heavy machinery reduces single market dependency.
Generac Holdings Inc.
- Concentrated in residential and light commercial power equipment, facing niche competition.
2. Capital Structure & Debt
Cummins Inc.
- Moderate debt-to-equity of 0.59 with strong interest coverage of 13x supports financial stability.
Generac Holdings Inc.
- Minimal reported debt but financial ratios missing or unfavorable, raising transparency concerns.
3. Stock Volatility
Cummins Inc.
- Beta at 1.12 indicates moderate volatility relative to the market.
Generac Holdings Inc.
- High beta of 1.81 exposes investors to significant share price swings.
4. Regulatory & Legal
Cummins Inc.
- Exposure to emission standards pressures diesel and natural gas engines segment.
Generac Holdings Inc.
- Faces regulatory scrutiny on energy storage and generator emissions in evolving power regulations.
5. Supply Chain & Operations
Cummins Inc.
- Integrated global supply chain with 69.6K employees supports scale but complexity risk remains.
Generac Holdings Inc.
- Smaller workforce and specialized supply chain increase vulnerability to disruptions.
6. ESG & Climate Transition
Cummins Inc.
- Investment in electrified power systems shows adaptation to climate transition demands.
Generac Holdings Inc.
- Reliance on fossil-fuel generators may hamper ESG ratings and long-term sustainability.
7. Geopolitical Exposure
Cummins Inc.
- Global operations expose firm to diverse geopolitical risks but also diversify country risk.
Generac Holdings Inc.
- Primarily US-focused operations limit geopolitical risk but constrain global growth opportunities.
Which company shows a better risk-adjusted profile?
Cummins faces its most impactful risk in regulatory and supply chain complexity but benefits from strong financial health. Generac’s biggest risk lies in market concentration and elevated stock volatility coupled with weak financial metrics. Cummins shows a superior risk-adjusted profile, supported by a safe Altman Z-Score above 4.9 and stable interest coverage, while Generac’s high beta and unfavorable financial ratios signal elevated risk. This contrast justifies caution on Generac despite its niche market position.
Final Verdict: Which stock to choose?
Cummins Inc. wields a robust operational engine powered by a durable economic moat and consistent value creation. Its strength lies in efficient capital allocation and steady profitability, though investors should watch for its recent dip in earnings growth. It fits well in portfolios targeting disciplined, long-term growth with moderate risk tolerance.
Generac Holdings Inc. benefits from its niche in power generation and resilient revenue streams, supported by a recognizable strategic moat around product innovation. It offers comparatively greater safety in liquidity but faces challenges in profitability and financial efficiency. It suits portfolios favoring growth at a reasonable price, with a higher tolerance for volatility.
If you prioritize sustainable value creation and operational efficiency, Cummins outshines due to its proven ability to generate returns above its cost of capital. However, if you seek growth exposure with a focus on innovation-driven niche markets, Generac offers better stability amid its evolving financial profile. Each stock aligns with distinct investor avatars balancing growth and risk differently.
Disclaimer: Investment carries a risk of loss of initial capital. The past performance is not a reliable indicator of future results. Be sure to understand risks before making an investment decision.
Go Further
I encourage you to read the complete analyses of Cummins Inc. and Generac Holdings Inc. to enhance your investment decisions: