Home > Comparison > Industrials > EMR vs CMI
The strategic rivalry between Emerson Electric Co. and Cummins Inc. shapes the Industrials sector’s competitive landscape. Emerson operates as a diversified technology and engineering firm with broad industrial and commercial solutions. Cummins focuses on powertrain manufacturing, emphasizing engines and electrified power systems. This analysis contrasts Emerson’s diversified industrial approach with Cummins’ specialized powertrain innovation to identify which offers superior risk-adjusted returns for a balanced portfolio.

Table of contents
Companies Overview
Emerson Electric Co. and Cummins Inc. stand as pivotal players shaping the industrial machinery market.
Emerson Electric Co.: Industrial Technology and Engineering Leader
Emerson Electric Co. operates as a technology and engineering company serving industrial, commercial, and residential sectors globally. Its core revenue stems from Automation Solutions, offering measurement instruments, industrial valves, and process control software, alongside Commercial & Residential Solutions with heating, air conditioning, and environmental control products. In 2026, Emerson focuses strategically on expanding its automation and control systems to drive efficiency across diverse industries.
Cummins Inc.: Powertrain and Engine Innovator
Cummins Inc. specializes in designing and manufacturing diesel and natural gas engines, electric powertrains, and related components worldwide. Revenue primarily comes from engines, power systems, and aftermarket parts servicing heavy and medium-duty markets. Cummins’ strategic priority in 2026 centers on electrified power systems and emission solutions to capture growth in sustainable transport and power generation.
Strategic Collision: Similarities & Divergences
Both companies lead in industrial machinery but diverge in approach: Emerson champions automation and control technologies, while Cummins invests heavily in powertrain innovation and electrification. They compete chiefly in industrial efficiency and sustainability solutions. Emerson’s broad systems integration contrasts with Cummins’ focused powertrain expertise, defining distinct investment profiles shaped by differing technological moats and market niches.
Income Statement Comparison
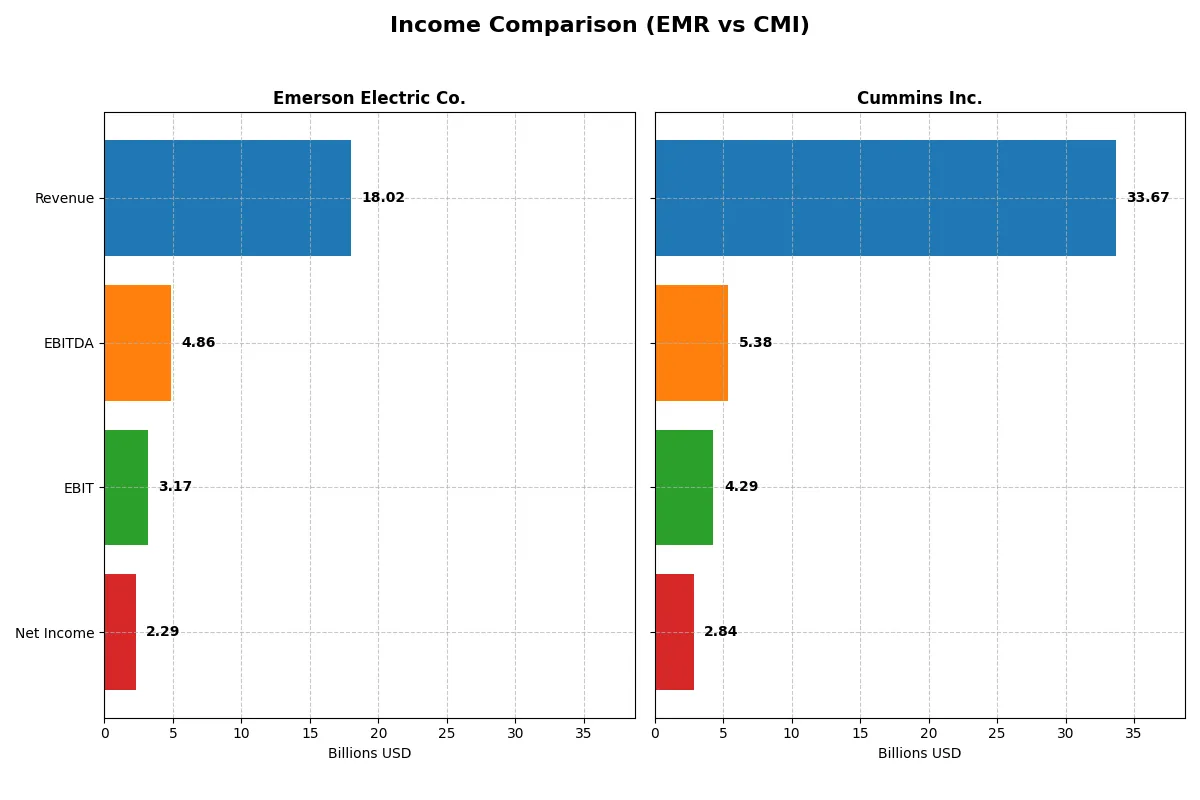
This data dissects the core profitability and scalability of Emerson Electric Co. and Cummins Inc. to reveal who dominates the bottom line:
| Metric | Emerson Electric Co. (EMR) | Cummins Inc. (CMI) |
|---|---|---|
| Revenue | 18.0B | 33.7B |
| Cost of Revenue | 8.5B | 25.2B |
| Operating Expenses | 7.3B | 4.5B |
| Gross Profit | 9.5B | 8.5B |
| EBITDA | 4.9B | 5.4B |
| EBIT | 3.2B | 4.3B |
| Interest Expense | 0.39B | 0.33B |
| Net Income | 2.3B | 2.8B |
| EPS | 4.06 | 20.62 |
| Fiscal Year | 2025 | 2025 |
Income Statement Analysis: The Bottom-Line Duel
This income statement comparison reveals how efficiently Emerson Electric and Cummins translate sales into profit, highlighting their operational strengths and weaknesses.
Emerson Electric Co. Analysis
Emerson’s revenue grew steadily from 13.8B in 2022 to 18B in 2025, a 39% increase over five years. Net income, however, declined slightly overall, with 2.3B in 2025 down from a peak distorted by discontinued operations in 2023. The company maintains strong gross margins at 52.8% and a net margin of 12.7%, reflecting robust cost control and profitability momentum, boosted by a 35% EBIT growth last year.
Cummins Inc. Analysis
Cummins posted higher revenue, reaching 33.7B in 2025, up 40% since 2021, but its net income growth was more pronounced, rising 33% to 2.8B in 2025. Despite a lower gross margin of 25.3% and net margin of 8.4%, Cummins shows solid capital allocation with interest expense under 1%. Recent year metrics show slight revenue decline and a sharp drop in EBIT and net margin, signaling short-term headwinds.
Margin Strength vs. Scale and Growth
Emerson Electric leads in profitability and margin efficiency, delivering consistently higher gross and net margins with strong recent EBIT growth. Cummins commands greater scale and faster net income expansion over five years but faces margin pressure and recent profit decline. Investors seeking stable margin power will prefer Emerson, while those favoring robust top-line scale might lean toward Cummins despite its short-term challenges.
Financial Ratios Comparison
These vital ratios act as a diagnostic tool to expose the underlying fiscal health, valuation premiums, and capital efficiency of the companies compared below:
| Ratios | Emerson Electric Co. (EMR) | Cummins Inc. (CMI) |
|---|---|---|
| ROE | 11.31% | 23.02% |
| ROIC | 4.60% | 12.01% |
| P/E | 32.42 | 24.76 |
| P/B | 3.67 | 5.70 |
| Current Ratio | 0.88 | 1.76 |
| Quick Ratio | 0.65 | 1.16 |
| D/E | 0.68 | 0.59 |
| Debt-to-Assets | 32.79% | 21.30% |
| Interest Coverage | 5.78 | 12.14 |
| Asset Turnover | 0.43 | 0.99 |
| Fixed Asset Turnover | 5.14 | 4.84 |
| Payout ratio | 51.98% | 37.11% |
| Dividend yield | 1.60% | 1.50% |
| Fiscal Year | 2025 | 2025 |
Efficiency & Valuation Duel: The Vital Signs
Financial ratios serve as a company’s DNA, exposing hidden risks and operational strengths crucial for investment insight.
Emerson Electric Co.
Emerson shows moderate profitability with an 11.3% ROE and a favorable 12.7% net margin, but its 32.4 P/E signals an expensive valuation. The company’s 3.67 P/B and weak current ratio (0.88) highlight liquidity concerns. Emerson offers a 1.6% dividend yield, balancing shareholder returns amid reinvestment limits.
Cummins Inc.
Cummins delivers strong profitability with a 23.0% ROE and a solid 8.4% net margin, supported by a reasonable 24.8 P/E. Its healthier liquidity ratios (current ratio 1.76) and lower debt-to-assets (21.3%) indicate operational efficiency. Cummins maintains a 1.5% dividend yield alongside favorable capital returns, reflecting disciplined capital allocation.
Valuation Stretch vs. Operational Strength
Cummins offers a better balance of profitability and liquidity with fewer red flags than Emerson. While Emerson’s valuation appears stretched, Cummins presents a more efficient operational profile. Investors prioritizing stability and returns might favor Cummins’ robust fundamentals over Emerson’s premium pricing.
Which one offers the Superior Shareholder Reward?
I compare Emerson Electric Co. (EMR) and Cummins Inc. (CMI) on dividends and buybacks for 2026. EMR yields 1.6% with a high 52% payout, covering dividends comfortably with free cash flow of 4.7/share. CMI offers a 1.5% yield and a lower 37% payout, but free cash flow of 17.3/share supports its $7.65 dividend well. EMR’s buyback intensity is moderate, while CMI’s larger free cash flow fuels more aggressive buybacks, enhancing total returns. I see CMI’s balanced reinvestment and buyback strategy as more sustainable and rewarding long-term. Thus, I favor Cummins for superior total shareholder reward in 2026.
Comparative Score Analysis: The Strategic Profile
The radar chart reveals the fundamental DNA and trade-offs of Emerson Electric Co. and Cummins Inc., highlighting their financial strengths and valuation nuances:
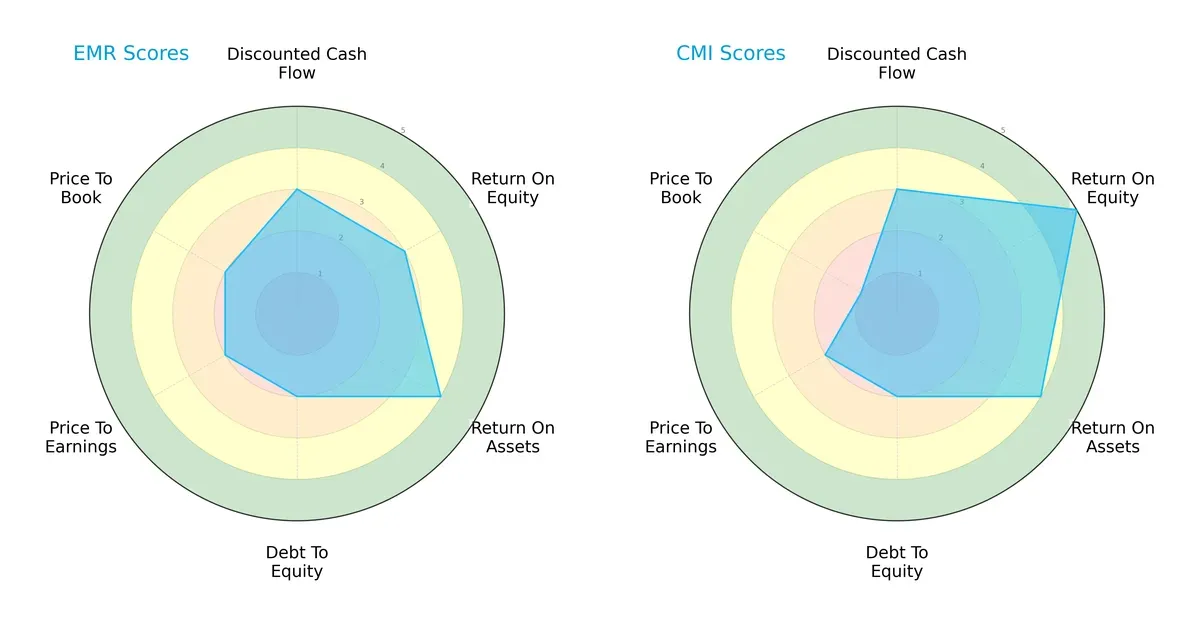
Cummins leads decisively in Return on Equity with a very favorable score of 5, compared to Emerson’s moderate 3. Both firms share solid Return on Assets at 4, showing efficient asset use. However, Emerson lags with weaker Debt/Equity and valuation scores (both 2), indicating higher financial risk and less attractive market pricing. Cummins’ slightly worse Price-to-Book score (1) suggests it may command a premium valuation. Overall, Cummins displays a more balanced profile driven by superior profitability, while Emerson depends on moderate asset efficiency but struggles with leverage and valuation metrics.
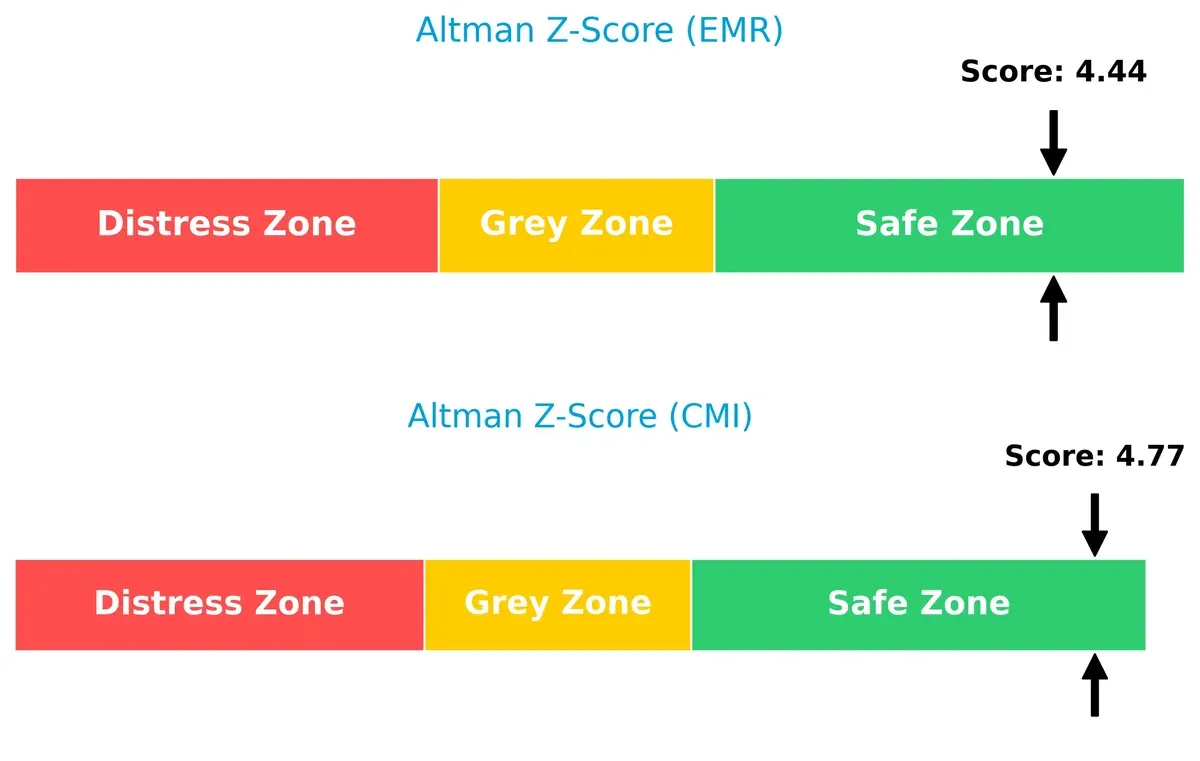
Bankruptcy Risk: Solvency Showdown
Emerson and Cummins both reside comfortably in the safe zone with Altman Z-Scores above 4, indicating low bankruptcy risk and strong solvency in the current market cycle:
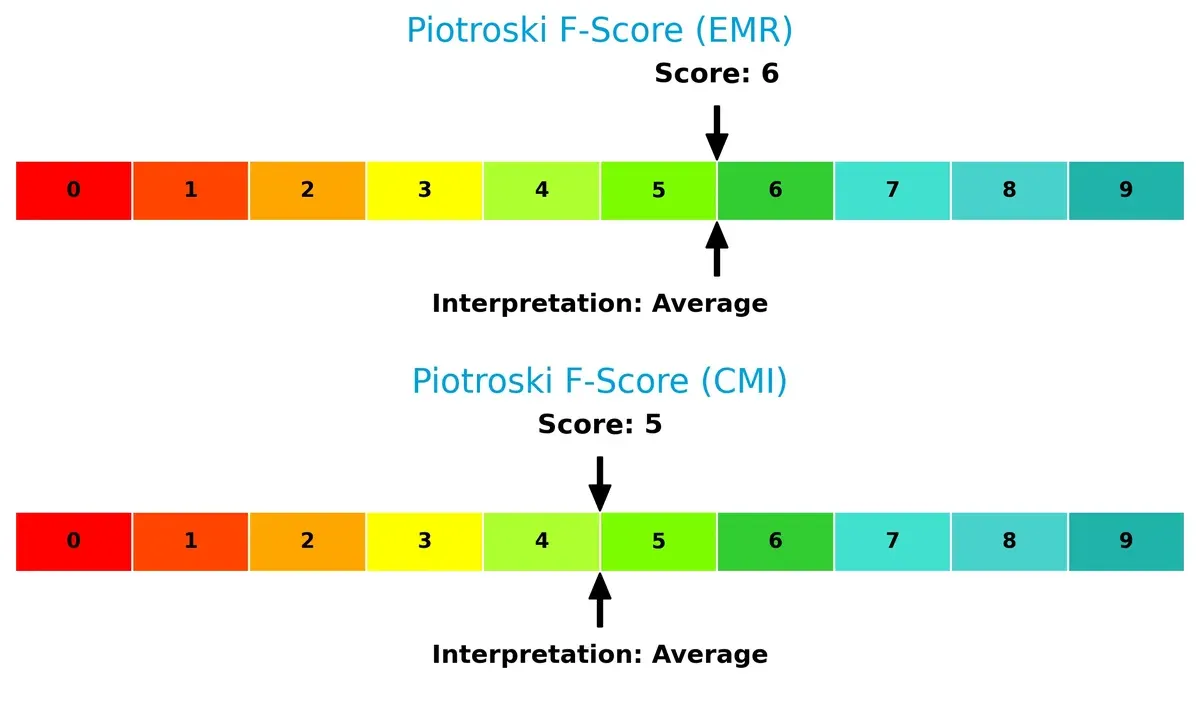
Financial Health: Quality of Operations
Emerson scores a 6 on the Piotroski F-Score, slightly outperforming Cummins’ 5, suggesting Emerson maintains marginally stronger internal financial health and operational quality. Neither firm shows critical red flags, but Cummins’ score points to room for improvement:
How are the two companies positioned?
This section dissects Emerson Electric and Cummins by comparing their revenue distribution and internal dynamics. The goal is to confront their economic moats to identify which offers the most resilient competitive advantage today.
Revenue Segmentation: The Strategic Mix
This visual comparison dissects how Emerson Electric Co. and Cummins Inc. diversify their income streams and reveals where their primary sector bets lie:
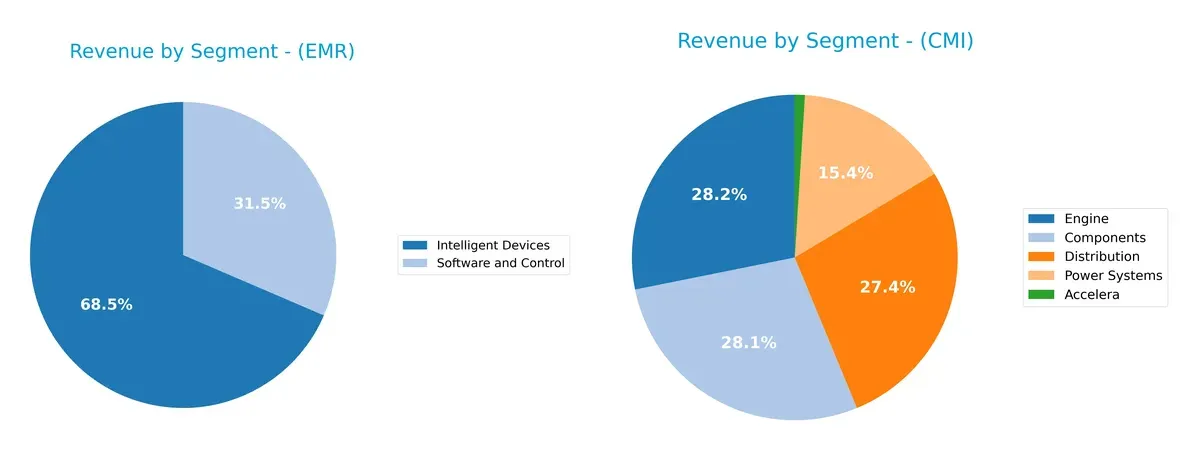
Emerson Electric Co. pivots sharply on Intelligent Devices at $12.4B and Software and Control at $5.7B, showing moderate diversification. Cummins Inc. presents a more balanced spread, with Engines at $11.7B, Components at $11.7B, and Distribution at $11.4B anchoring revenue. Emerson’s concentration risks ecosystem shifts, while Cummins leverages infrastructure dominance and supply chain breadth for stability and resilience.
Strengths and Weaknesses Comparison
This table compares the Strengths and Weaknesses of Emerson Electric Co. and Cummins Inc.:
Emerson Electric Co. Strengths
- Diversified product segments including Intelligent Devices and Software
- Favorable net margin at 12.73%
- Strong interest coverage at 8.19x
- Robust fixed asset turnover at 5.14
- Significant global sales across Americas, Asia, Europe
Cummins Inc. Strengths
- High ROE at 23.02% and ROIC at 12.01%, outperforming WACC
- Favorable current and quick ratios indicating liquidity
- Strong interest coverage at 13.05x
- Solid asset turnover near 1.0
- Large revenue base especially in U.S. and China
Emerson Electric Co. Weaknesses
- Unfavorable ROIC below WACC at 4.6%
- Low current and quick ratios below 1.0 raise liquidity concerns
- Unfavorable valuation metrics with high P/E and P/B
- Moderate debt levels with neutral leverage
- Asset turnover at 0.43 suggests less efficient asset use
Cummins Inc. Weaknesses
- Unfavorable P/B ratio at 5.7 signals high valuation
- Neutral net margin lower than Emerson’s
- Slightly higher debt-to-assets ratio than ideal
- Revenue decline in Total Segment indicates potential challenges
Both companies show strengths in profitability and global presence but face challenges in valuation and liquidity metrics. Emerson’s weaker ROIC and liquidity ratios may constrain capital efficiency, while Cummins’ valuation and segment revenue trends suggest caution in growth sustainability.
The Moat Duel: Analyzing Competitive Defensibility
A structural moat is the only true defense protecting long-term profits from relentless competition erosion. Let’s dissect the moats of Emerson Electric and Cummins Inc.:
Emerson Electric Co.: Intangible Assets and Diversification Moat
Emerson leverages diverse industrial solutions and brand reputation, reflected in stable 52.8% gross margins and strong EBIT margins near 17.6%. However, its declining ROIC vs. WACC signals weakening capital efficiency in 2026, threatening moat durability.
Cummins Inc.: Cost Advantage and Technological Innovation Moat
Cummins excels with efficient engine manufacturing and innovation in electrified powertrains, sustaining a 25.3% gross margin and positive ROIC premium over WACC. Despite a slight ROIC decline, Cummins maintains value creation and expands into green tech markets.
The Moat Battle: Intangible Diversification vs. Cost-Driven Innovation
Cummins holds the deeper moat by consistently creating value above its cost of capital, unlike Emerson, which destroys value with declining ROIC. Cummins is better positioned to defend and grow market share amid evolving industrial demands.
Which stock offers better returns?
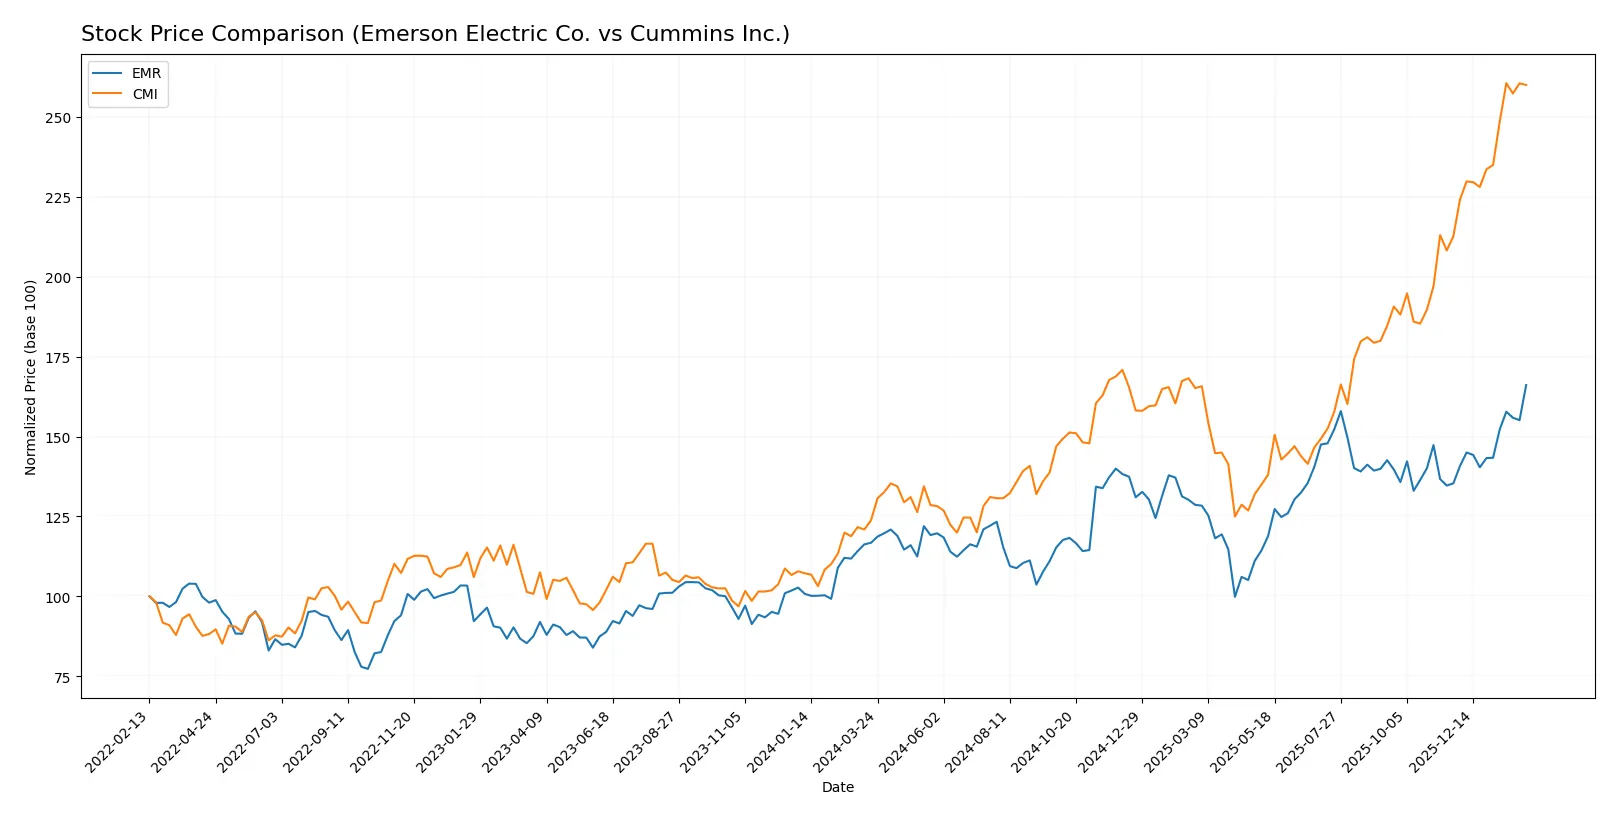
Over the past 12 months, both Emerson Electric Co. and Cummins Inc. showed strong price gains with accelerating bullish trends, reflecting robust investor demand and significant upward momentum.
Trend Comparison
Emerson Electric Co. gained 42.31% over the past year, exhibiting a bullish trend with accelerating momentum and moderate volatility (std. dev. 13.47). The stock hit a high of 157.38 and a low of 94.57.
Cummins Inc. surged 110.21% in the same period, also showing an accelerating bullish trend but with much higher volatility (std. dev. 79.49). It recorded a peak price of 578.94 and a low of 266.48.
Cummins Inc. delivered the highest market performance, more than doubling Emerson Electric Co.’s price appreciation despite greater price swings.
Target Prices
Analysts present a confident target price range for Emerson Electric Co. and Cummins Inc., signaling positive outlooks.
| Company | Target Low | Target High | Consensus |
|---|---|---|---|
| Emerson Electric Co. | 125 | 185 | 163.64 |
| Cummins Inc. | 540 | 703 | 606.1 |
The consensus targets for Emerson and Cummins exceed their current prices of 157.38 and 577.73, respectively, indicating expected appreciation. Both stocks show analyst optimism relative to their market valuations.

Don’t Let Luck Decide Your Entry Point
Optimize your entry points with our advanced ProRealTime indicators. You’ll get efficient buy signals with precise price targets for maximum performance. Start outperforming now!
How do institutions grade them?
The following tables summarize recent institutional grades for Emerson Electric Co. and Cummins Inc.:
Emerson Electric Co. Grades
This table shows Emerson Electric Co.’s latest grades from prominent financial institutions.
| Grading Company | Action | New Grade | Date |
|---|---|---|---|
| Evercore ISI Group | Maintain | Outperform | 2026-02-05 |
| Deutsche Bank | Downgrade | Hold | 2026-02-05 |
| Wells Fargo | Maintain | Equal Weight | 2026-02-04 |
| Citigroup | Maintain | Buy | 2026-02-04 |
| Oppenheimer | Downgrade | Perform | 2026-01-27 |
| JP Morgan | Maintain | Neutral | 2026-01-16 |
| Wells Fargo | Maintain | Equal Weight | 2026-01-07 |
| Barclays | Maintain | Equal Weight | 2026-01-07 |
| UBS | Upgrade | Buy | 2026-01-05 |
| Jefferies | Downgrade | Hold | 2025-12-10 |
Cummins Inc. Grades
This table presents Cummins Inc.’s recent grades from well-known financial firms.
| Grading Company | Action | New Grade | Date |
|---|---|---|---|
| Truist Securities | Maintain | Buy | 2026-02-06 |
| Wolfe Research | Downgrade | Peer Perform | 2026-01-26 |
| Barclays | Maintain | Overweight | 2026-01-23 |
| Wells Fargo | Maintain | Overweight | 2026-01-23 |
| JP Morgan | Maintain | Neutral | 2026-01-14 |
| Citigroup | Maintain | Buy | 2026-01-13 |
| Raymond James | Upgrade | Outperform | 2025-12-22 |
| Barclays | Upgrade | Overweight | 2025-12-19 |
| Truist Securities | Maintain | Buy | 2025-12-18 |
| Citigroup | Maintain | Buy | 2025-12-11 |
Which company has the best grades?
Cummins Inc. holds a stronger consensus with multiple “Buy,” “Overweight,” and “Outperform” grades. Emerson Electric’s ratings are more mixed, including downgrades to “Hold” and “Perform.” Investors may interpret Cummins’ ratings as signaling more confidence in future performance.
Risks specific to each company
The following categories identify the critical pressure points and systemic threats facing Emerson Electric Co. and Cummins Inc. in the 2026 market environment:
1. Market & Competition
Emerson Electric Co.
- Faces pressure from diversified industrial machinery competitors and must innovate in automation solutions.
Cummins Inc.
- Competes in powertrain and engine markets, challenged by transition to electrification and emission standards.
2. Capital Structure & Debt
Emerson Electric Co.
- Moderate leverage with debt-to-assets at 32.8%, but weak liquidity ratios raise caution.
Cummins Inc.
- Lower leverage at 21.3% debt-to-assets and strong liquidity, indicating disciplined capital structure.
3. Stock Volatility
Emerson Electric Co.
- Beta of 1.25 suggests above-market volatility; price range relatively stable but sensitive to industrial cycles.
Cummins Inc.
- Beta of 1.12 shows moderate volatility; wider price range reflects sensitivity to powertrain market shifts.
4. Regulatory & Legal
Emerson Electric Co.
- Exposure to regulatory changes across multiple industry segments including energy and environment.
Cummins Inc.
- Faces stringent emissions regulations impacting product design and compliance costs globally.
5. Supply Chain & Operations
Emerson Electric Co.
- Complex global supply chain servicing diverse sectors; vulnerable to disruptions and cost inflation.
Cummins Inc.
- Integrated manufacturing with exposure to raw materials and component supply risks, especially for electrification parts.
6. ESG & Climate Transition
Emerson Electric Co.
- Must accelerate climate initiatives amid increasing demand for energy-efficient solutions.
Cummins Inc.
- Leading in electrified powertrain development but faces high investment and transition risks.
7. Geopolitical Exposure
Emerson Electric Co.
- Operates in diverse global markets, exposed to geopolitical tensions affecting industrial demand.
Cummins Inc.
- Global footprint in engine markets exposes it to trade and tariff uncertainties.
Which company shows a better risk-adjusted profile?
Cummins Inc. demonstrates a stronger risk-adjusted profile. Its lower leverage, superior liquidity, and favorable return on invested capital provide resilience. Emerson’s weaker liquidity and unfavorable ROIC vs. WACC highlight operational and financial vulnerabilities. Cummins’ leadership in electrification signals better positioning for regulatory and market shifts.
Final Verdict: Which stock to choose?
Emerson Electric Co. (EMR) demonstrates a superpower in its strong operational efficiency, reflected in solid gross and EBIT margins. However, its declining ROIC and tight liquidity ratios signal a point of vigilance. EMR might suit investors seeking steady income with exposure to industrial resilience but who accept moderate operational risks.
Cummins Inc. (CMI) commands a strategic moat through superior capital allocation and robust return on invested capital above its cost of capital. Its healthier balance sheet and higher interest coverage provide a safety cushion relative to EMR. CMI aligns well with growth-at-a-reasonable-price (GARP) investors who prefer a blend of growth and financial stability.
If you prioritize operational efficiency and margin strength, EMR is the compelling choice due to its consistent income statement performance despite some value erosion. However, if you seek value creation backed by a stronger moat and balance sheet stability, CMI offers better stability and growth potential, though at a premium valuation. Both demand prudence given cyclical industry challenges and evolving macroeconomic conditions.
Disclaimer: Investment carries a risk of loss of initial capital. The past performance is not a reliable indicator of future results. Be sure to understand risks before making an investment decision.
Go Further
I encourage you to read the complete analyses of Emerson Electric Co. and Cummins Inc. to enhance your investment decisions: